Abstract
Microbial consortia form when multiple species colocalize and communally generate a function that none is capable of alone. Consortia abound in nature, and their cooperative metabolic activities influence everything from biodiversity in the global food chain to human weight gain. Here, we present an engineered consortium in which the microbial members communicate with each other and exhibit a “consensus” gene expression response. Two colocalized populations of Escherichia coli converse bidirectionally by exchanging acyl-homoserine lactone signals. The consortium generates the gene-expression response if and only if both populations are present at sufficient cell densities. Because neither population can respond without the other's signal, this consensus function can be considered a logical AND gate in which the inputs are cell populations. The microbial consensus consortium operates in diverse growth modes, including in a biofilm, where it sustains its response for several days.
Keywords: biological engineering, cellular circuits, synthetic biology
Most bacteria live in heterogeneous surface-bound congregations called biofilms, and vast reaches of the earth are coated in these living films. In many cases, the microorganisms composing this ubiquitous coating form complex, interactive communities (1–5). Despite their abundance, these microbial communities are poorly understood. Reflecting this relative ignorance of how bacteria behave in biofilms, efforts to program biofilm functions are still in their infancy. The ability to manipulate these films, however, would enable controlled studies of microbial ecosystem dynamics and microscale environmental manipulation. To begin to explore these possibilities, we have engineered de novo cellular circuits that control Escherichia coli behavior in a stable, robust mixed-population biofilm community. The populations communicate, come to a consensus, and respond to each other's presence with a flexible, combinatory gene-expression output.
Engineered circuits have been used to control the behavior of single cells (6–12) and cell populations (8, 11, 13–15) in both time and space. Cell–cell communication is a prerequisite for coordination of cellular circuit dynamics on the population level. Engineered communication, via broadcasting and receiving small-molecule signals, can enable the programming of robust and predictable population dynamics (13). One-way engineered cell–cell communication has been used to coordinate biofilm formation in a single population at a predictable cell density (8) and to engineer pattern formation in a mixed population (14, 15). Here, we demonstrate an engineered bidirectional cell–cell communication network that can coordinate gene expression from a mixed population. We have characterized the spatial and temporal behavior of this communication network in liquid, agar, and biofilm growth systems.
Results and Discussion
Microbial Consensus Consortium (MCC) Design and Implementation.
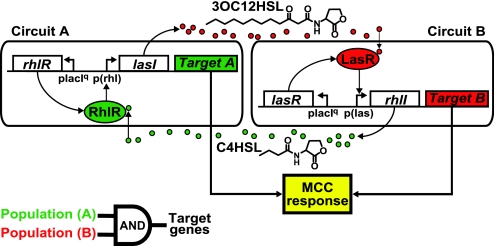
The MCC signaling network was constructed in E. coli from components of the LasI/LasR and RhlI/RhlR quorum sensing systems (16) found in Pseudomonas aeruginosa, an opportunistic pathogen that forms a biofilm in the lungs of cystic fibrosis patients (Fig. 1). These two systems enable P. aeruginosa cells to sense their environment and population density and correspondingly regulate hundreds of genes (17–19). LasI in Consensus Circuit A and RhlI in Consensus Circuit B catalyze the synthesis of the small acyl-homoserine lactone (acyl-HSL) signaling molecules 3-oxododecanoyl-HSL (3OC12HSL) and butanoyl-HSL (C4HSL). The LasR transcriptional regulator in Circuit B is activated by the 3OC12HSL signal emitted by Circuit A, whereas RhlR in Circuit A is activated by the C4HSL signal emitted by Circuit B. The acyl-HSL concentrations are low at low cell densities but rise as the densities of Circuit A and Circuit B cells increase. When the signal molecules accumulate at high enough concentrations to activate the R proteins, the active R proteins can up-regulate target gene expression. Thus, both Circuit A and Circuit B cells must be present and at sufficient density before generating a “consortium” response, in this case red and green fluorescence. The MCC signaling network implements a logical AND gate in which the two inputs are population levels of cells containing Circuit A and cells containing Circuit B, and the output is target gene expression by the two populations (Fig. 1, lower left corner).
Fig. 1.
The MCC. Two E. coli cell populations communicate by using P. aeruginosa quorum sensing components to achieve a consensus response. In Circuit A, the LasI protein catalyzes synthesis of 3OC12HSL. 3OC12HSL diffuses into cells containing Circuit B, forms a complex with LasR, and activates the Las promoter. Similarly, RhlI catalyzes production of C4HSL in Circuit B, which diffuses into Circuit A, forms a complex with RhlR, and activates the Rhl promoter. Expression of both Targets A and B constitutes the MCC response and can be regarded as implementing a logical AND gate operation (lower left) where the two cell populations are the inputs and target gene expression is the output. Detailed plasmid maps for these circuits are shown in SI Fig. 9.
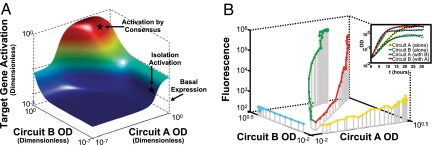
Proper function of the MCC is defined by minimal target gene expression when the cells grow in isolation (neither can generate a response without a signal from the other) and high target gene expression when they are colocalized in sufficient densities to activate the R proteins. Preventing a single MCC member population from self-activating in isolation requires minimal “crosstalk” interactions between the Rhl and Las signaling systems. This constraint means that the Rhl promoter p(rhl) must respond specifically to C4HSL, the primary RhlI product (20), and the Las promoter p(las) must respond specifically to 3OC12HSL, the primary LasI product (18, 21, 22). However, initial experiments revealed minor crosstalk between these promoter–activator pairs; particularly, p(rhl) responded to high levels of 3OC12HSL [supporting information (SI) Fig. 6]. Thus, engineering of the MCC began with modeling to investigate the effects of this crosstalk and how these effects might be mitigated. The model was used to choose between circuit designs based on their ability to minimize the population densities required for activation when Circuit A cells and Circuit B cells are grown together (activation by consensus), while maximizing the population densities required for self-activation when Circuit A cells and Circuit B cells are grown in isolation (isolation activation). The model suggests that the MCC should be designed with positive feedback on the I proteins, as illustrated in SI Figs. 7 and 8. The presence of the cognate signal, C4HSL, in cells containing Circuit A should be a prerequisite for expression of LasI and production of the signal 3OC12HSL; in this way, the crosstalk-signal concentration is minimized in the absence of Circuit B. Likewise, 3OC12HSL should up-regulate expression of RhlI in Circuit B, limiting the concentration of the crosstalk signal, C4HSL, in the absence of Circuit A. Modeling results illustrating target gene expression profiles in the presence of positive feedback are shown in Fig. 2A. The construction of Circuits A and B therefore proceeded with lasI under control of p(rhl) in Circuit A and rhlI under control of p(las) in Circuit B (Fig. 1 and SI Fig. 9).
Fig. 2.
Initial characterization of the MCC. (A) Modeling results depicting AND gate activity of the Circuit A and B populations. Target genes are expressed at high levels only when both populations are present at adequate population densities. To optimize performance of the AND gate, it is necessary to maximize the population density required for one population to self-activate (isolation activation) while minimizing the population density required for activation of each circuit in the presence of the other (activation by consensus). A more formal analysis is included in SI Text, Rate-Equation Based Model. (B) Liquid phase characterization of the MCC confirms the modeling results in A. Median single-cell fluorescence is depicted for each circuit as a function of the OD of cells containing Circuits A and B. When cells containing Circuits A and B are grown such that they can communicate with one another, fluorescence is >100-fold higher than when they are grown in isolation. Fluorescence with respect to time is illustrated in SI Fig. 10. Circuit A cells grow more slowly than Circuit B cells in liquid phase, possibly because a higher metabolic cost is associated with production of 3OC12HSL (from LasI in Circuit A) than production of C4HSL (from RhlI in Circuit B) or because high intracellular concentrations of 3OC12HSL may have toxic effects. However, both populations reach stationary phase within 20 h of growth in liquid culture (Inset).
MCC Validation in Liquid Culture.
We confirmed these design choices by initial characterization of the MCC system in liquid culture. To eliminate behavioral differences arising from variations in fluorophore maturation time and toxicity between Circuits A and B, we used GFP as the target gene in both circuits (GFP replaced Ds-Red; SI Fig. 9). Cells containing each circuit were grown in isolation. Single-cell fluorescence measured as a function of time demonstrated that isolated circuits are unable to produce a significant response (Fig. 2B and SI Fig. 10). Cells containing the two circuits were also grown in separate chambers that allowed passage of small molecules between the two populations through a 0.2-μm membrane. When the two circuits were allowed to communicate with one another and grow to sufficient density, responses from both were >100-fold greater than the responses of the circuits in isolation (Fig. 2B and SI Fig. 10). These results confirm our model-based design and verify that the response is specific and combinatorial: MCC components are distributed among different cell populations, providing response control based on presence or absence of one of the cell populations from the mixture.
MCC Behavior Requires Colocalization.
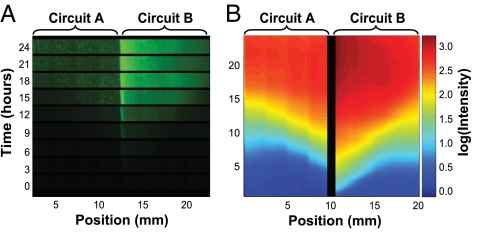
To explore the need for colocalization in preparation for biofilm experiments, we tested MCC function in solid-phase cultures. Circuit A cells were embedded in solid medium and placed in physical contact with solid medium containing the same density of Circuit B cells (Fig. 3A). Function of both circuits was again indicated by green fluorescence to enable quantitative comparison, and images of green fluorescence were captured every 30 min. Image analysis (Fig. 3B) revealed that, in the Circuit B cells closest to Circuit A, fluorescence emerges within a few hours. The response of Circuit A cells as a whole is lower than that of Circuit B cells, likely because of the slower growth of Circuit A cells (Fig. 2B Inset). Both populations reach maximal reporter-gene expression within 20 h of incubation in spatial proximity and maintain these fluorescence levels through at least 24 h (Fig. 3B). The level of fluorescence decreases with distance from the interface, reflecting the signal gradient. This finding illustrates the requirement that cells containing Circuit A and cells containing Circuit B must grow to adequate cell densities in spatial proximity to one another to generate the consensus response.
Fig. 3.
The MCC response is achieved by spatial colocalization of cells containing Circuits A and B. (A) A gradient of fluorescence emerges from the interface between an agar slice with embedded Circuit A cells and another slice with embedded Circuit B cells. (B) Image analysis of the experiment in A, depicting the log of fluorescence. The pixels immediately surrounding the interface between agar slices were not quantified and were replaced with a black strip, because fluorescence in the boundary region may not accurately represent target-gene expression. Details regarding image processing are available in SI Text, Solid-Phase Imaging Equipment and Settings.
MCC Function in Biofilms.
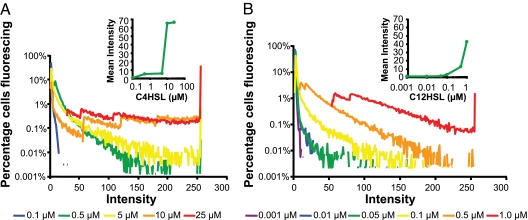
Biofilms enable spatially proximate, sheltered bacterial growth and provide for development of predictable environmental niches in otherwise changeable macroenvironments (23). The ability to engineer living films may enable unprecedented stand-alone sensor design and environmental manipulation opportunities. To explore these possibilities, we studied the behavior of MCC circuit-containing cells growing in biofilms (SI Fig. 11). First, thin conformal biofilms were imaged by a confocal laser scanning microscope to determine whether Circuit A and B cells would respond to increasing concentrations of acyl-HSL with increasing levels of fluorescence in the same way that they do when grown in liquid and solid cultures. No biofilms used in this analysis were allowed to grow deeper than 10 μm, removing acyl-HSL diffusion through the biofilm as a variable. All cells expressed a constitutive cyan fluorescent protein, enhanced cyan fluorescent protein (eCFP), to enable total cell counts (24), and both circuit responses were indicated by green fluorescence. Results revealed that Circuit A and Circuit B cells are individually able to initiate and maintain healthy monoculture biofilms for periods of up to 2 weeks. Consistent with the liquid phase results, both populations respond strongly to their cognate acyl-HSL, and Circuit B cells exhibit greater sensitivity to exogenous acyl-HSL than Circuit A cells (Fig. 4).
Fig. 4.
Monoculture biofilms respond to higher concentrations of acyl-HSL with higher levels of GFP expression. (A) Circuit A fluoresces minimally when 0.1 μM C4HSL is administered (blue), but fluorescence increases at 0.5 μM (green) and 5.0 μM (yellow) C4HSL, and saturates at 10 μM (orange) and 25 μM (red) C4HSL. (Inset) Mean fluorescence at each C4HSL concentration. (B) Circuit B fluoresces minimally in response to 0.001 μM (purple) C12HSL, but fluorescence increases at 0.01 μM (blue), 0.05 μM (green), 0.1 μM (yellow), and 0.5 μM (orange) C12HSL, and saturates at 1.0 μM (red) C12HSL. (Inset) Mean fluorescence at each C12HSL concentration. Details regarding image processing are available in SI Text, Biofilm Imaging Equipment and Settings.
Mixed-culture MCC biofilms were then monitored by a confocal laser scanning microscope. In contrast to the thin biofilm dosage experiments detailed above, in which acyl-HSL was provided exogenously and concentration was uniform throughout, here, the medium served as a sink for endogenously produced signals. Therefore, the biofilms examined in the mixed-culture MCC analysis were allowed to grow deeper than the monoculture biofilms so that signal molecules from Circuits A and B could accumulate. These biofilms grew no deeper than 80 μm, a depth at which oxygen diffusion is not a variable in fluorophore expression (25). Circuit A function was identified by green fluorescence and Circuit B function was identified by red fluorescence.
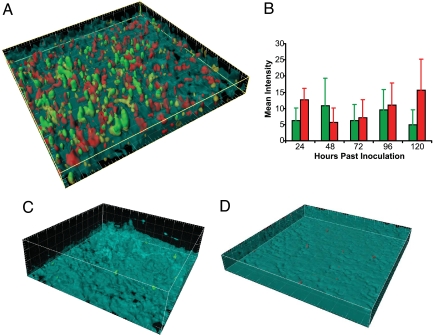
As demonstrated in Fig. 5A, Circuit A and B cells grow together and display MCC function in the mixed culture biofilm. Images of MCC biofilms taken between 24 and 120 h after biofilm inoculation reveal that Circuits A and B grow in intimate contact within the biofilms. Cells containing Circuit A grow more slowly than Circuit B cells in liquid culture (Fig. 2B Inset); Circuit A cells grow more slowly in the biofilm, as well. Consistent with the liquid- and solid-phase results, fluorescence emerges in both strains within 24–36 h of inoculation (Fig. 5B). Steady MCC behavior, similar to that illustrated in Fig. 5A, is observed for at least 6 days after inoculation, after which time biofilm depth generally exceeds the 80-μm experimental limit (Fig. 5B). Neither circuit exhibits significant fluorescence when grown separately in a similarly thick monoculture biofilm (Fig. 5 C and D). These results demonstrate sustained and specific consensus consortium behavior in an engineered biofilm.
Fig. 5.
The MCC functions for at least 6 days when grown in a biofilm. (A) Three-dimensional rendering of an MCC biofilm, 24 h after inoculation, shows that both Circuit A and B cells are present and fluorescing. Circuit A cells constitutively express enhanced yellow fluorescent protein (eYFP; shown in yellow) and express GFP when the circuit is “on.” Circuit B cells constitutively express enhanced cyan fluorescent protein (eCFP; shown in cyan) and express ds-Red when the circuit is “on.” Circuit A cells are a minority, possibly because of their slower growth. (B) Mean intensities for Circuit A and Circuit B cells remain significant for at least 120 h after inoculation. (C) Monoculture biofilms of Circuit A cells fluoresce minimally. (D) Monoculture biofilms of Circuit B cells fluoresce minimally. All gridlines are 20 μm apart. Details regarding image processing are available in SI Text, Biofilm Imaging Equipment and Settings.
E. coli can be engineered to detect and respond to highly varied stimuli including temperature, pH, gas concentrations, and liquid concentrations (8, 14, 26, 27). The MCC's population-level AND gate enables a convenient and efficient integration of the function of multiple engineered cells that have each been specialized to sense and respond to particular conditions. The MCC might also be engineered into existing industrial strains, for example, to guarantee that in mixed-culture batch reactors, optimal population densities are reached before onset of multispecies enzymatic activity. We have demonstrated that E. coli growing in biofilms can be engineered like their planktonic counterparts. Communication among the cell populations in the MCC biofilm is essential, and it is noteworthy that some bacteria naturally depend on quorum sensing to coordinate biofilm formation (28, 29), whereas others are known to disrupt their competitors' biofilms by intercepting these signals (30). An engineered living film could comprise such natural systems and be tuned to interact with them to engineer its environment. For example, such an engineered biofilm might be used to better understand the interactions, or to interrupt the normal processes, of a quorum-sensing dependent pathogenic biofilm.
In establishing the MCC, we have taken a step toward such an engineered living film. The consensus response might be composed of an enzyme and prodrug pair, or two inactive fragments of a toxin. Leakage from either circuit in the absence of its partner or without adequate population density would be inert, but a highly targeted therapeutic or destructive response would occur where and when the MCC becomes active. This type of multisignal engineered living film could also be expanded to include many conversation partners and to incorporate communication mechanisms other than quorum sensing. Potential applications of such multisignal, synthetic multicellular systems include synthesis of materials (31) in response to integrated stimuli or surveillance and early detection of environmental changes related to epidemiology or material degradation. As a medical technology, an engineered biofilm consortium might eliminate unwanted infection or even destroy harmful cells in the body (32). In such applications, the engineered bacterial biofilm consortium would carry out its function over long periods of time, under a variety of conditions, with minimal human awareness or intervention.
Methods
Plasmids.
The Circuit A plasmid pFNK-601 encodes lasI and gfp(LVA) under control of the Pseudomonas aeruginosa rhlAB promoter (qsc119), as well as constitutive RhlR production from the p(lacIq) promoter. This plasmid was constructed from a PCR amplified fragment of P. aeruginosa PAO-1 containing the lasI gene and from the Receiver A plasmid pFNK-202-qsc119 (33), shown in SI Fig. 6a. The Circuit B plasmid pFNK-602 expresses rhlI and gfp(LVA) from the P. aeruginosa p(las) promoter p(rsal). This plasmid also encodes constitutive lasR from the p(lacIq) promoter. Plasmid pFNK-602 was constructed by inserting rhlI into parent plasmid pFNK-503-qscrsaL. Plasmid pFNK-503-qscrsaL is the Receiver B plasmid (SI Fig. 6a) and expresses lasR from p(lacIq) and gfp(LVA) from the P. aeruginosa p(rsal) promoter. Plasmid pFNK-602-red was constructed by replacing gfp(LVA) in pFNK-602 with dsred-exp from Clontech plasmid pDsRed-Exp. These plasmids are illustrated in SI Fig. 9.
Model and Simulations.
Continuous differential equations were used to model promoter activation by R proteins, I protein production and degradation (which is proportional to target protein expression at steady state), acyl-HSL synthesis and degradation, and saturation of acyl-HSL synthesis. The model is described in detail in SI Text, Rate-Equation-Based Model.
Liquid-Phase Data Acquisition and Analysis.
To study the MCC response in liquid phase, starter cultures of E. coli JM2.300 cells [F− lacI22 λ− e14− rpsL135(StrR) thi-1] harboring either Circuit A or Circuit B plasmids were grown to OD <0.3 in M9 medium (2 mM MgSO4/0.2% casamino acids/0.5% glycerol/300 μM thiamine) with 50 μg ml−1 kanamycin at 37°C in a shaking incubator. The cells were then washed and diluted to an OD of 0.02 in M9 medium supplemented with 50 μg ml−1 kanamycin. Holes were bored into the sides of two 50-ml Corning (Corning, NY) centrifuge tubes, and 20 ml of the Circuit A dilution was placed in one tube, and 20 ml of the Circuit B dilution was placed in the other. A Millipore (Billerica, MA) Steriflip vacuum filtration unit was used to provide a 0.22 μM filter interface between the two cultures for the consensus experiments. Both 50-ml tubes were affixed horizontally to the platform of a shaker at 37°C. Every hour, 1-ml samples were taken from each tube and replaced with 1 ml of fresh M9 medium. Sample OD was measured by using a Beckman Coulter (Fullerton, CA) DU 800 spectrophotometer, and fluorescence measurements were taken on a Beckman Coulter Altra flow cytometer equipped with a 488-nm argon excitation laser and a 515–545 nm emission filter. Median fluorescence values were converted to equivalent fluorescein molecule counts by using SPHERO Rainbow Calibration Particles (Spherotech RCP-30-5A; Spherotech, Lake Forest, IL) that were measured during each session.
Solid-Phase Experiments.
Two starter cultures of E. coli JM2.300, one harboring the Circuit A plasmid and one harboring the Circuit B plasmid, were grown to OD <0.3 in M9 medium with 50 μg ml−1 kanamycin as described above. Cells from each culture were aliquotted into 6 ml of 37°C molten 1.5% low-melt agarose (SeaPlaque; Lonza, Rockland, ME) containing M9 and 50 μg ml−1 kanamycin to a final OD of 0.02. These solutions were poured into 60 × 15 mm Petri dishes (Falcon, Oxnard, CA), and rectangular segments containing either Circuit A or Circuit B were excised from the solidified products. A Circuit A segment was placed end to end with a circuit B segment in a sterile WillCo glass-bottom dish. The plate was then incubated at 37°C, and images were taken every 30 min by using a Zeiss (Thornwood, NY) Axiovert 200M microscope equipped with an AxioCam MR CCD camera. Images were captured with a ×2.5 brightfield objective and a GFP filter with 470/40 excitation and 525/50 emission. Additional information is available in SI Text, Solid-Phase Imaging Equipment and Settings.
Biofilm Experiments.
Starter cultures of E. coli JM2.300 harboring plasmid pMP4641 (24) and either the Circuit A or Circuit B plasmid were grown to saturation at 37°C in M9 biofilm medium (2 mM MgSO4/0.1% casamino acids/0.4% glucose/0.01% thymine/100 μM CaCl2) containing 50 μg ml−1 kanamycin and 20 μg ml−1 tetracycline. Starter cultures were then diluted to OD 0.2 in fresh M9 biofilm medium with 50 μg ml−1 kanamycin and 20 μg ml−1 tetracycline. Biofilms were grown in standard 1 × 4 × 40 mm flow chambers (Stovall Life Science, Greensboro, NC) with glass microscope coverslips. Monoculture biofilms were inoculated with 1 ml of the dilution of cells of the appropriate circuit, and MCC biofilms were inoculated with a mixture of 500 μl of each. After inoculation, flow chambers were incubated for 1 h without flow and then perfused at a low flow rate with M9 biofilm medium containing 50 μg ml−1 kanamycin and 20 μg ml−1 tetracycline. The flow chambers were incubated at 30°C. Images of the biofilms were captured at 24-h intervals with a Zeiss 510 upright confocal laser scanning microscope, controlled by Zeiss AIM. A Zeiss Achroplan ×40/0.8 W objective was used to capture all images. Images were captured with 512 × 512 pixel resolution, and all images used in quantitative comparisons were captured with identical pinhole and gain settings. Enhanced cyan fluorescent protein (eCFP) excitation: 458 nm with an Argon laser; emission filter: BP 480–520 nm. GFP excitation: 488 nm with an Argon laser; emission filter: BP 500–530 nm. ds-Red excitation: 543 nm with a Helium-neon laser; emission filter: LP 560 nm. Images were processed for quantitative comparison with custom-written Matlab-based tools. Three-dimensional rendering was performed in Imaris 4.5.2. Biofilms prepared solely for three-dimensional rendering incorporated a fourth fluorophore, enhanced yellow fluorescent protein (eYFP), on plasmid pMP4658 (24); excitation: 514 nm with an Argon laser; emission filter: LP 530 nm. More information regarding procedures, equipment settings, and processing can be found in SI Text, Biofilm Experimental Setup and Biofilm Imaging Equipment and Settings.
Supplementary Material
Acknowledgments
We thank Jared Leadbetter and Ernesto Andrianantoandro for discussions or comments on the manuscript; and Chris Waters, Tracy Teal, and the Caltech Biological Imaging Center for assistance with biofilm imaging. This material is based on work supported by 2005 National Science Foundation Emerging Models and Technologies for Computation Grant CCF-0523195 and 2006 National Institutes of Health Grants R01 GM074712-01A1 and 5R01CA118486-2.
Abbreviations
- HSL
homoserine lactone
- MCC
microbial consensus consortium
- 3OC12HSL
3-oxododecanoyl-HSL
- C4HSL
butanoyl-HSL.
Footnotes
The authors declare no conflict of interest.
This article is a PNAS Direct Submission.
This article contains supporting information online at www.pnas.org/cgi/content/full/0704256104/DC1.
References
- 1.Hooper LV, Midtvedt T, Gordon JI. Annu Rev Nutr. 2002;22:283–307. doi: 10.1146/annurev.nutr.22.011602.092259. [DOI] [PubMed] [Google Scholar]
- 2.Kato S, Haruta S, Cui ZJ, Ishii M, Igarashi Y. Appl Environ Microbiol. 2005;71:7099–7106. doi: 10.1128/AEM.71.11.7099-7106.2005. [DOI] [PMC free article] [PubMed] [Google Scholar]
- 3.Kleessen B, Blaut M. Br J Nutr. 2005;93(Suppl 1):S35–S40. doi: 10.1079/bjn20041346. [DOI] [PubMed] [Google Scholar]
- 4.Macfarlane S, Woodmansey EJ, Macfarlane GT. Appl Environ Microbiol. 2005;71:7483–7492. doi: 10.1128/AEM.71.11.7483-7492.2005. [DOI] [PMC free article] [PubMed] [Google Scholar]
- 5.Mishra S, Jyot J, Kuhad RC, Lal B. Curr Microbiol. 2001;43:328–335. doi: 10.1007/s002840010311. [DOI] [PubMed] [Google Scholar]
- 6.Becskei A, Serrano L. Nature. 2000;405:590–593. doi: 10.1038/35014651. [DOI] [PubMed] [Google Scholar]
- 7.Becskei A, Seraphin B, Serrano L. EMBO J. 2001;20:2528–2535. doi: 10.1093/emboj/20.10.2528. [DOI] [PMC free article] [PubMed] [Google Scholar]
- 8.Kobayashi H, Kaern M, Araki M, Chung K, Gardner TS, Cantor CR, Collins JJ. Proc Natl Acad Sci USA. 2004;101:8414–8419. doi: 10.1073/pnas.0402940101. [DOI] [PMC free article] [PubMed] [Google Scholar]
- 9.Kramer BP, Viretta AU, Daoud-El-Baba M, Aubel D, Weber W, Fussenegger M. Nat Biotechnol. 2004;22:867–870. doi: 10.1038/nbt980. [DOI] [PubMed] [Google Scholar]
- 10.Elowitz MB, Leibler S. Nature. 2000;403:335–358. doi: 10.1038/35002125. [DOI] [PubMed] [Google Scholar]
- 11.Bulter T, Lee SG, Wong WW, Fung E, Connor MR, Liao JC. Proc Natl Acad Sci USA. 2004;101:2299–2304. doi: 10.1073/pnas.0306484101. [DOI] [PMC free article] [PubMed] [Google Scholar]
- 12.Atkinson MR, Savageau MA, Myers JT, Ninfa AJ. Cell. 2003;113:597–607. doi: 10.1016/s0092-8674(03)00346-5. [DOI] [PubMed] [Google Scholar]
- 13.You L, Cox RS, Weiss R, Arnold FH. Nature. 2004;428:868–871. doi: 10.1038/nature02491. [DOI] [PubMed] [Google Scholar]
- 14.Basu S, Gerchman Y, Collins CH, Arnold FH, Weiss R. Nature. 2005;434:1130–1134. doi: 10.1038/nature03461. [DOI] [PubMed] [Google Scholar]
- 15.Basu S, Mehreja R, Thiberge S, Chen MT, Weiss R. Proc Natl Acad Sci USA. 2004;101:6355–6360. doi: 10.1073/pnas.0307571101. [DOI] [PMC free article] [PubMed] [Google Scholar]
- 16.Pesci EC, Iglewski BH. Trends Microbiol. 1997;5:132–134. doi: 10.1016/S0966-842X(97)01008-1. [DOI] [PubMed] [Google Scholar]
- 17.De Kievit TR, Gillis R, Marx S, Brown C, Iglewski BH. Appl Environ Microbiol. 2001;67:1865–1873. doi: 10.1128/AEM.67.4.1865-1873.2001. [DOI] [PMC free article] [PubMed] [Google Scholar]
- 18.Pearson JP, Gray KM, Passador L, Tucker KD, Eberhard A, Iglewski BH, Greenberg EP. Proc Natl Acad Sci USA. 1994;91:197–201. doi: 10.1073/pnas.91.1.197. [DOI] [PMC free article] [PubMed] [Google Scholar]
- 19.Pesci EC, Pearson JP, Seed PC, Iglewski BH. J Bacteriol. 1997;179:3127–3132. doi: 10.1128/jb.179.10.3127-3132.1997. [DOI] [PMC free article] [PubMed] [Google Scholar]
- 20.Winson MK, Camara M, Latifi A, Foglino M, Chhabra SR, Daykin M, Bally M, Chapon V, Salmond GP, Bycroft BW, et al. Proc Natl Acad Sci USA. 1995;92:9427–9431. doi: 10.1073/pnas.92.20.9427. [DOI] [PMC free article] [PubMed] [Google Scholar]
- 21.Passador L, Tucker KD, Guertin KR, Journet MP, Kende AS, Iglewski BH. J Bacteriol. 1996;178:5995–6000. doi: 10.1128/jb.178.20.5995-6000.1996. [DOI] [PMC free article] [PubMed] [Google Scholar]
- 22.Gould TA, Herman J, Krank J, Murphy RC, Churchill ME. J Bacteriol. 2006;188:773–783. doi: 10.1128/JB.188.2.773-783.2006. [DOI] [PMC free article] [PubMed] [Google Scholar]
- 23.Christensen BB, Haagensen JA, Heydorn A, Molin S. Appl Environ Microbiol. 2002;68:2495–2502. doi: 10.1128/AEM.68.5.2495-2502.2002. [DOI] [PMC free article] [PubMed] [Google Scholar]
- 24.Bloemberg GV, Wijfjes AH, Lamers GE, Stuurman N, Lugtenberg BJ. Mol Plant–Microbe Interact. 2000;13:1170–1176. doi: 10.1094/MPMI.2000.13.11.1170. [DOI] [PubMed] [Google Scholar]
- 25.Sternberg C, Christensen BB, Johansen T, Toftgaard Nielsen A, Andersen JB, Givskov M, Molin S. Appl Environ Microbiol. 1999;65:4108–4117. doi: 10.1128/aem.65.9.4108-4117.1999. [DOI] [PMC free article] [PubMed] [Google Scholar]
- 26.Anderson JC, Clarke EJ, Arkin AP, Voigt CA. J Mol Biol. 2006;355:619–627. doi: 10.1016/j.jmb.2005.10.076. [DOI] [PubMed] [Google Scholar]
- 27.Levskaya A, Chevalier AA, Tabor JJ, Simpson ZB, Lavery LA, Levy M, Davidson EA, Scouras A, Ellington AD, Marcotte EM, Voigt CA. Nature. 2005;438:441–442. doi: 10.1038/nature04405. [DOI] [PubMed] [Google Scholar]
- 28.Eberl L. Syst Appl Microbiol. 1999;22:493–506. doi: 10.1016/S0723-2020(99)80001-0. [DOI] [PubMed] [Google Scholar]
- 29.Parsek MR, Greenberg EP. Trends Microbiol. 2005;13:27–33. doi: 10.1016/j.tim.2004.11.007. [DOI] [PubMed] [Google Scholar]
- 30.Houdt R, Aertsen A, Moons P, Vanoirbeek K, Michiels CW. FEMS Microbiol Lett. 2006;256:83–89. doi: 10.1111/j.1574-6968.2006.00103.x. [DOI] [PubMed] [Google Scholar]
- 31.Klaus T, Joerger R, Olsson E, Granqvist CG. Proc Natl Acad Sci USA. 1999;96:13611–13614. doi: 10.1073/pnas.96.24.13611. [DOI] [PMC free article] [PubMed] [Google Scholar]
- 32.Swartz JR. Curr Opin Biotechnol. 2001;12:195–201. doi: 10.1016/s0958-1669(00)00199-3. [DOI] [PubMed] [Google Scholar]
- 33.Karig D, Weiss R. Biotechnol Bioeng. 2005;89:709–718. doi: 10.1002/bit.20371. [DOI] [PubMed] [Google Scholar]
Associated Data
This section collects any data citations, data availability statements, or supplementary materials included in this article.


