

Abstract
We report a method to detect label-free oligonucleotide targets. The conformation of surface-tethered probe nucleic acids is modulated by alternating electric fields, which cause the molecules to extend away from or fold onto the biased surface. Binding (hybridization) of targets to the single-stranded probes results in a pronounced enhancement of the layer-height modulation amplitude, monitored optically in real time. The method features an exceptional detection limit of <3 × 10⁸ bound targets per cm2 sensor area. Single base-pair mismatches in the sequences of DNA complements may readily be identified; moreover, binding kinetics and binding affinities can be determined with high accuracy. When driving the DNA to oscillate at frequencies in the kHz regime, distinct switching kinetics are revealed for single- and double-stranded DNA. Molecular dynamics are used to identify the binding state of molecules according to their characteristic kinetic fingerprints by using a chip-compatible detection format.
Keywords: fluorescence, sensor, SNP, affinity, energy transfer
With the advent of the “genomic era,” nucleic acid testing technologies have become more important than ever (1, 2). The development of oligonucleotide microarrays (3), which are DNA sensors featuring a high degree of parallelization in a chip-type format, had a tremendous impact on molecular biology and diagnostics. Today, “DNA chips” are used in numerous research laboratories for, e.g., the detection of polymorphisms in genomic DNA or RNA expression analysis. The most prominent assays are based on fluorescence methods (4), which require the cost- and labor-intensive chemical modification (labeling) of target and probe sequences with dye tags before testing. Despite their success (recently, the U.S. Food and Drug Administration approved the first DNA microarray chip as a diagnostic device), comparative experiments performed on different commercial platforms revealed disturbingly divergent results in the past (5). Alternatively, a variety of detection schemes is currently under investigation, ranging from surface plasmon resonance sensors (6, 7), electrochemical methods (8, 9), mass sensors (10), and DNA conductivity (11), to electronic field effect sensors (12, 13). In particular, it has been shown that electric field control enhances the performance of DNA microarrays and can be used to facilitate DNA transport to electrode pads (14, 15), manipulate hybridization and denaturation reactions (16), or stimulate cell lysis (17).
In this article, we introduce a methodology for the sequence-specific detection of target oligonucleotides by DNA layers. Conceptually different from established techniques where the surface immobilized nucleic acids act as passive probes, we demonstrate that the active manipulation of oligonucleotides on surfaces allows us to monitor the binding of label-free targets in real time. Recently, we found that the structural conformation of end-tethered DNA molecules on metal substrates can be “switched” (modulated) by ac electric fields (18–20). Based on the observation that the switching behavior of single strands differs from that of double-stranded helices, we devised a scheme to identify target-probe recognition (hybridization). Here, we elucidate the working principle and demonstrate the method's eligibility to provide real-time, quantitative, and sequence-specific data from which binding kinetics, affinity constants, and duplex melting transitions can be evaluated. Sequence variations can be detected with single-base-mismatch sensitivity, allowing the analysis of SNPs.
Unprecedented in the field of chip-based biosensors, molecular dynamics can be used for sensing purposes. When modulated at high frequencies, the induced motion depends on the intrinsic molecular properties of the involved nucleic acids, i.e., structural stiffness or hydrodynamic drag. Thus, by monitoring the dynamics of the DNA oscillation, distinct binding states can be identified according to their kinetic “fingerprint.” We believe that this unique functionality offers powerful means to analyze the binding of targets to DNA chips and therefore is a great leap forward in the search for a versatile, accurate, rapid, and sensitive DNA detection platform for diagnostic purposes.
A central component of the assay is the quenching of molecular fluorescence above a planar metal surface (21); the principles of the underlying energy transfer have been described in a number of reviews (22, 23) (note that the energy transfer efficiency, ET, between a dipole emitter and a metallic half-space, ET ∝ d−3, differs from the well known Förster resonance energy transfer between two dipoles, ET ∝ d−6). Recently, several groups have used this mechanism to characterize DNA molecules and alkylthiol coadsorbents on gold (24–26) and developed hybridization assays (27). Also, fluorescence self-interference constitutes an interesting complementary approach to quenching assays and has recently been used to study the conformation of DNA on silicon (28).
Results
Single-stranded oligonucleotides that are end-grafted to a gold surface constitute the sensor's basic element. Low molecule surface densities (<1011 cm−2) are a mandatory prerequisite to realize electrically switchable DNA layers (see Materials and Methods).
The average extension of the oligonucleotides from the surface (layer height) is monitored in situ and in real time by optical means. For that purpose the probe-oligonucleotides are modified with Cy3 fluorophores at their distal 5′ ends. Fig. 1 depicts the basic electro-optical measurement principle.
Fig. 1.

Measurement principle and geometry. (Lower) Gold electrodes modified with probe DNA are capped by a fluidic channel with analyte solution containing defined concentrations of target nucleic acid sequences. AC potentials are applied to the Au work electrode with respect to a Pt counter/reference electrode. (Upper) The applied ac field switches the negatively charged nucleotides between a tilted or upright conformation depending on whether the electrode is positively or negatively charged, respectively. Simultaneously, the current orientation of the nucleic acids is inferred from the fluorescence intensity emitted from dyes attached to the DNA's upper ends. Nonradiative energy transfer (ET) to surface plasmons in the metal substrate suppresses the fluorescence as the dyes approach the surface. Owing to its moderate distance dependence [ET ∝ d−3; d being the emitter–metal distance (22)], this quenching mechanism proves useful as a measure of length scales of 10 nm from the surface. In addition, photobleaching reactions are slowed and measurements over many hours are possible.
In the following, we discuss the different switching behavior of single- and double-stranded DNA molecules and explain how it may be used to monitor binding reactions between target and probe sequences. Then, we address the frequency response and molecular dynamics of the electrically driven DNA oscillation.
DNA Switching and Hybridization.
Fig. 2 shows representative switching experiments with end-tethered oligonucleotides and illustrates the hybridization effect. A low-frequency (0.2 Hz) square wave ac bias is applied to the gold electrode (Fig. 2A), while the fluorescence emitted by the Cy3-labeled DNA layer is observed simultaneously (Fig. 2B). Within each switching cycle, levels of high fluorescence intensity correspond to negative substrate potentials, whereas low intensities correspond to positive bias (compare also Fig. 1). We designate the difference between the upper and lower fluorescence levels as “switching amplitude.” It represents the electrically induced modulation of the layer thickness: during repulsive (negative) potentials the nucleic acids extend from the surface, whereas during attractive (positive) potentials they lie flat on the substrate. Here, the terms negative and positive are used with respect to the potential-of-zero charge, which is at approximately −0.2 V vs. Pt reference or 0.0 V vs. Ag/AgCl reference, respectively. Although not discussed in detail here, we note that monitoring the relative switching amplitude ΔF/F provides very useful information as well, for instance, about steric interactions between neighboring molecules within the layer (crowded layers feature low ΔF/F values) (18); moreover, photobleaching does not affect the relative switching amplitude.
Fig. 2.

Electrical switching and hybridization of DNA layers. (A) The potential applied to a gold electrode (vs. a Pt reference) that supports a layer comprised of 48-mer deoxyribonucleic acids of a mixed, nonself-complementary sequence. (B) The fluorescence emission of the Cy3-labeled DNA layer. The arrow marks the injection of 100 nM fully complementary targets that hybridize with the initially single-stranded probe layer (the association kinetics are limited by the pumping rate). Note that the target nucleic acids were label-free. (C) (Right) The schematic illustrates that flexible single strands are only partially aligned by the short ranged electric field (EAC) emanating from the electrode surface, but double-stranded helices may be oriented efficiently because of their intrinsic rigidity. (Left) Comparison of the hybridization of complementary sequences comprised of 24 and 48 nt and a noncomplementary control (1 μM) that exhibits negligible binding affinity. Long oligonucleotides give rise to strong signal enhancements, owing to the distance dependence of the fluorescence quenching mechanism. Binding kinetics were analyzed with a diffusion limited Langmuir adsorption isotherm, depicted as solid black lines.
For t < 0, Fig. 2B shows the switching response of a single-stranded 48-nt DNA layer. At t = 0, the hybridization of the layer is initiated by adding an excess concentration (100 nM) of unlabeled complementary 48-nt targets to the solution capping the probe-DNA layer. The binding of targets to the probe layer results in a marked and immediate increase in the measured switching amplitude; after the transformation from a single- to double-stranded layer is completed, the switching amplitude is enhanced by roughly one order of magnitude (in other measurements, enhancement factors >25 were observed).
The observed effect can be attributed to a combination of two circumstances, which are depicted in the schematic diagram in Fig. 2: (i) the electric field that emanates from the biased electrode surface decays rapidly over a distance of only a few nanometers (in comparison the Debye screening length in a solution containing 60 mM monovalent salt is ≈1.2 nm) because of the presence of an ionic screening cloud, the Gouy-Chapman layer (29). As a consequence, electric interactions are limited to merely a few nucleotides (base pairs) that are closest to the surface, the upper rest remain virtually unaffected (20). (ii) Single-stranded and double-stranded DNA molecules feature very distinct mechanical properties, which is particularly important on the length scale of oligonucleotides (order of 10 nm): single-stranded oligonucleotides must be regarded as almost perfectly flexible chains [persistence length ℓp ≈2 nm (30)], whereas double-stranded helices behave like rigid rods [ℓp ≈50 nm (31)].
Taken together, the conditions mentioned above indicate why dsDNA layers can be switched more effectively than single-stranded layers. Only the lower part of the flexible single strands is stabilized by the short-ranged repulsive field; the upper part adopts a random configuration. Rigid helices, on the contrary, may be oriented efficiently by the electric torque acting on their lower parts.
Sensitivity.
The detection sensitivity can be evaluated from the hybridization-induced amplitude increase and the rms signal noise levels (26- and 0.1-k counts, respectively; compare Fig. 2). Assuming a 100% hybridization efficiency [which is justified considering the low probe density on the surface; we have previously determined complete hybridization of low-coverage layers by using the electrochemical method of Steel et al. (32), in agreement with results from other groups (33, 34)], we estimate that the formation of one duplex of 200 single-stranded probes on the surface results in a detectable amplitude increase. Accounting for the low probe density of <5 × 1010 cm−2, this sensitivity corresponds to a detection limit of ≈3 × 10⁸ target-probe recognitions per cm2 sensor area (or 105 targets bound to an electrode of 0.1 mm diameter). For comparison, this value surpasses the detection limit of other label-free methods, e.g., surface plasmon resonance DNA sensors (>1011 cm−2) (6), by almost three orders of magnitude and approaches the limit of assays using dye-labeled targets. The sensitivity can be further enhanced when exploiting the high-frequency switching response (see Fig. 5 Inset).
Fig. 5.

Normalized frequency response of the DNA oscillation amplitude. Sine wave voltages (E = 0.1 V ± 0.21 Vrms vs. Ag/AgCl,) of varying frequencies were applied to 24- and 48-mer layers before and after hybridization with complementary target sequences. Symbols are data, lines have been computed using a two-state (up/down) model, fitting the transition time constants τ1, τ2 as free parameters. τ1, τ2 are: 310 and 345 μs for ss48; 225 and 260 μs for ds48; 130 and 290 μs for ss24; 90 and 240 μs for ds24. (Inset) Plotting the hybridization induced modulation enhancement (ΔFds/ΔFss, 48-mer data) versus the frequency reveals a peak in the demodulation regime, which denotes an effective gain in detection sensitivity. Measurements were conducted in 10 mM Tris buffer with electrodes of 2-mm diameter.
Frequently authors specify the sensitivity in terms of minimal detectable target concentrations (cmin) (see ref. 35 for a comprehensive review), however, we note that cmin depends on the chemical affinity of the target–probe couple and does not necessarily reflect the intrinsic sensor characteristics. In the present work, cmin was determined to be <10 pM, which represents a limit given by the intrinsic binding affinity of deoxyoligonucleotides.
Kinetic Analysis: Binding Rates.
Rapid data sampling with subsecond resolution is readily achievable and therefore even fast binding kinetics may be captured with the DNA switching technique. Fig. 2C shows the hybridization of unlabeled 24- and 48-nt targets to probe layers of their complementary sequences. High target concentrations (1 μM) were used to observe fast binding. The data were analyzed in terms of the diffusion-limited Langmuir adsorption model, assuming that the switching amplitude ΔF is proportional to the number of adsorbed targets Γ(t): ΔF(t) ∝ Γ(t) ≈ Γ∞[1 − exp{−(t/τ)0.5}]. Here, Γ∞ is the target coverage after infinite adsorption time, τ is the diffusion-limited adsorption (hybridization) time constant, and t is the time. As expected from diffusion arguments, a shorter hybridization time constant was found for the shorter oligo (τ24 = 19.0 s, τ48 = 26.5 s). In fact, the observed hybridization kinetics are remarkably rapid compared with other studies conducted under similar conditions (34), but differing in probe layers of higher density (>1012 cm−2). Previously, experimental (34) and theoretical (36) investigations have shown that low probe densities facilitate swift hybridization, thus we attribute the observed rapid kinetics to the extremely low probe densities used.
In reference measurements we tested whether the electrical switching procedure affects the hybridization reaction. We did not find indications that the binding kinetic or efficiencies were altered by the electrical modulation [see supporting information (SI) Fig. 7].
Quantitative Analysis: Binding Affinities.
The binding affinity of complementary nucleic acid sequences can be inferred from titration experiments, as shown in Fig. 3 for a 48-mer sequence. The concentration of targets in solution c is increased stepwise and, after giving the system time to establish an equilibrium between dissolved and surface-bound targets, the equilibrium switching amplitude ΔF∞ is evaluated as a measure for the number of hybridized probes on the surface Γ∞(c). We analyze the data by means of a basic Langmuir adsorption isotherm ΔF∝(c) ∝ Γ∞(c) ∝ cKA/(1 + cKA), and extract the affinity constant (dissociation constant) KA (=KD−1) = kon/koff by numerical fitting procedures (kon, koff being the reaction rate constants). The obtained result, KA = 5.3 × 10⁹ M−1 (KD = 0.19 nM), agrees very well with values reported in literature, for instance by Knoll and coworkers (37) who used 15-mer nucleotides.
Fig. 3.

Binding affinity measurement using the switching method. A 48-nt probe DNA layer is exposed to solutions containing varying concentrations of complementary target sequences, c. The density of bound target-probe duplexes in equilibrium is assessed by electrically modulating the DNA layer conformation (E = −0.1 V ± 0.2 V vs. Pt, fsquare-wave = 0.2 Hz) and monitoring the attained switching amplitude, ΔF∞ (for t → ∞ after adjusting a new concentration). Owing to the improved switching efficiency of DNA duplexes, ΔF∞ increases as targets hybridize with the single-stranded probes on the surface. The solid line represents a numerical fit using a 1:1 Langmuir adsorption model (ΔF∞ for c → 0 was fixed at ΔF∞ssDNA).
DNA Melting and Sequence Specificity: SNPs Detection.
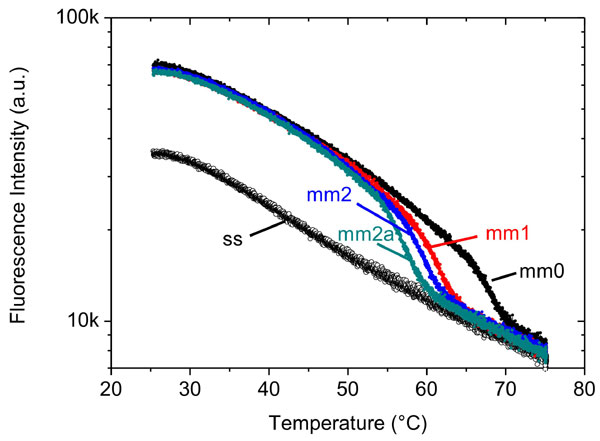
An important field of application for DNA sensors is the detection of point mutations in the genetic make-up of an individual, in particular for the identification of SNPs. We tested the DNA-switching method in that respect by using a random 24-mer sequence and recorded the thermal denaturation (melting) of target–probe duplexes that were either fully complementary, or contained one or two mismatches, respectively. Fig. 4 reveals two essential results: first, by monitoring the switching behavior of DNA layers, melting curves may readily be obtained. Second, sequence variations can be detected with single base-pair mismatch sensitivity.
Fig. 4.

Duplex melting measured by the switching method. A 24-nt single-stranded probe layer is repeatedly hybridized and subsequently dehybridized with fully complementary (mm0) and partly mismatched target sequences (mm1, mm2, mm2a); mismatches are marked as bold, underlined characters in the sequences. After hybridization at low temperature (target concentration = 1 μM), the layer is heated at a rate of 2°C/min while continuously switching the DNA conformation electrically (E = 0.1 V ± 0.2 V vs. Ag/AgCl, f = 0.2 Hz) and monitoring the switching amplitude, i.e., the fluorescence modulation.
The DNA layers exhibited a remarkable stability and showed almost no signs of degradation even after >10 consecutive temperature cycles, during which the probe layer was hybridized with targets at 25°C and then dehybridized by ramping the temperature up to 75°C. Generally, we observe a gradual decrease of the fluorescence intensity (and modulation amplitude) with increasing temperature, which is related to the temperature dependence of the dye's fluorescence quantum yield. After cooling to 25°C, however, the initial fluorescence intensities and switching amplitudes were fully recovered.
The switching amplitude declines markedly in the high-temperature regime, which we attribute to the denaturation of DNA duplexes. Clearly distinct melting curves are obtained for the various target probe duplexes, which allows us to discern whether a fully complementary target or targets with a single, two spatially separated, or two adjacent mismatches had bound to the probe DNA. We estimate the duplex melting temperature (Tm) by evaluating the midpoint of the steep transition:
 |
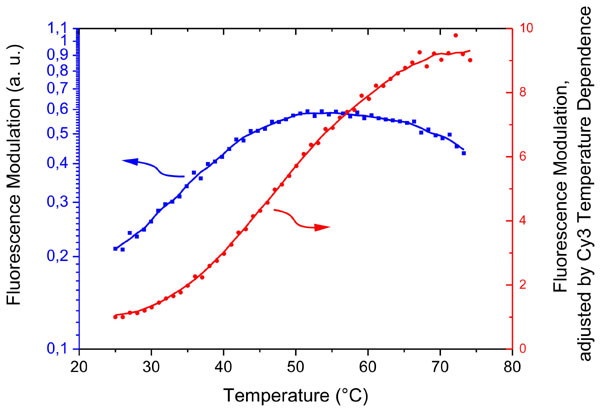
Values in parentheses denote Tms determined from measurements where targets and probes were dissolved in solution, showing satisfying agreement with Tm values determined with the switching technique and surface-attached probes. We note, however, that a sound analysis of Tm from switching data should account for the temperature dependences of the fluorophore emission and the DNA switching behavior [please refer to SI Text for additional data and discussion including the photophysical properties of the used Cy3 dye and linker (SI Figs. 8–10 and SI Table 1), determination of Tm in bulk solution (SI Figs. 11 and 12), the temperature dependencies of fluorescence from Cy3 linked to ssDNA and dsDNA, and switching data of ssDNA) (SI Fig. 13)]. In addition to GC mismatches, we also tested AT mismatches (in 24- and 18-bp sequences); perfect complements could always clearly be discriminated from targets containing single and double mismatches.
Frequency Response and Molecular Dynamics.
Recording the frequency dispersion of the electrically induced switching process gives information about the molecular dynamics of the nucleic acids on the surface. Fig. 5 depicts the switching amplitude versus the frequency of the applied sine-wave voltage. Three distinct regimes can be identified: For low frequencies (<200 Hz), the switching amplitude is constant and maximal; the nucleic acids oscillate synchronously with the AC field. For high frequencies (>5 kHz), the modulation is negligible; the DNA motion does not follow the electrical excitation. In an intermediate frequency regime, the modulation amplitude decays and the DNA motion starts lagging behind the electrical excitation. This demodulation regime reflects the finite, characteristic time constants of the switching process.
Two processes govern the DNA's frequency response. First, the interface charging time coarsely defines the spectral region of the demodulation, because the DNA motion is strongly correlated (18, 19) to the formation of the electrochemical double layer (29) at the metal/solution interface. In fact, it is the strong electric field (of the order of 100 kV/cm) generated by the double layer that aligns the DNA molecules. Without this field enhancement, Brownian motion dominates and fluctuations randomize the DNA layer conformation (20). The double-layer charging time depends on the solution resistance and the electrode capacitance (τ = RC); thus, the double-layer charging time, and, concomitantly the demodulation regime in the DNA-switching frequency response, vary when changing the solution salinity or the electrode size (note that the transition regimes in Figs. 5 and 6 are shifted by roughly one order of magnitude, which results from the fact that the measurements depicted in Fig. 5 were carried out in 10 mM monovalent salt solution using electrodes of 2-mm diameter, whereas the data depicted in Fig. 6 was recorded in 60 mM salt solution with 0.5-mm electrodes).
Fig. 6.

Layer height frequency dispersion. Sampled at low frequency (1 Hz), the measured fluorescence intensity corresponds to the time-averaged height of a 48-mer DNA layer. As the applied ac voltages (E = −0.15 V ± 0.25 Vrms vs. Pt) are swept from low to high frequencies the double-stranded (ds) molecules preferentially adopt upright orientations, whereas the single strands (ss) tend to lie down on the surface. The splitting originates from the reversed switching time constants in the upward and downward motions of ssDNA and dsDNA, respectively. Measurements were conducted in 10 mM Tris buffer containing 50 mM NaCl with electrodes of 0.5-mm diameter.
The second and more interesting influence to the DNA-switching demodulation is linked to the intrinsic molecular properties of the nucleic acids. A key result, which is evident from Fig. 5, is that dsDNA responds to higher driving frequencies than ssDNA. Hence, it is possible to discriminate target-probes helices from single-stranded probes according to their switching dynamics. Fig. 5 also validates an intuitive expectation concerning the influence of the molecule length: short 24-mer nucleotides can be switched faster than long 48 mers.
We analyzed the frequency spectra by using a two-state model, assuming that the time-dependent population of the upper/lower level may be represented by exponential functions ai·exp(−t/τi) (i = 1, 2). Here, two individual time constants τi are used to consider potentially distinct upward and downward motions. We adapted expressions from Lakowicz (ref. 38 and references therein) to calculate the frequency-dependent fluorescence modulation ΔF:
 |
To account for the upward and downward motions the amplitudes ai were set to −1 and +1, respectively. The model reproduces the experimental data very well. In accordance with the frequency shifts observed for different nucleotides, the model yields larger transition time constants for single than for double strands and larger values for long (48 mer) than for short (24 mer) nucleic acids (compare Fig. 5).
The analysis reveals another essential result, namely, it predicts dissimilar time constants for the upward and downward motions (because of its mathematical symmetry, however, the model does not allow to assign the individual time constants to the upward or downward transitions). Based on this finding, we devised a detection scheme that allows us to determine the binding state of a DNA layer without the necessity to compare data “before” and “after” binding.
Fig. 6 shows a frequency resolved measurement, where the absolute fluorescence was sampled at a slow rate (1 Hz) compared with the frequency of the DNA oscillation (>100 Hz). In this case, the measured intensity represents the average layer height. As the driving frequency is increased, we observe opposite trends before and after the hybridization. The average dsDNA layer height increases substantially, whereas the average ssDNA layer height decreases slightly.
These changes of the average layer height are a direct consequence of the dissimilar upward and downward transition times. As the frequency is increased, the oscillation period will at one point (i.e., the onset of the transition regime, f > 4 kHz in Fig. 6) become so short that the DNA molecules are not driven efficiently by the slow transition anymore. The system's response to the external excitation is then dominated by the fast transition, and the DNA layer must preferentially adopt the final state, which is reached more rapidly. Hence, it can be concluded from Fig. 6 that the dsDNA layer takes less time to stand up than to lie down, because the average layer height increases at high frequencies. On the opposite, the average ssDNA layer height slightly decreases, indicating that ssDNA needs more time to rise, but less time to fold onto the surface. Recent computer simulations and time-resolved experiments suggest that this behavior results from the combination of short-ranged electric fields and the distinctly different mechanical flexibilities of the molecules (19, 39).
Conclusions
Electrically switchable DNA layers qualify for the label-free, real-time detection of nucleic acid sequences with high sensitivity. Multiple parameters of the switching process can be monitored and provide complementary information for the characterization of binding events.
The analysis of binding kinetics, binding affinities, and sequence specificity with single-mismatch sensitivity have been demonstrated from switching data. Driving the oscillation by high frequencies probes the molecular dynamics of oligonucleotides on surfaces, which is unprecedented in the field of chip-based biosensors. Distinct binding states can be discerned according to the dissimilar switching kinetics of ssDNA and dsDNA, which cause shifts in the frequency dispersion of the switching amplitude. In addition, asymmetries in the upward and downward motion of ssDNA or dsDNA, respectively, allow us to identify the molecules by their intrinsic properties, without the necessity to compare data before and after binding.
The applicability of the method is not only limited to DNA–DNA interactions, but includes DNA–RNA and PNA–DNA binding as well. In particular, it can be extended to the detection of proteins by modifying the DNA with affinity labels for protein targets.
Materials and Methods
Electrically switchable DNA layers were prepared as follows. Gold work electrodes of varying diameters (0.1–2 mm) were deposited on insulating substrates (sapphire or SiOx/Si wafers) by using standard metallization techniques (20). DNA was obtained from IBA (Göttingen, Germany) and the sequences of the 24 and 48 nt were 5′-HS-(CH2)6–TAG TCG TAA GCT GAT ATG GCT GAT–Cy3–3′ and 5′-HS-(CH2)6–TAG TCG TAA GCT GAT ATG GCT GAT TAG TCG GAA GCA TCG AAC GCT GAT–Cy3–3′. These DNA sequences are nonself-complementary; complicating secondary structures are not known. One end was modified with a thiol linker to chemically graft the molecules to gold surfaces (S-Au bond), and the other end was labeled with a fluorescence marker (Cy3) for optical detection. Before DNA adsorption, the electrodes were cleaned in Piranha solution [H2SO4/H2O2 (30%) = 7:3] and exposed to HNO3 (60%) for 15 min each, followed by a final rinse with deionized water. The preparation of the DNA film proceeded in three steps. First, a relatively dense layer of thiol-modified oligonucleotides was formed on the gold surface by self-assembly from solution (immobilization buffer: 10 mM Tris, pH 7.3/50 mM NaCl/10 μM DNA), followed by the coadsorption of short spacer molecules (mercaptohexanol, 1 mM) to improve the DNA layer structure and passivate the remaining gold surface (25, 33). Eventually, a series of negative potential cycles (typically −0.7 to −0.8 V vs. Ag/AgCl for 1 min) was repeatedly applied to the gold electrodes, which triggered the release of DNA from the surface (40). This electrical desorption step proved extremely useful to reduce the molecule surface density in situ in a controlled and reproducible way. Keeping the nucleotide density on the surface low (<1011 cm−2) is a prerequisite to realize switchable DNA layers, because the conformation of densely packed layers cannot be modulated efficiently because of steric hindrance (collisions) between adjacent molecules within the layer (18, 26). Alternately, we reduced the surface density and checked the “switchability” of the layer by monitoring the relative switching amplitude ΔF/F. The procedure was stopped once a saturated, maximal switching amplitude had been attained. Quantitative measurements of the DNA surface density were performed by using an electrochemical technique described by Steel et al. (32). By assessing the minimally detectable current signals from the used Redox marker (Rutheniumhexaamine) against the observed statistical variations, we estimate that the method's detection limit is ≈5 × 1010 cm−2.
We note that the presence of DTT residues in the purchased DNA samples cannot be excluded (41), but, because of the coadsorption of mercaptohexanol and the low DNA density, it is not expected to affect the results of this work.
Electro-optical measurements were conducted in fluidic cells containing buffered electrolyte solution (10 mM Tris, pH 7.3/50 mM NaCl). AC potentials were applied to the gold electrodes by using a three-electrode setup (using a Ag/AgCl electrode as reference and a Pt wire as counter electrode) and a two-electrode setup, where a Pt electrode was integrated “on-chip” together with the Au work electrode. Both setups worked equally well. Low ac amplitudes of typically 200–300 mV were adequate to efficiently modulate the DNA conformation, while electrochemical currents across the gold-DNA/mercaptohexanol-solution interface were negligible, that is, the interface behaved as an ideally polarizable electrode and unwanted degradation was not observed. A cooled photomultiplier (PMT), operated in single-photon counting mode, was used for the optical detection at low frequencies. To analyze the frequency response, the PMT output current was measured with a lock-in amplifier.
Tm measurements were performed by heating the substrate backside with a 200-W Peltier element, controlled via a feedback loop. The sample temperature was measured directly underneath the electrodes with a Pt100 sensor.
Supplementary Material
Acknowledgments
We thank Mikala Grubb, Christine Hautmann, Michihiko Aki, and Ade Ziegltrum for their help. This work was supported by Fujitsu Laboratories and Deutsche Forschungsgemeinschaft Grant SFB 563.
Abbreviation
- Tm
melting temperature.
Footnotes
The authors declare no conflict of interest.
This article is a PNAS Direct Submission.
This article contains supporting information online at www.pnas.org/cgi/content/full/0703974104/DC1.
References
- 1.Csako G. Clin Chim Acta. 2006;363:6–31. doi: 10.1016/j.cccn.2005.07.009. [DOI] [PubMed] [Google Scholar]
- 2.Tsongalis GJ, Coleman WB. Clin Chim Acta. 2006;363:127–137. doi: 10.1016/j.cccn.2005.05.043. [DOI] [PubMed] [Google Scholar]
- 3.Heller MJ. Annu Rev Biomed Eng. 2002;4:129–153. doi: 10.1146/annurev.bioeng.4.020702.153438. [DOI] [PubMed] [Google Scholar]
- 4.Epstein JR, Biran I, Walt DR. Anal Chim Acta. 2002;469:3–36. [Google Scholar]
- 5.Tan PK, Downey TD, Spitznagel EL, Xu P, Fu D, Dimitrov DS, Lempicki RA, Raaka BM, Cam MC. Nucleic Acids Res. 2003;31:5676–5684. doi: 10.1093/nar/gkg763. [DOI] [PMC free article] [PubMed] [Google Scholar]
- 6.Yu F, Yao D, Knoll W. Nucleic Acids Res. 2004;32:e75. doi: 10.1093/nar/gnh067. [DOI] [PMC free article] [PubMed] [Google Scholar]
- 7.Georgiadis R, Peterlinz KP, Peterson AW. J Am Chem Soc. 2000;122:3166–3173. [Google Scholar]
- 8.Drummond TG, Hill MG, Barton JK. Nat Biotechnol. 2003;21:1192–1199. doi: 10.1038/nbt873. [DOI] [PubMed] [Google Scholar]
- 9.Fan C, Plaxco KW, Heeger AJ. Proc Natl Acad Sci USA. 2003;100:9134–9137. doi: 10.1073/pnas.1633515100. [DOI] [PMC free article] [PubMed] [Google Scholar]
- 10.Marx KA. Bio Macromolecules. 2002;4:1099–1120. [Google Scholar]
- 11.Hihath J, Xu BQ, Zhang PM, Tao NJ. Proc Natl Acad Sci USA. 2005;102:16979–16983. doi: 10.1073/pnas.0505175102. [DOI] [PMC free article] [PubMed] [Google Scholar]
- 12.Uslu F, Ingebrandt S, Mayer D, Böcker-Meffert S, Odenthal M, Offenhäusser A. Biosens Bioelectron. 2004;19:1723–1731. doi: 10.1016/j.bios.2004.01.019. [DOI] [PubMed] [Google Scholar]
- 13.Fritz J, Cooper EB, Gaudet S, Sorger PK, Manalis SR. Proc Natl Acad Sci USA. 2002;99:14142–14146. doi: 10.1073/pnas.232276699. [DOI] [PMC free article] [PubMed] [Google Scholar]
- 14.Edman CF, Raymond DE, Wu DJ, Tu E, Sosnowski RG, Butler WF, Nerenberg M, Heller MJ. Nucleic Acids Res. 1997;25:4907–4914. doi: 10.1093/nar/25.24.4907. [DOI] [PMC free article] [PubMed] [Google Scholar]
- 15.Su H-J, Surrey S, McKenzie SE, Fortina P, Graves DJ. Electrophoresis. 2002;23:1551–1557. doi: 10.1002/1522-2683(200205)23:10<1551::AID-ELPS1551>3.0.CO;2-9. [DOI] [PubMed] [Google Scholar]
- 16.Sosnowski RG, Tu E, Butler WF, O'Connell JP, Heller MJ. Proc Natl Acad Sci USA. 1997;94:1119–1123. doi: 10.1073/pnas.94.4.1119. [DOI] [PMC free article] [PubMed] [Google Scholar]
- 17.Cheng J, Sheldon EL, Wu L, Uribe A, Gerrue LO, Carrino J, Heller MJ, O'Connell JP. Nat Biotechnol. 1998;16:541–546. doi: 10.1038/nbt0698-541. [DOI] [PubMed] [Google Scholar]
- 18.Rant U, Arinaga K, Fujita S, Yokoyama N, Abstreiter G, Tornow M. Nano Lett. 2004;4:2441–2445. doi: 10.1021/nl8026789. [DOI] [PubMed] [Google Scholar]
- 19.Rant U, Arinaga K, Tornow M, Kim YW, Netz RR, Fujita S, Yokoyama N, Abstreiter G. Biophys J. 2006;90:3666–3671. doi: 10.1529/biophysj.105.078857. [DOI] [PMC free article] [PubMed] [Google Scholar]
- 20.Rant U, Arinaga K, Fujita S, Yokoyama N, Abstreiter G, Tornow M. Org Biomol Chem. 2006;4:3448–3455. doi: 10.1039/b605712h. [DOI] [PubMed] [Google Scholar]
- 21.Drexhage KH. Prog Optics. 1974;12:165. [Google Scholar]
- 22.Chance RR, Prock A, Silbey R. Adv Chem Phys. 1978;37:1–65. [Google Scholar]
- 23.Barnes WL. J Mod Opt. 1998;45:661–699. [Google Scholar]
- 24.Lee C-Y, Gong P, Harbers GM, Grainger DW, Castner DG, Gamble LJ. Anal Chem. 2006;78:3316–3325. doi: 10.1021/ac052137j. [DOI] [PubMed] [Google Scholar]
- 25.Arinaga K, Rant U, Tornow M, Fujita S, Abstreiter G, Yokoyama N. Langmuir. 2006;22:5560–5562. doi: 10.1021/la060324m. [DOI] [PubMed] [Google Scholar]
- 26.Rant U, Arinaga K, Fujita S, Yokoyama N, Abstreiter G, Tornow M. Langmuir. 2004;20:10086–10092. doi: 10.1021/la0492963. [DOI] [PubMed] [Google Scholar]
- 27.Du H, Disney MD, Miller BL, Krauss TD. J Am Chem Soc. 2003;125:4012–4013. doi: 10.1021/ja0290781. [DOI] [PubMed] [Google Scholar]
- 28.Moiseev L, Ünlü MS, Swan AK, Goldberg BB, Cantor CR. Proc Natl Acad Sci USA. 2006;103:2623–2628. doi: 10.1073/pnas.0511214103. [DOI] [PMC free article] [PubMed] [Google Scholar]
- 29.Bard AJ, Faulkner LR. Electrochemical Methods. New York: Wiley; 2000. [Google Scholar]
- 30.Tinland B, Pluen A, Sturm J, Weill G. Macromolecules. 1997;30:5763–5765. [Google Scholar]
- 31.Smith SB, Finzi L, Bustamante C. Science. 1992;258:1122–1126. doi: 10.1126/science.1439819. [DOI] [PubMed] [Google Scholar]
- 32.Steel AB, Herne TM, Tarlov MJ. Anal Chem. 1998;70:4670–4677. doi: 10.1021/ac980037q. [DOI] [PubMed] [Google Scholar]
- 33.Herne TM, Tarlov MJ. J Am Chem Soc. 1997;119:8916–8920. [Google Scholar]
- 34.Peterson AW, Heaton RJ, Georgiadis RM. Nucleic Acids Res. 2001;29:5163–5168. doi: 10.1093/nar/29.24.5163. [DOI] [PMC free article] [PubMed] [Google Scholar]
- 35.Rosi NL, Mirkin CA. Chem Rev. 2005;105:1547–1562. doi: 10.1021/cr030067f. [DOI] [PubMed] [Google Scholar]
- 36.Hagan MF, Chakraborty AK. J Chem Phys. 2004;120:4958–4968. doi: 10.1063/1.1645786. [DOI] [PubMed] [Google Scholar]
- 37.Liebermann T, Knoll W, Sluka P, Herrmann R. Colloids Surf A. 2000;169:337–350. [Google Scholar]
- 38.Lakowicz JR. Principles of Fluorescence Spectroscopy. New York: Kluwer/Plenum; 1999. [Google Scholar]
- 39.Sendner C, Kim YW, Rant U, Arinaga K, Tornow M, Netz RR. Phys Stat Sol (a) 2006;203:3476–3491. [Google Scholar]
- 40.Arinaga K, Rant U, Knezevic J, Pringsheim E, Tornow M, Fujita S, Abstreiter G, Yokoyama N. Biosens Bioelectron. 2007 doi: 10.1016/j.bios.2007.04.012. [DOI] [PubMed] [Google Scholar]
- 41.Lee C-Y, Canavan HE, Gamble LJ, Castner DG. Langmuir. 2005;21:5134–5141. doi: 10.1021/la0472302. [DOI] [PubMed] [Google Scholar]
Associated Data
This section collects any data citations, data availability statements, or supplementary materials included in this article.