

Abstract
Molecular dynamics (MD) simulations of dipalmitoylphosphatidylcholine (DPPC) bilayers composed of 72 and 288 lipids are used to examine system size dependence on dynamical properties associated with the particle-mesh Ewald (PME) treatment of electrostatic interactions. The lateral diffusion constant, Dℓ, is 2.92×10⁻⁷ and 0.95×10⁻⁷ cm2/s for 72 and 288 lipids, respectively. This dramatic finite size effect originates from the correlation length of lipid diffusion, which extends to next-nearest neighbors in the 288 lipid system. Consequently, diffusional events in smaller systems can propagate across the boundaries of the periodic box. The internal dynamics of lipids calculated from the PME simulations are independent of the system size. Specifically, reorientational correlation functions for the slowly relaxing phosphorous-glycerol hydrogen, phosphorous-nitrogen vectors, and more rapidly relaxing CH vectors in the aliphatic chains are equivalent for the 72 and 288 lipid simulations. A third MD simulation of a bilayer with 72 lipids using spherical force-shift electrostatic cutoffs resulted in interdigitated chains, thereby rendering this cutoff method inappropriate.
I. Introduction
Molecular dynamics (MD) simulations are limited in length and system size by computational resources. Calculated properties from MD simulations can depend on system size, and some vary more than others. The dependence of system size for lipid bilayers has been studied for equilibrium properties, including surface area per lipid,1 surface tension,2 electron density, and deuterium order parameters.3 Systematic studies of system size dependence of dynamical properties are more limited. de Vries et al.3 demonstrated that the correlation functions for several carbons on the sn-1 chain of dipalmitoylphosphatidylcholine (DPPC) are converged for a system size of 16 lipids per leaflet, but their 20ns simulations were not sufficiently long to satisfactorily compare correlation functions for the head group phosphorous-nitrogen (P-N) vector. Self diffusivities in homogeneous bulk systems have recently been shown to have a strong system size dependence.4,5 Lateral diffusion constants of lipids in bilayers have been evaluated at different system sizes by other groups (e.g., refs 6-8), but variations in cutoff methods and force fields confound comparisons.
Closely related to system size is the treatment of long-range electrostatics. Ewald or particle-mesh Ewald (PME)9 methods are widely used to treat long-range electrostatics in lipid bilayer simulations.8,10 Simple truncation of electrostatics results in artificial maxima and minima in radial distribution functions at the cutoff distance.10 Moreover, relaxation times from electrostatic truncation of the P-N vector and carbon vectors on the sn-1 chains differ dramatically8 from PME, and the lateral diffusion constant of DPPC converges slowly to the PME value with an increase in the electrostatic cutoff radius. However, Ewald methods may result in artifacts including long-range correlation11 and anisotropy12 from the artificially induced periodicity. Consequently, it is important to periodically revalidate the application of Ewald summation to bilayers.
This work focuses on dynamical quantities in PME simulations of lipid bilayers. Trajectories of DPPC bilayers containing 72 and 288 lipids are analyzed for system size dependence of the short- and long-time lateral diffusion constants, and the reorientational correlation functions of molecular vectors that probe internal and overall rotation. The 50ns trajectories (three replicates for the smaller system and one for the larger) are sufficient to obtain well converged results. Separately, a striking artifact from a 50ns simulation of the 72 lipid system with a force-shift spherical cutoff on the electrostatics is also reported.
By way of outline, the following section describes the simulation methodology, an assortment of methods pertaining to translational diffusion (determination of diffusion constants, jump model parameters, and the concertedness of translational jumps and their correlation lengths). Section III (Results and Discussion) is divided into two subsections. The first subsection compares lipid diffusion for the two system sizes used in this work and also to past simulations and experimental measurements. It then relates the enhanced DPPC diffusion calculated from the 72 lipid system to the lipid diffusion correlation length. The second subsection considers system size effects on bilayer structure and the reorientational dynamics of individual lipids. Section IV summarizes the work.
II. Methodology
A. Simulation details
The CHARMM program13 is used in the simulations with 36 lipids per leaflet (72 total). The NAMD program14 is employed for simulations with 144 lipids per leaflet (288 total) because of its efficient parallelization for large systems. The force fields used in the simulations are the revised CHARMM27 (C27r)4 for lipids and the modified TIP3P water model.15 The lipid bilayers are fully hydrated (30.4 waters per lipid) and contain 15,927 and 63,708 atoms for the 72 and 288 lipid systems, respectively. The initial coordinates for the system with 72 lipids were obtained using a similar procedure to that reported previously by Feller et al.,16 but with unrealistic lipid head group conformations removed and the head group dihedrals highly restrained during minimization. The large DPPC bilayer is a quadruple replicate of the 72 lipid system with the coordinates from 5.5ns of a previous production run.4 The initial atomic coordinates for the simulation with force-switching of electrostatics are obtained from the end of a 72 lipid Particle mesh Ewald9 production run (50ns).
Two sets of MD simulations with 72 DPPC molecules were run: (1) Particle mesh Ewald for electrostatic interactions beyond 10 Å (κ = 0.34 Å−1 and a fast-Fourier grid density of about 1 Å-1); and (2) Force-switching for electrostatic interactions over 8 to 10 Å.13 These systems are denoted 72 PME and 72 FSW, respectively. Three independent runs from previous simulations4 were extended to 50ns beyond 3ns of equilibration for 72 PME. A single 50ns trajectory was generated for 72 FSW, based on the 5.5ns time point of a previous simulation.4 The leapfrog Verlet algorithm was used with a time step of 1fs. These simulations were run in tetragonal periodic boundary conditions in the constant particle number, pressure, surface area, and temperature ensemble (NPAT). The cross-sectional area in these simulations was set to 64 Å2 per lipid17 and the temperature to 323.15 K. The equivalence of NPAT and NPγT ensembles for calculations of lateral displacements18 and area compressibility19 has been demonstrated, and implies that the results presented here should be independent of ensemble. Lennard-Jones (LJ) interactions were forced-shifted to zero between 8 to 10 Å. The pressure-based long-range correction20 to LJ interactions with a long-range cutoff of 30 Å was applied to 72 PME, while 72 FSW was simulated at a constant normal pressure of 1 atm to maintain consistency with the absence of long range electrostatic interactions in this system. All hydrogen atoms were constrained using the SHAKE algorithm.21 The extended system formalism was used to maintain the temperature via the Hoover thermostat22 with a thermostat coupling constant of 20,000 kcal mol−1 ps−2, and the normal pressure was maintained with a barostat23 with a piston mass of 2000 amu.
The system of 288 DPPC molecules was simulated with NAMD14 using similar algorithms to those described above, i.e., PME and a long-range correction in pressure. Currently, NAMD only supports temperature control with Langevin dynamics, temperature coupling, or temperature rescaling. To minimize the perturbation on the lipid bilayer by these methods, the temperature was rescaled every 10ps for the first 2ns in equilibration and then unscaled through the final 1ns of equilibration and during production. Consequently, the ensemble for this system is NPAH (H, constant enthalpy). There was a minimal temperature drift of less than 1.3 K for 50ns.
B. Translational diffusion
The system size dependence on the lateral diffusion of lipids is a main focus of this work. To obtain the lateral diffusion constant, Dℓ, the lateral mean-squared displacement of the lipid center of mass (COM) is calculated,
| (1) |
where i is the individual lipid and NL is the number of lipids. The long-time slope of the lateral mean squared displacement versus time equals 4Dℓ. A weighted least squared fit is used to obtain Dℓ with weights obtained from averages of 8 subgroups of molecules per trajectory. Patra et al.8 have suggested that the COM drift of the each leaflet should be removed from the individual lipid motion when calculating the diffusion constant. While this method can be useful for removing artifacts in some simulations, it also removes realistic displacements of lipid (the COM of the entire system must be constrained to remain fixed, but not the individual components). Diffusion constants with and without the monolayer COM displacement removed are calculated in order to evaluate the system size dependence of the removal.
The short-time diffusion constant, , which reflects translational motions of the subnanosecond time scale,24,25 is not straightforward to calculate, and Eq. 1 cannot be used because the mean-squared displacement is non-linear in this region. Here the instantaneous slope of the MSD at t=0 was calculated for from the forward numerical derivative from t=0 to 10 ps (the MSD was evaluated at 10ps intervals).
The diffusion constant for a lipid in a bilayer is defined in a jump model as follows,
| (2) |
where λ is the average number of jumps per unit time and d is the average distance between jump sites. Parameters λ and d were developed with the ART-2′ nonhierarchical clustering algorithm based on a self-organizing neural net.26 In this algorithm, a conformation, j, is described by a vector of N parameters, xj, where the vector of interest is simply the center of mass of a lipid. Each cluster k, Ck, is characterized by a cluster center, ck, that is the average conformation of its M members,
| (3). |
The coordinates are clustered based on the criteria that all conformations must be within a specified cutoff radius, rc, from the cluster center based on the Euclidean distance,
| (4). |
The ART-2′ algorithm compares xj to ck using Eq. 3 to determine if a conformation is in Ck if the distance is less than rc. Otherwise the conformation seeds a new cluster and the cluster centers are recalculated for each new member of Ck. The assignment of clusters is repeated until the cluster membership remains the same (within a tolerance of 0.001) between sequential iterations. Based on visual inspection, rc = 7Å provided the best discrimination of clusters. Because the clusters were developed from trajectories, the times, total number of transitions and thereby λ can be trivially calculated from the number of elements in each cluster. The cluster centers represent the location of jump sites, allowing evaluation of d.
The extend of concertedness (or correlation) in diffusion was evaluated using the analysis of Brown et al.27 This method was originally developed to quantify concertedness in torsional transitions of the acyl chains of lipids, but is straightforward to extend to diffusion once the jump times are specified. Each time a lipid jumps, the neighboring lipids are surveyed to determine if they also jumped in a time window of 100ps (the approximate time it takes for a lipid to transverse between cages as estimated from the cluster analysis). Such transitions are denoted followers, and the number of followers is Nf . Windows of 50, 200, and 500ps were also evaluated to assess the robustness of the approach. Conceptually, Nf can be divided into the number of independent followers (those which would occur by chance in the absence of physical correlation), Nif , and concerted followers Ncf (those associated with correlation); i.e.,
| (5). |
An individual follower transition cannot be determined as independent or concerted. Nevertheless, assuming independent Poisson statistics, Nif can be estimated as,
| (6) |
where λw is probability that an individual lipid will jump in the specified window size, N is the total number of jumps, and ns is the number of lipids of the shell under consideration. N-1 enters into Eq. 6 because one of the N transitions has already taken place. λw was calculated here directly from the total number of jumps and lipids in each trajectory, and window size.
A measure of concertedness is then given by the probability π
| (7) |
where Ncf is obtained from Eqs. 5 and 6. When jumps are independent, π = 0; a value substantially larger than 0 implies that the jumps are concerted. Values of π were calculated for follower transitions in the nearest neighbor or first shell (r < 8Å), second shell (8Å ≤ r < 16Å) and third shell (16Å ≤ r < 24Å) of the leader. Correlation between leaflets was not evaluated.
A related measure of concertedness involves testing the null hypothesis: Nf could have arisen if the transitions were independent and described by a Poisson distribution with mean λ = Nif . The probability of incorrectly rejecting the null hypothesis is given by the p-value defined from the conditional probability of the Poisson distribution:
| (8) |
A small value of p, typically < 0.05 or 0.1, is commonly used as a cutoff for rejecting the null hypothesis. If p is below the cutoff, then there is good evidence of concerted behavior.
III. Results and Discussion
A. Translational Diffusion
The uncorrected MSD versus time from 0 to 100ps is non-linear (Fig. 1, bottom) with a higher slope compared to the linear behavior at t > 1ns (Fig. 1, top). This is consistent with the fast diffusion region over short distances and times observed in incoherent quasielastic neutron scattering (QENS).24,28 This motion reflects rapid fluctuations of the lipids as they “rattle in a cage” of their nearest neighbors,24 and is described by the short-time diffusion constant . It is distinct from long-time lateral diffusion, which entails hopping between cages and is described by Dℓ.
Figure 1.

The lateral mean squared displacement of the lipids, 〈l(t)−l(0)〉2, for 72 PME (an average of three independent simulations) and one 288 PME simulation for all 50ns (top) and for the interval 0-100ps (bottom). Standard errors are denoted with vertical bars.
Table 1 lists the values of from the MD simulations. Results for both the PME simulations are in quite good agreement with experiment and with the simulated values of Lindahl and Edholm7 and Patra et al.8 The long-time diffusion constants are an order of magnitude smaller than . These will be considered in detail for the PME systems after a brief discussion of the results from the force-shift simulation.
Table 1.
Lateral diffusion constants for DPPC: short-time cage diffusion, evaluated from the slope of the mean squared displacement (Eq. 1) between 0 and 10 ps; long-time lateral diffusion constant Dℓ, evaluated over the range 1-50 ns; lateral diffusion with the monolayer COM displacement removed ; and for a jump model, from Eq. 2. All diffusion constants have units of 10−7 cm2/s and, unless otherwise noted, are calculated at 323.15K.
Both and Dℓ for the 72 FSW are substantially smaller than those from the PME simulations (Fig. 1 and Table 1). The reason for this is clear from Fig. 2, which shows the final (50 ns) snapshot of each system. The PME bilayers (left and middle panels) are in the state of disorder expected for the liquid crystalline phase. In contrast, the aliphatic chains in the 72 FSW system are mostly fully extended and interdigitated (Fig. 2, right). The observed restricted translation would be expected for such a system. Nucleation of this configuration began at approximately 10ns, and condensation proceeded rapidly. It is a consequence of unbalanced electrostatic forces and the constant area constraint. Had the system been simulated at constant surface tension, the area would have most likely rapidly decreased thereby preserving a bilayer structure, albeit a highly ordered one. Previous NPT simulations with a larger electrostatic cutoff (twin range of 10/18 Å) result in a DPPC liquid crystalline bilayer29 also point to the short electrostatic cutoff as the underlying cause for the observed interdigitation. The present structure is similar to the minor domain (m) of the DPPC ripple phase as determined from experiment by Nagle and co-workers30 and later supported via simulation by de Vries et al.31 However, it is an unphysical artifact under the present conditions (the ripple phase for DPPC is stable between of 308 to 315K32), and further analysis is not included.
Figure 2.

(color online) Final snapshot of one 72 PME (left), 288 PME (middle), and 72 FSW (right) simulation. The ends of the aliphatic chains are shown in large yellow spheres.
Turning to the long-time translational diffusion of the 288 lipid PME system, Dℓ =0.95×10⁻⁷ cm2/s. This is reasonably close to results from fluorescence recovery25 and magic angle scattering NMR experiments33 (Table 1). It is also close to the diffusion constants evaluated from two GROMACS-based simulations: 1.2×10⁻⁷ cm2/s by Lindahl and Edholm7 (with twin range spherical cutoffs, 64 lipids), and 1.3×10⁻⁷ cm2/s by Patra et al.8 (with PME, 128 lipids). The latter authors also showed an over ten-fold dependence of Dℓ on the spherical cutoff value for the 128 lipid system, but did not examine other system sizes.
In contrast to , long-time lateral diffusion depends on the system size, i.e., Dℓ = 2.9×10⁻⁷ cm2/s for 72 PME, over three times larger than 288 PME. An analysis of this substantial finite size effect begins with the COM trajectories of individual lipids. Figure 3 shows one such trajectory from a 72 PME system. Fluctuations of the COM in relatively localized regions are punctuated by transitions to other regions, in what appears to be a combination of rattling in a cage and jumping between cages. The cluster analysis described in the Methods yields the 5 clusters for this lipid (depicted as circles in Fig. 3). The average distance between clusters, d, for all lipids is 9.05 and 8.23 Å for 72 PME and 288 PME, respectively. Given that the surface area per lipid is 64 Å2, these values of d and the general features of Fig. 3 suggest that a jump model is suitable for the present analysis.
Figure 3.
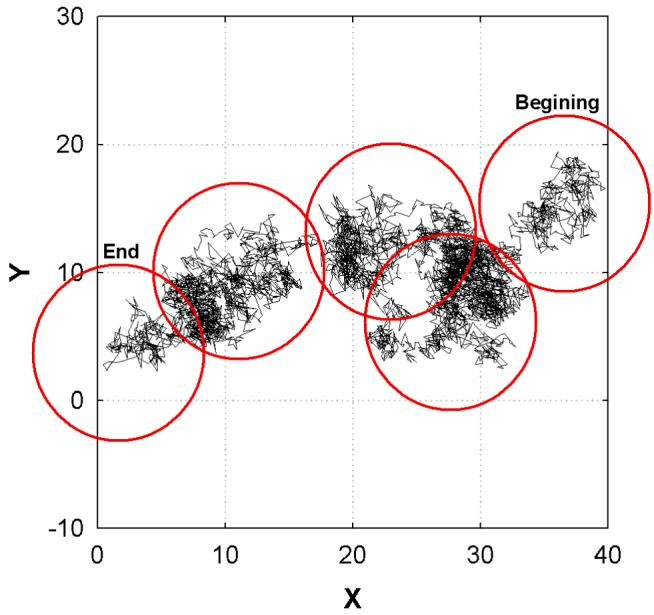
(color online) The lateral trace (in 10ps intervals) of the center of mass (COM) of a lipid in one 72 PME simulation, with the five clusters with radius of 7 Å.
Figure 4 plots the jump times for one of the 72 PME systems (top) and 288 PME (bottom). The 72 PME system contains periods of relative quiet and bursts of highly correlated transitions; some sets of transitions appear to be coupled between leaflets. The 288 PME system does not exhibit such obvious trends, though some degree of correlated motion cannot be ruled out. Diffusion constants estimated from the jump model, , show a substantial system size effect (Table 1). also differs significantly from Dℓ for 72 PME, implying that the jump rate in this system is not well described by an independent Poisson distribution. is slightly lower than Dℓ for 288 PME, but the difference is not statistically significant.
Figure 4.
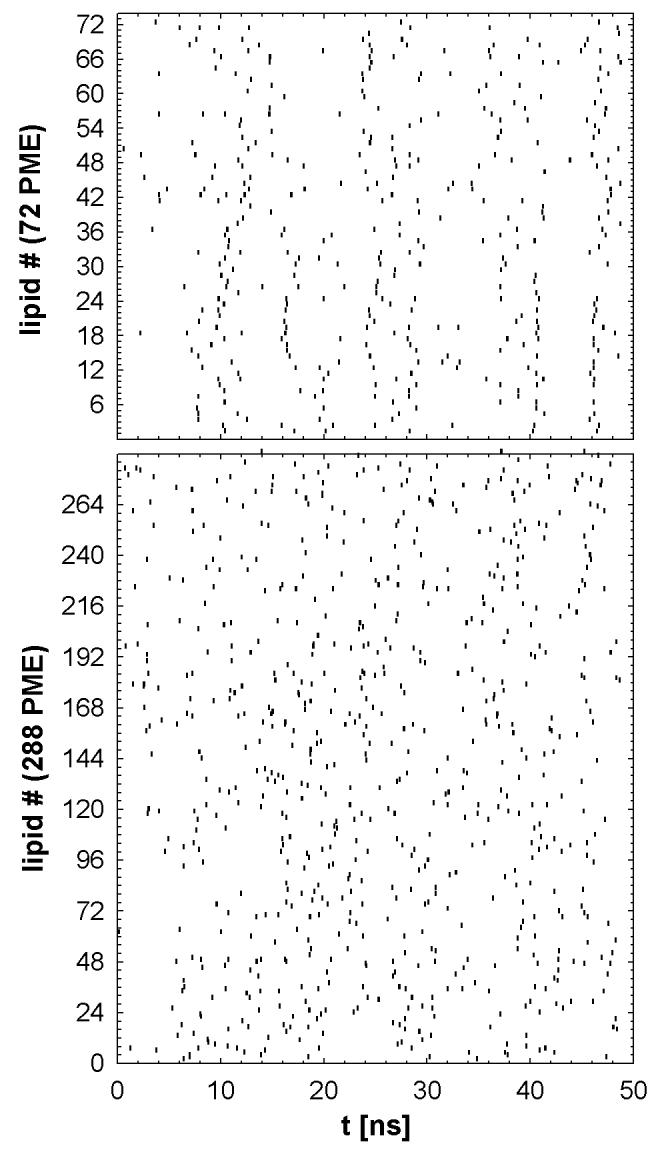
Jump times (defined by the clustering algorithm and denoted by vertical tick marks) of all of the lipids in 72 PME (top) and 288 PME (bottom).
Figure 5 compares the probability distribution, P(Nj), for number of lipid jumps (Nj) per leaflet in two ns intervals observed in the simulations and a Poisson distribution with the same mean. The average number of jumps per 2ns block, λ, is larger for 288 PME as expected from the system size. However, the increase in λ is only two-fold because the diffusion is slower than 72 PME. The probability distribution for 72 PME (top panel of Fig. 5) appears to be bimodal. This is consistent with the correlated bursts of activity shown in Fig. 4, and qualitatively different from a Poisson distribution. P(Nj) for the 288 PME is closer to a Poisson distribution than 72 PME (Fig. 5, bottom panel) although is somewhat broader, implying some correlation in lipid jumps even for this system.
Figure 5.

The average probability of the number of jumps in a 2ns block (λ) ignoring the first and last block for 72 PME (top) and 288 PME (bottom), and the Poisson distribution for these values of λ (solid lines in each panel).
Correlation, or concertedness, in the jumps was analyzed by the approach of Brown et al.27 described in the Section II-B. Table 2 lists the relevant statistics for the 100ps window size. The individual 72 PME systems show substantial evidence of concertedness in the first and second shells (p ≤ 0.1 in all three cases), and run1 even shows potential correlation to the third shell. Similar results were observed for the 50 and 200ps time windows, but no concertedness is evident for the 500ps time window. Pooling the 100ps time window results of the three simulations yields p ≈ 10−6 for the first and second shells, and p = 0.024 for the third shell. Hence, there is little doubt that concertedness extends to the second shell and it likely extends to the third shell for systems of 72 lipids.
Table 2.
Statistics for concerted motion: N, the number of diffusional jumps for each trajectory based on a cluster analysis; Nf, the number of jumps following another jump within 100ps; Nif, the number of jumps that would be expected from independent Poisson statistics (Eq. 6); π, the probability of a concerted jump (Eq. 7); and the p-value, which is the probability that Nif would have been observed if the jumps were independent (Eq. 8). Lipids were divided into the first shell (r < 8 Å), second shell (8 Å ≤ r < 16 Å) and third shell (16 Å ≤r < 24 Å), with ns the average number of lipids in each shell.
| Simulation | Shell | ns | Nf | Nif | π | p-value |
|---|---|---|---|---|---|---|
| 72 PME run1 | 1 | 5.9 | 41 | 23.8 | 0.045 | 0.0005 |
| (N=380) | 2 | 18.1 | 103 | 72.3 | 0.081 | 0.0003 |
| 3 | 31.3 | 147 | 125.3 | 0.057 | 0.026 | |
| 72 PME run2 | 1 | 5.5 | 36 | 19.4 | 0.047 | 0.0002 |
| (N=355) | 2 | 18.4 | 74 | 64.2 | 0.028 | 0.10 |
| 3 | 31.8 | 95 | 110.9 | 0.000 | 0.93 | |
| 72 PME run3 | 1 | 5.7 | 27 | 20.4 | 0.018 | 0.063 |
| (N=359) | 2 | 18.8 | 96 | 67.0 | 0.081 | 0.0003 |
| 3 | 30.9 | 117 | 110.3 | 0.019 | 0.24 | |
| 288 PME | 1 | 5.7 | 20 | 18.5 | 0.002 | 0.31 |
| (N= 683) | 2 | 18.4 | 80 | 59.5 | 0.030 | 0.005 |
| 3 | 31.6 | 84 | 102.3 | 0.000 | 0.96 |
Results for 288 PME are somewhat less clear, partly because of sample size. There is no strong evidence for concertedness with the first shell (p = 0.31), but correlation with the second shell is high (p = 0.005). Correlation with the third and fourth shells is negligible (data not shown). Similar results are obtained with the 50 and 200ps time windows; the 500ps window yields no correlation for any of the shells. It is not clear at this juncture whether the lack of correlation for the first shell arises from incomplete sampling, limitations in the jump model, or, more deeply, to the mechanism of lipid diffusion. Nevertheless, the presence of correlation with the second shell is the central result of the study. If diffusion exhibits a natural correlation with the second shell (a length of 16 Å), it becomes likely that the effects of a transition of a lipid in a system of 36 lipids/leaflet will propagate across the 50 Å/side box length, and thereby artificially increase the diffusion constant. Because the 288 PME system is nearly 200 Å/side, such artifacts are unlikely.
The finite size effect reported here is opposite of that in pure bulk simulations, where the self-diffusion constant increases with system size.4,5 Yeh and Hummer5 determined that the effect in homogeneous systems is hydrodynamic in origin. In bilayers, the present finite size effect is shorter range and predominantly collisional. It is possible that a longer-range hydrodynamic effect will be observed in simulations of larger bilayers.
Recent simulations of a 1-stearoyl-2-oleoyl-phosphatidylethanolamine (SOPE) lipid bilayer of 72 lipids showed hydrogen bond networks that span the simulation box size.34 In contrast to the present DPPC simulations, the calculated Dℓ is lower than experiment by a factor of about three. While the time spent in the clusters is small, such the hydrogen bond networks might be expected to retard diffusion. Simulations SOPE bilayer with larger sizes are needed to determine whether such large hydrogen bond networks are partly finite artifacts and are the cause of the large underestimate of Dℓ.
Lastly, if the COM displacement of each monolayer is removed from the lipid COM displacement, the lateral diffusion constant () is reduced by more than factor of 4 for 72 PME, but only 6% for 288 PME (Table 1). The origin of this finite size is two-fold. First, as the size of the bilayer increases, the effect of lipid diffusion on the COM of each monolayer decreases; i.e., . Second, correlated motion leads to substantial unidirectional displacements for 72 PME. Removal of the monolayer COM removes some of these, further reduces , and the errors partially cancel. In general, monolayer COM displacement should not be removed when evaluating diffusion constants of lipids in bilayers.
B. Finite size effects on bilayer structure and lipid reorientation
The electron density of the lipid bilayer and deuterium order parameters of the lipids are equal for our 72 and 288 PME simulations. These results agree with de Vries et al.3, where structural properties converged at a simulation size of 72 lipids (36 per leaflet). Although these structural properties remain unchanged, the enhanced lipid diffusion calculated for the 72 PME may influence radial and angular distributions of the lipid charged atoms. Therefore, the two-dimensional radial distribution function, g2D(r), for the P and N atoms in DPPC for 72 and 288 PME is now considered. The g2D(r) averages out the bilayer normal axis and is a distribution function per leaflet. Figure 6 plots g2D(r) for P-N and N-N and demonstrates that the distributions are identical for both system sizes. The distribution of the relative orientation of the P-N dipole is also a measure of changes in angular distributions. Figure 7 shows the angular probability of all lipids within 7 Å of the reference lipid (averaged over all lipids). A cutoff value of 7 Å was chosen because it resulted in a distribution with the largest peak at 180°, i.e., neighboring dipoles are in opposite direction. The difference between 72 PME and 288 PME is negligible. These results demonstrate that even though the lateral diffusion shows system size dependence the head group radial and angular distribution functions do not.
Figure 6.
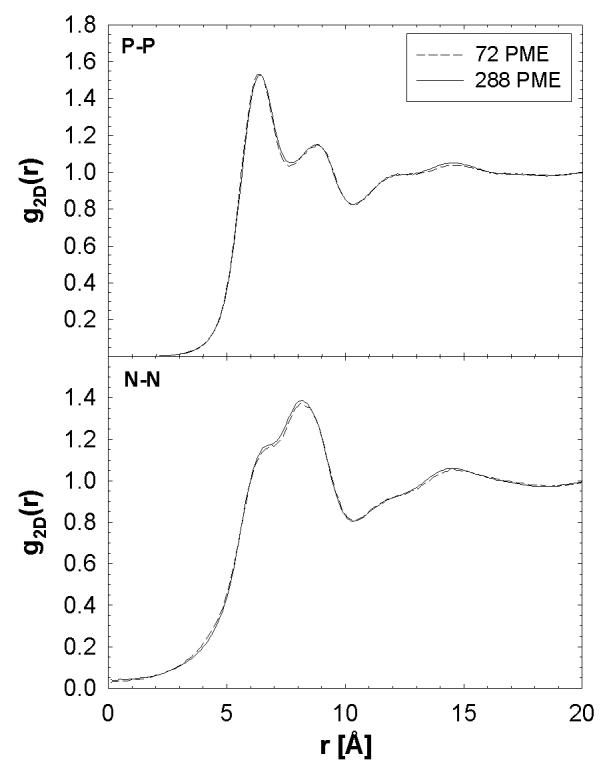
The 2-dimensional radial distribution functions, g2D(r), for one leaflet for P-P (top) and N-N (bottom).
Figure 7.

The probability of finding a neighbor with an angle θ defined by the angle formed between its P-N vector and those neighboring lipids less than 7 Å of separation between the phosphorous atoms.
The hopping rate in the 72 PME systems is approximately 0.1ns−1 (Table 2). Consequently, rotational motions of the lipid, which take place on the 1 to 10 ns time scale,35,36 could be perturbed by the finite size effect observed for lateral diffusion. To investigate this possibility, three vectors were considered: the principal axis (PA), phosphorous-nitrogen (P-N) vector, and phosphorous-hydrogen (P-H) vector with the neighboring hydrogen on glycerol. The P-N vector is a measure of head group motion, PA is associated with wobble,35 and P-H with axial diffusion.36 Figure 8 plots the reorientational correlation functions for these three vectors for 72 and 288 systems. There is a slight deviation for the C2(t) of the PA, but the three runs of 72 PME bracket the 288 PME result (only the average is shown). The fastest relaxing P-N vector shows negligible differences between the small and large systems.
Figure 8.
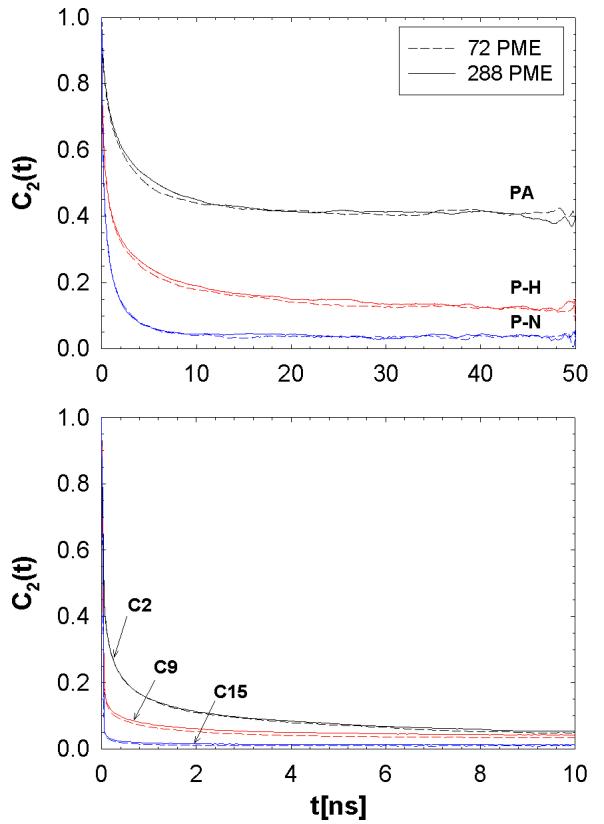
(color online) Second rank reorientational correlation functions of the principal axis (PA), P-N, and the vector between the phosphate and adjacent glycerol hydrogen (P-H) (top), and C-H vectors of aliphatic carbons C2, C9, and C15 (bottom) for 72 PME and 288 PME.
Next, the fast torsional motions of the carbon-hydrogen vectors on the aliphatic chain are compared for the two systems. The reorientational correlation functions for the C2, C9, and C15 positions (C2 is closest to the headgroup) are shown in the bottom panel of Fig. 8. Similar to the above mentioned correlation functions, the decays are nearly identical for the 72 PME and 288 PME, with the expected decrease of relaxation times with increasing distance from the head group. The invariance of C2(t) to system sizes greater than or equal to 72 lipids allows for force field parameterization on torsional changes to the potential function based on results of a smaller system of 72 lipids.
IV. Summary
Correlation of diffusional jumps of lipids extends to next nearest neighbors (16 Å) in a bilayer of 288 lipids simulated with particle mesh Ewald (PME). This explains the bursts of lipid jumps (Fig. 4) and three-fold increase in the lipid lateral diffusion constant Dℓ in bilayers of 72 lipids (Table 1); i.e., the simulation box (50 Å/side) is not substantially larger than natural correlation length. Dℓ for the 288 lipid system is in good agreement with experiment, as are the short-time lateral diffusion constants, of both systems (Table 1). The preceding length-scale considerations argue against PME causing the finite size artifact. Rather, a 50 Å cell is simply too small to simulate lipid diffusion adequately.
A simulation of 72 lipids carried out with force switching on the electrostatic interactions yielded an unphysical interdigitated bilayer resembling the m domain of the ripple phase. This result further supports the use of PME, and highlights the sensitivity of phase behavior of lipids to long-range electrostatic forces.
Although lateral diffusion is dependent on system size, other properties calculated here are independent. A system size of 72 lipids is sufficiently large for calculating structural properties such as electron density and deuterium order parameters. The neighboring P-N dipole orientation, radial distribution functions, correlation functions for overall lipid rotation, and individual C-H isomerizations are also independent of system size.
In conclusion, MD simulations with 72 lipids and PME have converged structural properties and internal dynamical properties. Consequently, force field parameterization and limited-scope simulations can use these small system sizes with PME to rapidly obtain the desired properties. Larger simulation sizes are required to obtain accurate lateral diffusion constants. These results may also be important in simulations with membrane proteins, especially mechanosensitive channels,37 where quiescent and hyperactive periods of motion for small systems could effect the gating of these proteins.
V. Acknowledgments
This research was supported in part by the Intramural Research Program of the NIH, National Heart, Lung and Blood Institute. We thank Klaus Gawrisch and Scott Feller for helpful discussions.
References
- 1.Lindahl E, Edholm O. Biophysical Journal. 2000;79(1):426. doi: 10.1016/S0006-3495(00)76304-1. [DOI] [PMC free article] [PubMed] [Google Scholar]
- 2.Feller SE, Pastor RW. Biophysical Journal. 1996;71(3):1350. doi: 10.1016/S0006-3495(96)79337-2. [DOI] [PMC free article] [PubMed] [Google Scholar]
- 3.de Vries AH, Chandrasekhar I, van Gunsteren WF, Hunenberger PH. Journal of Physical Chemistry B. 2005;109(23):11643. doi: 10.1021/jp0507952. [DOI] [PubMed] [Google Scholar]
- 4.Klauda JB, Brooks BR, MacKerell AD, Jr., Venable RM, Pastor RW. Journal of Physical Chemistry B. 2005;109(11):5300. doi: 10.1021/jp0468096. [DOI] [PubMed] [Google Scholar]
- 5.Yeh IC, Hummer G. Journal of Physical Chemistry B. 2004;108(40):15873. [Google Scholar]
- 6.Essmann U, Berkowitz ML. Biophysical Journal. 1999;76(4):2081. doi: 10.1016/S0006-3495(99)77364-9. [DOI] [PMC free article] [PubMed] [Google Scholar]
- 7.Lindahl E, Edholm O. Journal of Chemical Physics. 2001;115(10):4938. [Google Scholar]
- 8.Patra M, Karttunen M, Hyvonen MT, Falck E, Vattulainen I. Journal of Physical Chemistry B. 2004;108(14):4485. [Google Scholar]
- 9.Darden T, York D, Pedersen L. Journal of Chemical Physics. 1993;98(12):10089. [Google Scholar]
- 10.Feller SE, Pastor RW, Rojnuckarin A, Bogusz S, Brooks BR. Journal of Physical Chemistry. 1996;100(42):17011. [Google Scholar]; Patra M, Karttunen M, Hyvonen MT, Falck E, Lindqvist P, Vattulainen I. Biophysical Journal. 2003;84(6):3636. doi: 10.1016/S0006-3495(03)75094-2. [DOI] [PMC free article] [PubMed] [Google Scholar]
- 11.Luty BA, Tironi IG, van Gunsteren WF. Journal of Chemical Physics. 1995;103(8):3014. [Google Scholar]
- 12.Hunenberger PH, McCammon JA. Journal of Chemical Physics. 1999;110(4):1856. [Google Scholar]
- 13.Brooks BR, Bruccoleri RE, Olafson BD, States DJ, Swaminathan S, Karplus M. Journal of Computational Chemistry. 1983;4(2):187. [Google Scholar]
- 14.Phillips JC, Braun R, Wang W, Gumbart J, Tajkhorshid E, Villa E, Chipot C, Skeel RD, Kale L, Schulten K. Journal of Computational Chemistry. 2005;26(16):1781. doi: 10.1002/jcc.20289. [DOI] [PMC free article] [PubMed] [Google Scholar]
- 15.Durell SR, Brooks BR, Bennaim A. Journal of Physical Chemistry. 1994;98(8):2198. [Google Scholar]; Jorgensen WL, Chandrasekhar J, Madura JD, Impey RW, Klein ML. Journal of Chemical Physics. 1983;79(2):926. [Google Scholar]
- 16.Feller SE, Venable RM, Pastor RW. Langmuir. 1997;13(24):6555. [Google Scholar]
- 17.Nagle JF, Tristram-Nagle S. Biochimica et Biophysica Acta-Reviews on Biomembranes. 2000;1469(3):159. doi: 10.1016/s0304-4157(00)00016-2. [DOI] [PMC free article] [PubMed] [Google Scholar]
- 18.Feller SE, Pastor RW. Journal of Chemical Physics. 1999;111(3):1281. [Google Scholar]
- 19.Venable RM, Skibinsky A, Pastor RW. Molecular Simulation. 2006 In Press. [Google Scholar]
- 20.Lagüe P, Pastor RW, Brooks BR. Journal of Physical Chemistry B. 2004;108(1):363. [Google Scholar]
- 21.Ryckaert JP, Ciccotti G, Berendsen HJC. Journal of Computational Physics. 1977;23:327. [Google Scholar]
- 22.Hoover WG. Physical Review A. 1985;31(3):1695. doi: 10.1103/physreva.31.1695. [DOI] [PubMed] [Google Scholar]
- 23.Nosé S, Klein ML. Journal of Chemical Physics. 1983;78(11):6928. [Google Scholar]; Andersen HC. Journal of Chemical Physics. 1980;72(4):2384. [Google Scholar]
- 24.Vaz WLC, Almeida PF. Biophysical Journal. 1991;60(6):1553. doi: 10.1016/S0006-3495(91)82190-7. [DOI] [PMC free article] [PubMed] [Google Scholar]
- 25.Vaz WLC, Clegg RM, Hallmann D. Biochemistry. 1985;24(3):781. doi: 10.1021/bi00324a037. [DOI] [PubMed] [Google Scholar]
- 26.Carpenter GA, Grossberg S. Applied Optics. 1987;26(23):4919. doi: 10.1364/AO.26.004919. [DOI] [PubMed] [Google Scholar]; Karpen ME, Tobias DJ, Brooks CL. Biochemistry. 1993;32(2):412. doi: 10.1021/bi00053a005. [DOI] [PubMed] [Google Scholar]
- 27.Brown ML, Venable RM, Pastor RW. Biopolymers. 1995;35(1):31. doi: 10.1002/bip.360350105. [DOI] [PubMed] [Google Scholar]
- 28.Tabony J, Perly B. Biochimica et Biophysica Acta. 1991;1063(1):67. doi: 10.1016/0005-2736(91)90354-b. [DOI] [PubMed] [Google Scholar]
- 29.Wohlert J, Edholm O. Biophysical Journal. 2004;87(4):2433. doi: 10.1529/biophysj.104.044222. [DOI] [PMC free article] [PubMed] [Google Scholar]
- 30.Katsaras J, Tristram-Nagle S, Liu Y, Headrick RL, Fontes E, Mason PC, Nagle JF. Physical Review E. 2000;61(5):5668. doi: 10.1103/physreve.61.5668. [DOI] [PubMed] [Google Scholar]; Sun WJ, Tristram-Nagle S, Suter RM, Nagle JF. Proceedings of The National Academy of Sciences of The United States of America. 1996;93(14):7008. doi: 10.1073/pnas.93.14.7008. [DOI] [PMC free article] [PubMed] [Google Scholar]
- 31.de Vries AH, Yefimov S, Mark AE, Marrink SJ. Proceedings of the National Academy of Sciences of the United States of America. 2005;102(15):5392. doi: 10.1073/pnas.0408249102. [DOI] [PMC free article] [PubMed] [Google Scholar]
- 32.Mason PC, Gaulin BD, Epand RM, Wignall GD, Lin JS. Physical Review E. 1999;59(1):921. [Google Scholar]
- 33.Scheidt HA, Huster D, Gawrisch K. Biophysical Journal. 2005;89(4):2504. doi: 10.1529/biophysj.105.062018. [DOI] [PMC free article] [PubMed] [Google Scholar]
- 34.Pitman MC, Suits F, Gawrisch K, Feller SE. Journal of Chemical Physics. 2005;122(24) doi: 10.1063/1.1899153. [DOI] [PubMed] [Google Scholar]; Suits F, Pitman MC, Feller SE. Journal of Chemical Physics. 2005;122(24) doi: 10.1063/1.1899152. [DOI] [PubMed] [Google Scholar]
- 35.Pastor RW, Venable RM, Feller SE. Accounts of Chemical Research. 2002;35(6):438. doi: 10.1021/ar0100529. [DOI] [PubMed] [Google Scholar]
- 36.Roberts MF, Redfield AG. Proceedings of the National Academy of Sciences of the United States of America. 2004;101(49):17066. doi: 10.1073/pnas.0407565101. [DOI] [PMC free article] [PubMed] [Google Scholar]; Roberts MF, Redfield AG. Journal of the American Chemical Society. 2004;126(42):13765. doi: 10.1021/ja046658k. [DOI] [PubMed] [Google Scholar]
- 37.Gullingsrud J, Schulten K. Biophysical Journal. 2003;85(4):2087. doi: 10.1016/s0006-3495(03)74637-2. [DOI] [PMC free article] [PubMed] [Google Scholar]