

Abstract
Background
The formation of α‐synuclein aggregates may be a critical event in the pathogenesis of multiple system atrophy (MSA). However, the role of this gene in the aetiology of MSA is unknown and untested.
Method
The linkage disequilibrium (LD) structure of the α‐synuclein gene was established and LD patterns were used to identify a set of tagging single nucleotide polymorphisms (SNPs) that represent 95% of the haplotype diversity across the entire gene. The effect of polymorphisms on the pathological expression of MSA in pathologically confirmed cases was also evaluated.
Results and conclusion
In 253 Gilman probable or definite MSA patients, 457 possible, probable, and definite MSA cases and 1472 controls, a frequency difference for the individual tagging SNPs or tag‐defined haplotypes was not detected. No effect was observed of polymorphisms on the pathological expression of MSA in pathologically confirmed cases.
Keywords: alpha synuclein, association study, MSA
During the 35 years since Graham and Oppenheimer originally coined the term multiple system atrophy (MSA), little progress has been made in determining the aetiology of this rare disease. Although the clinical and pathological findings are relatively homogeneous, MSA has been poorly studied and the importance of genetic factors is unclear.1,2 Perhaps the most significant advance has been the discovery that oligodendroglial cytoplasmic inclusions, composed of α‐synuclein filamentous aggregates, represent a histopathological hallmark of MSA.3,4 Few aetiological studies have been done for MSA. For example, only two small studies have screened patients with MSA for α‐synuclein mutations and only one case–control study has been reported.5,6,7 This latter study, which was negative, had limited power because of its small sample size (n = 46).
In the present study we defined the linkage disequilibrium (LD) patterns in α‐synuclein and selected a set of tagging single nucleotide polymorphisms (tSNPs) which we estimated to represent 95% of the haplotype diversity. This strategy minimises the possibility of missing a functional variant(s), as it enables a statistical assessment on the allelic state of other SNPs in the gene, with the exception of variants with a minor allele frequency (MAF) <5%, where this approach may not perform well.8 In a second part to this study, we investigated whether genetic variation in α‐synuclein might account for the unexplained anatomical predilections seen in MSA, specifically striatonigral degeneration (SND) and olivopontocerebellar atrophy (OPCA) pathology.
Methods
The Joint Research Ethics Committee of the Institute of Neurology and the National Hospital for Neurology and Neurosurgery approved this project.
Subjects
A total of 253 patients with MSA were collected through the European MSA Study Group (EMSA‐SG), a collaborative effort across multiple European centres.9 Of these, 168 patients were diagnosed as having Gilman probable MSA.10 An additional 85 cases were included in this study in which a neuropathological confirmation of MSA was obtained from archival brain tissue at the Queen Square Brain Bank for Neurological Disorders, London, UK.11 These 85 cases are also part of a series of 100 MSA cases, in which data of a detailed neuropathological analysis to establish the spectrum of clinicopathological correlations have been published elsewhere.12 We excluded 204 patients with Gilman possible MSA from the main analysis to maximise the accuracy of the study. However, the whole dataset of 457 possible, probable, and definite MSA patients was also analysed in a secondary analysis.
Our controls consisted of 1472 individuals who were either healthy volunteers or the partners of patients seen with Parkinson's disease (PD). A consultant neurologist assessed most control subjects (82%) and none exhibited parkinsonism at recruitment. Patients and controls were of European origin and matched for age (MSA: 58.1 years (mean age of onset); control: 56.1 years) and sex (MSA: men 50%; control: men 49%).
Haplotype structure and linkage disequilibrium
To define the haplotype structure of the α‐synuclein gene, we initially resequenced regions of the gene in a set of 32 CEPH trios13 (father, mother, and child) and identified an initial panel of SNPs that could be used to construct haplotypes. The use of trios enabled the construction of haplotypes with known chromosomal phase. Haplotype frequencies in this population group were inferred using an expectation‐maximisation (EM) algorithm. The algorithm combines information from resolved and unresolved chromosomes and, in those that are unresolved, restricts the set of possible haplotypes to those consistent with known data from both parents and child.
Pairwise LD was calculated between all loci, by first estimating pairwise haplotype frequencies using the trio based EM algorithm, then assessing the statistical strength via a likelihood ratio test (comparing EM frequencies with haplotype frequencies estimated assuming no LD).
Selection of tagging SNPs
In all cases tSNPs were selected using an association based criterion, which selects tSNPs based on the level of prediction—haplotype r2—independent of any underlying LD pattern. The MATLAB routines and detailed explanation of the criteria and rationale behind selecting tSNPs using association based (r2) criteria is obtainable from our website (http://popgen.biol.ucl.ac.uk).14 In this implementation, we have required the minimum r2 between all SNPs and the tSNP sets to be 0.85.
Drop SNP test
We also evaluated the power of our tSNPs to predict SNPs in α‐synuclein that were not detected by the SNP detection step. A subsampling procedure was used by sequentially dropping each one of the 21 SNPs which we discovered and calculating a new set of tSNPs from the remaining 20 SNPs. We then evaluated how well these new tSNPs predicted the allelic state of each of the dropped SNPs, thus estimating performance in representing unknown SNPs.
Genotyping
All DNA liquid handling was performed robotically to reduce error and genotyping was performed using TaqMan (ABI) as described elsewhere.15 As a quality control measure, 5% of all genotypes were directly sequenced and water blanks were used.
Statistical methods
The statistical methodology used in this study has been outlined previously.16 Briefly, the allele and genotype frequency of each tSNP was compared between MSA and controls using a Pearson's χ2 test. The frequencies of haplotypes were compared using the FPMP program.17 Statistical significance was based on a p value <0.05, using Bonferroni's correction to account for the total number of tests performed.
Power calculations
We performed a series of prospective calculations to assess the power of our study to detect potential association. Under a multiplicative disease risk model, we calculate 90% power to detect association making the following assumptions: marker MAF = 12.5%, potential causal variant MAF = 10%, D′ = 1, and relative risk of 1.75 (heterozygous) based on a p value at the 0.016 test level. This means that there was a 10% chance that our study would fail to detect association with an effect size equal to or greater than this.18
Pathological correlation with genotype
To establish whether the SND and OPCA predominant MSA morphological phenotypes are genetically predetermined, the tSNP frequencies between cases with SND (n = 34) or OPCA (n = 17) predominant pathology were compared. Cases with mixed SND–OPCA pathology (n = 34) were omitted.12 Tagging SNP allele frequency differences between the two pathological subgroups or between each subgroup and controls were determined.
Results
Linkage disequilibrium and haplotype structure
We identified 21 SNPs with a MAF >10% (table 1). A single block of LD was identified, which extended across the entire gene and four major haplotypes captured most of the haplotype diversity (fig 1 and table 2). This indicated that a haplotype tagging strategy would summarise genetic variation with modest loss in power relative.8
Table 1 Single nucleotide polymorphisms (SNPs) detected in α‐synuclein by the initial SNP detection step.
| dbSNP number (if available) | Clone position (NT 016354) | Allele | Minor allele frequency (%) |
|---|---|---|---|
| rs1372525 | 15270869 | C→T | 37 |
| rs2619363 | 15253751 | C→A | 31 |
| rs2301134 | 15253649 | C→T | 46 |
| rs2028535 | 15251125 | G→C | 31 |
| rs2737006 | 15244390 | C→T | 35 |
| rs3216147 | 15238021 | Ins G (78) | 37 |
| rs972880 | 15233959 | A→G | 20 |
| rs2583959 | 15216341 | C→G | 29 |
| rs2737024 | 15216264 | A→G | 29 |
| rs2737028 | 15211720 | C→T | 13 |
| rs2737029 | 15206474 | G→A | 42 |
| rs2737032 | 15203873 | T→C | 10 |
| rs356184 | 15197937 | G→A | 28 |
| rs356163 | 15191531 | G→T | 28 |
| rs356187 | 15187172 | A→G | 28 |
| rs356195 | 15177872 | A→G | 28 |
| 15163399 | A→G | 11 | |
| rs356200 | 15163318 | C→T | 43 |
| rs356204 | 15158246 | C→T | 44 |
| rs356166 | 15143994 | C→G | 27 |
| rs356165 | 15141590 | T→C | 38 |
Minor allele frequency based on 128 unrelated CEPH chromosomes.
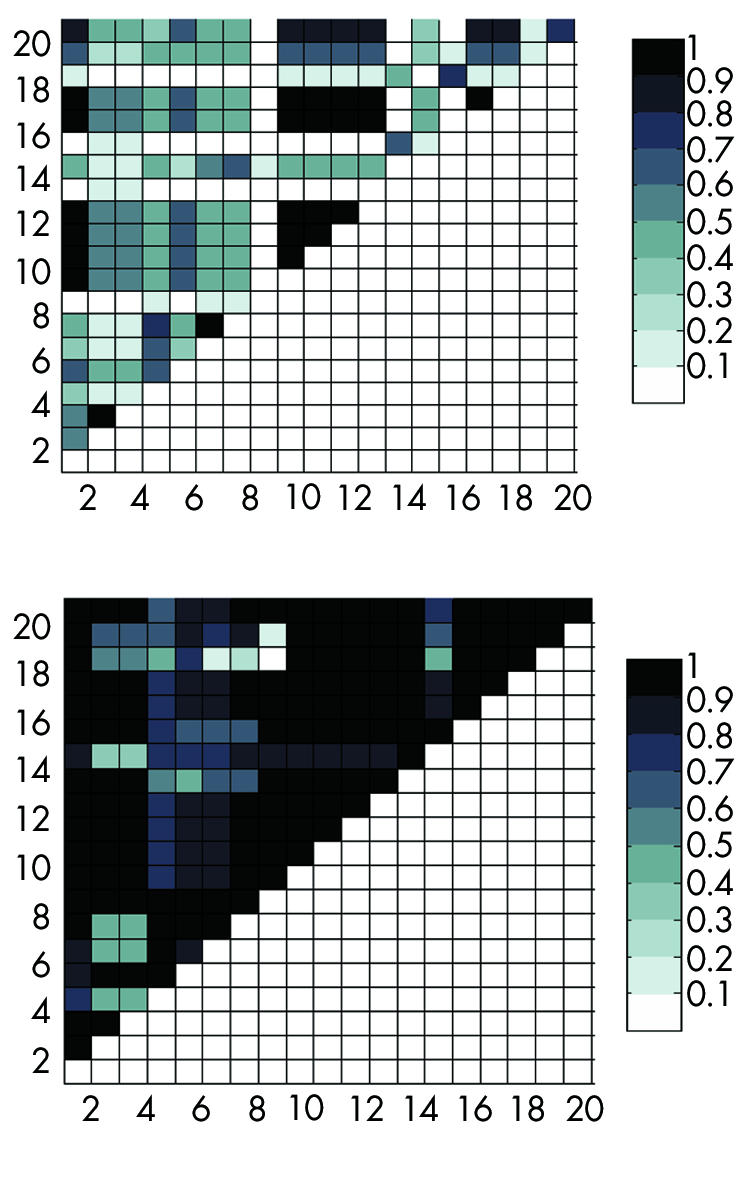
Figure 1 Plots of pairwise linkage disequilibrium (LD) values between single nucleotide polymorphisms (SNPs). Each square represents the strength of LD between two SNPs, as measured by r2 (top) and D′ (bottom). Each SNP on the x axis is plotted against all detected SNPs represented on the y axis. Squares of moderate to high LD are shown in darker colour as indicated on the scale.
Table 2 Summary of haplotypes defined by the four tagging single nucleotide polymorphisms for α‐synuclein.
| Haplotype | rs2301134 | rs2737006 | rs2737029 | rs356165 | Probable and definite MSA (%) n = 253 | Possible, probable, and definite (%) n = 457 | Control (%) n = 1472 |
|---|---|---|---|---|---|---|---|
| A | 1 | 1 | 1 | 2 | 86 (34.0) | 153 (33.4) | 529 (35.9) (35.9) |
| B | 2 | 2 | 2 | 1 | 65 (25.7) | 107 (23.4) | 344 (23.4) (23.3) |
| C | 2 | 1 | 1 | 2 | 42 (16.6) | 75 (16.4) | 261 (17.7) (17.7) (17.7) |
| D | 1 | 1 | 2 | 1 | 23 (9.1) | 35 (7.7) | 132 (9.0) (9.0) (9.0) |
| E | 2 | 2 | 2 | 2 | 11 (4.3) | 27 (5.9) | 73 (5.0) (5.0) |
| F | 1 | 1 | 2 | 2 | 13 (5.1) | 23 (5.0) | 61 (4.1) ((9.0) (9.0) (4.1) |
| G | 2 | 1 | 1 | 1 | 8 (3.2) | 19 (4.2) | 53 (3.6) (3.6) |
| H | 1 | 1 | 1 | 1 | 5 (2.0) | 12 (2.6) | 47 (3.2) (3.2) |
The χ2 for heterogeneity model = 5.35 (df = 7), p value = 0.62.
There was a clear relation between the average haplotype r2 and the number of tSNPs used (that is, between the “tagging” and “tagged” SNPs). Beyond four tSNPs, the relation with performance (measured by average r2 and minimum r2) approached an asymptote, and four tSNPs represented all the initially discovered SNPs with a high coefficient of determination (data not shown). The best performing tagging set was: rs2301134, rs2737006, rs2737029, and rs356165.
We also tested how these tags represented SNPs previously associated with PD (rs3216147, rs2619363, rs2583988, rs2619364).19,20,21 To assess this, these were genotyped in the CEPH trios and we directly assessed their tSNP predictability. However as rs2301134 and rs3216147 were already formed of our initial discovered SNP panel these did not need to be assessed. On measuring the r2 between the remaining two SNPs and our tSNPs we found a minimum r2 value of 0.87, confirming our power to represent non‐genotyped variation and indicating that our study had power to replicate previously published associations.
We excluded one highly polymorphic multi‐allelic repeat {(TC)10–11TT(TC)8–11(TA)7–9(CA)10–11} known as Rep1, which has been inconsistently associated with PD. As discussed by Farrer et al, there have been concerns about methodologies that have grouped this multi‐allelic variant (48 theoretical allelic combinations) into a smaller subset of between two and five binned alleles, based on allele size alone, even though alleles of the same size have been shown to be heterogeneous.19,20 Moreover, these studies also failed to correct for multiple comparison testing, which we estimate would have negated all positive findings. We are unaware of a reliable strategy to represent this repeat accurately, but would expect (but have not shown) that our tags would represent any common Rep1 allele or haplotypes defined by it.
The average haplotype r2 for the entire data set was 0.92 and the minimum r2 was 0.84. Finally the haplotype r2 for the new tags against each dropped SNP indicated that all the SNPs originally discovered would have been represented by our initial tSNP set had we not detected them in the initial SNP detection step (minimum r2 = 0.71).
Statistical analyses
There were no deviations from the Hardy–Weinberg equilibrium in this study. For the clinically probable and pathological set of patients (n = 253), we did not detect a case–control frequency difference in allele or genotype for individual tSNPs or tag defined haplotypes (χ2 = 5.35 (df = 7), p = 0.62) (tables 2 and 3). There was a case‐control frequency difference for tSNP rs2737029 when tested individually (p = 0.044), however this was negated after correction for multiple comparison (χ2 = 6.25 (df = 6), p = 0.39), and should be interpreted as a false positive result unless independently replicated. Subanalysis of the whole MSA set (possible, probable, and pathological; n = 457) and analysis of pathologically confirmed MSA only were also negative.
Table 3 A summary of the genotype and allele data from each tagging single nucleotide polymorphism in cases and controls used to represent the α‐synuclein gene.
| Genotype | rs2301134 | rs2737006 | rs2737029 | rs356165 | ||||||||
|---|---|---|---|---|---|---|---|---|---|---|---|---|
| C/C | CT | TT | CC | C/T | T/T | G/G | G/A | A/A | TT | TC | CC | |
| MSA 253 (definite + probable) | 66 | 124 | 61 | 137 | 99 | 17 | 89 | 105 | 61 | 89 | 124 | 39 |
| MSA 457 (definite + probable + possible) | 122 | 223 | 107 | 251 | 174 | 37 | 145 | 169 | 61 | 160 | 229 | 73 |
| MSA 85 (definite) | 21 | 41 | 21 | 43 | 34 | 8 | 30 | 38 | 17 | 31 | 42 | 14 |
| Control | 391 | 696 | 362 | 759 | 575 | 131 | 495 | 699 | 262 | 522 | 705 | 230 |
Finally, we did not detect an allele frequency difference between SND and OPCA pathological subtypes. We did not perform a haplotype analysis here, since the number of pathological MSA cases was too small for robust statistical analysis.
Discussion
We have used a rigorous strategy, based on the organisation of LD in the human genome, to assess the role of common genetic variation in the α‐synuclein gene in the aetiology of MSA. Using a tSNP approach, we did not detect a α‐synuclein–MSA association. This finding contrasts with PD, where α‐synuclein may be associated with increased risk.19,20,21,22
Although negative, this result is important for several reasons. Firstly, we provide the first report on the LD structure of the α‐synuclein gene. The gene comprises a single block of high LD and low haplotype diversity—that is, four major haplotypes (table 2), and this low diversity should influence future genetic studies in other synucleinopathies such as PD. Secondly, the tagging approach minimises the possibility of a false negative result. Thirdly, the large sample size allowed power to detect association had the α‐synuclein gene conveyed the same risk to MSA as reported for PD. To maximise power, we used a greater number of controls (n = 1472).
Finally, as well as providing evidence that common genetic variation in the α‐synuclein gene does not influence the aetiology of MSA, we also show that it does not influence the clinicopathological phenomenon whereby some patients get the SND variant and others get OPCA. However, we emphasise that this subanalysis was restricted to a smaller subgroup and therefore had only limited statistical power.
The absence of disease associated α‐synuclein variation suggests that other genes may influence the pathogenesis of MSA and this remains to be tested. At present, population based association studies represent the most powerful approach.23,24 This is especially true as MSA lacks candidate genes emerging from strategies such as linkage analysis. As part of the EMSA study group, our focus will now turn to genes that regulate and interact with α‐synuclein. Eventually, we hope that this strategy will provide the first clues into the aetiology of this disease.
Acknowledgements
We sincerely thank both patients and controls for participation in this study. This study was performed under the auspices of the European MSA Study Group (coordinator Thomas Gasser; http://www.emsa‐sg.org/) and was supported by the Queen Square Brain Bank for Neurological Disorders, UK (provision of the pathological specimens), the Parkinson's Disease Society, UK, (T O, D G H, N W W, and T R) and the Brain Research Trust (N W W, P M A S). We also wish to thank Dr C A Mein, Genome Centre, Queen Mary and Westfield College, Charterhouse Square, London, UK.
Abbreviations
EM - expectation‐maximisation
EMSA‐SG - European MSA Study Group
LD - linkage disequilibrium
MAF - minor allele frequency
MSA - multiple system atrophy
OPCA - olivopontocerebellar atrophy
PD - Parkinson's disease
SND - striatonigral degeneration
tSNP - tagging single nucleotide polymorphism
Footnotes
Competing interests: none declared
References
- 1.Graham J G, Oppenheimer D R. Orthostatic hypotension and nicotine sensitivity in a case of multiple system atrophy. J Neurol Neurosurg Psychiatry 19693228–34. [DOI] [PMC free article] [PubMed] [Google Scholar]
- 2.Wenning G K, Colosimo C, Geser F.et al Multiple system atrophy. Lancet Neurol 2004393–103. [DOI] [PubMed] [Google Scholar]
- 3.Papp M I, Kahn J E, Lantos P L. Glial cytoplasmic inclusions in the CNS of patients with multiple system atrophy (striatonigral degeneration, olivopontocerebellar atrophy and Shy‐Drager syndrome). J Neurol Sci 19899479–100. [DOI] [PubMed] [Google Scholar]
- 4.Wakabayashi K, Hayashi S, Kakita A.et al Accumulation of alpha‐synuclein/NACP is a cytopathological feature common to Lewy body disease and multiple system atrophy. Acta Neuropathol 199896445–452. [DOI] [PubMed] [Google Scholar]
- 5.Chen R, Forno L S, Di Monte D A.et al Mutations screening in the alpha synuclein gene in MSA. Parkinsonism Relat Disord 19995S28 [Google Scholar]
- 6.Ozawa T, Takano H, Onodera O.et al No mutation in the entire coding region of the alpha‐synuclein gene in pathologically confirmed cases of multiple system atrophy. Neurosci Lett 1999270110–112. [DOI] [PubMed] [Google Scholar]
- 7.Morris H R, Vaughan J R, Datta S R.et al Multiple system atrophy/progressive supranuclear palsy: alpha‐synuclein, synphilin, tau, and APOE. Neurology 2000551918–1920. [DOI] [PubMed] [Google Scholar]
- 8.Weale M E, Depondt C, Macdonald S J.et al Selection and evaluation of tagging SNPs in the neuronal‐sodium‐channel gene SCN1A: implications for linkage‐disequilibrium gene mapping. Am J Hum Genet 200373551–565. [DOI] [PMC free article] [PubMed] [Google Scholar]
- 9.The European MSA Study Group (coordinator T Gasser) www.emsa‐sg.org
- 10.Gilman S, Low P, Quinn N.et al Consensus statement on the diagnosis of multiple system atrophy. American Autonomic Society and American Academy of Neurology. Clin Auton Res 19988359–362. [DOI] [PubMed] [Google Scholar]
- 11.Lowe J, Lennox G, Leigh P N. Disorders of movement and system degeneration. In: Graham DI, Lantos PL, eds. Greenfield's Neuropathology. 6th ed. London: Arnold, 1997297–300.
- 12.Ozawa T, Pavior D, Quinn N P.et al The spectrum of pathological involvement of the striatonigral and olivopontocerebellar systems in multiple system atrophy; clinicopathological correlations. Brain 20041272657–2671. [DOI] [PubMed] [Google Scholar]
- 13.Centre d'Etude du Polymorphisme Humain (CEPH) database Available at: www.cephb.fr
- 14.Goldstein website (for the TagIT program) http://popgen.biol.ucl.ac.uk/software.html.Ref
- 15.Healy D G, Abou‐Sleiman P M, Ozawa T.et al A functional polymorphism regulating dopamine beta‐hydroxylase influences against Parkinson's disease. Ann Neurol 200455443–446. [DOI] [PubMed] [Google Scholar]
- 16.Sham P C, Curtis D. Monte Carlo tests for associations between disease and alleles at highly polymorphic loci. Ann Hum Genet 19955997–105. [DOI] [PubMed] [Google Scholar]
- 17.Zhao J H, Curtis D, Sham P C. Model‐free analysis and permutation tests for allelic associations. Hum Hered 200050133–139. [DOI] [PubMed] [Google Scholar]
- 18.SGDP statistical genetics group http://statgen.iop.kcl.ac.uk/gpc/
- 19.Pals P, Lincoln S, Manning J.et al alpha‐Synuclein promoter confers susceptibility to Parkinson's disease. Ann Neurol 200456591–595. [DOI] [PubMed] [Google Scholar]
- 20.Farrer M, Maraganore D M, Lockhard P.et al Alpha synuclein haplotypes are associated with Parkinson's disease. Hum Mol Genet 2001b101847–1851. [DOI] [PubMed] [Google Scholar]
- 21.Tan E K, Chai A, Teo Y Y.et al Alpha‐synuclein haplotypes implicated in risk of Parkinson's disease. Neurology 200462128–131. [DOI] [PubMed] [Google Scholar]
- 22.Polymeropoulos M H, Lavedan C, Leroy E.et al Mutation in alpha‐synuclein gene identified in families with Parkinson's disease. Science 19972762045–2047. [DOI] [PubMed] [Google Scholar]
- 23.Johnson G C, Esposito L, Barratt B J.et al Haplotype tagging for the identification of common disease genes. Nat Genet 200129233–237. [DOI] [PubMed] [Google Scholar]
- 24.Goldstein D B, Ahmadi K R, Weale M E.et al Genome scans and candidate gene approaches in the study of common diseases and variable drug responses. Trends Genet 200319615–622. [DOI] [PubMed] [Google Scholar]