

Abstract
Background & Aims
Like the heart, intestinal smooth muscles exhibit electrical rhythmicity, which originates in pacemaker cells surrounding the myenteric plexus called interstitial cells of Cajal (ICC-MY). In large mammals, ICC also line septa (ICC-SEP) between circular muscle (CM) bundles, suggesting they might be necessary for activating muscle bundles. It is important to determine their functional significance since a loss of ICC in humans is associated with disordered motility. Our aims were therefore to determine the role of ICC-SEP in activating the thick CM in the human jejunum.
Methods
The mucosa and submucosa were removed and muscle strips were cut and pinned in cross-section so that the ICC-MY and ICC-SEP networks, and the CM could be readily visualized. ICC networks and CM were loaded with the Ca2+ indicator fluo-4, and pacemaker and muscle activity was recorded at 36.5 ± 0.5 °C.
Results
Ca2+ imaging revealed that pacemaker activity in human ICC-MY can entrain ICC-SEP to excite CM bundles. Unlike the heart, pacemaker activity in ICC-MY varied in amplitude, propagation distance, and direction, leading to a sporadic activation of ICC-SEP.
Conclusions
ICC-SEP form a crucial conduction pathway for spreading excitation deep into muscle bundles of the human jejunum, necessary for motor patterns underlying mixing. A loss of these cells could severely affect motor activity.
Different strategies have evolved to conduct excitation deep into muscle in order to release Ca2+ necessary to excite many fibrils simultaneously to maximize force. Microscopically, invaginations of the plasma membrane (T-tubules) conduct action potentials deep into cardiac and skeletal muscle myocytes.1,2 Macroscopically, in order to activate the large ventricles of the heart a specialized conduction system originates in the AV node and consists of the bundle of His that divides to run down both sides of the septa separating each ventricle, where it ramifies into Purkinje fibers supplying the ventricles.1 This conduction system consists of specialized myocytes connected together by gap junctions.
The smooth muscle layers of the gastrointestinal tract of mammals also exhibit rhythmic depolarizations, referred to as slow waves, that initiate the rhythmic contractions of motility patterns.3-12 In small mammals, the pacemaker apparatus consists of a two-dimensional network of stellate cells, which lie between the longitudinal muscle (LM) and circular muscle (CM) layers, called the myenteric interstitial cells of Cajal (ICC-MY).3,7 ICC-MY are connected together and to the neighboring smooth muscle layers by gap junctions.3 ICC and muscle cells appear to develop from common mesenchymal precursor cells.13 Pacemaker tissues in the gut are more extensive than in the heart. The network of ICC is also required for active propagation of slow waves, so it runs around the entire circumference and along the length of the organs that are active phasically. In small mammals, ICC-MY can readily activate both muscle layers of the gastrointestinal tract.7,14 The structure of gastrointestinal pacemaker networks is more complex in larger mammals. In addition to the three-dimensional ICC-MY network, ICC also line septa (ICC-SEP) separating CM bundles, as in the canine stomach and colon.11,12 Gap junctions have been observed between ICC-SEP, and between ICC-SEP and adjacent smooth muscle cells.11 Myocytes in CM bundles are arranged orthogonal to the long axis of the gut, so that they can contract as a thick ring. Muscle bundles are also electrically coupled to each other via anastomosing branches.15 Although action potentials are likely to spread rapidly around the intestine along a CM bundle,16 they can propagate only a short distance (~100-200 μm) orthogonal to the direction of muscle fibers.17-20 Therefore, a specialized conduction system such as ICC-SEP may be required to organize the excitability of thick CM layers.11 At present, little is known about the role of ICC-SEP in coordinating the spread on slow waves in large mammals, however this has become an important question since loss of ICC is associated with numerous human motility disorders.21-23 Our aims were, therefore, to investigate the structure of the pacemaker in human small intestinal muscles and to determine how pacemaker activity spreads from the ICC-MY network to muscle bundles within the interior of the CM layer.
Materials and Methods
Human tissue preparation
The segments of human small intestine used in this study were obtained from the jejunum of obese patients of either sex ranging in age from 28 to 56 years as surgical waste tissues during gastric bypass operations performed for morbid obesity.5,6 The protocol was approved by the Human Subjects Research Committees at the University of Nevada and the University of California Davis. A segment of jejunum was opened along the mesenteric border and the mucosa and submucosa were removed by sharp dissection. Cross-sectional preparations (0.5-1.0 mm thick, 10 mm long): thin strips were cut parallel to the LM with a double-bladed scalpel.5,10 Flat-sheet preparations (15 x 15 mm square; ~1 mm thick): these full muscle thickness preparations were pinned serosal side up, CM down, to the base of the organ bath. Strips of LM were then peeled away to reveal the underlying ICC-MY network.6 Both preparations were continuously perfused with oxygenated Krebs’ solution (see below) at 36.5 ± 0.5 °C, and equilibrated for 4 hours before the dye loading procedure.
Visualization of Ca2+ transients
The methods for dye loading ICC have been published in detail elsewhere.6,7,14,18,19 After equilibration, tissues were incubated with fluo-4 (Molecular Probes, Eugene, OR) dissolved in a Krebs’ solution with 0.8 % dimethyl sulfoxide and 0.2 % Cremophor EL for 20 minutes at 25 °C. The final loading concentration of fluo-4 in the tissue bath was 50 μg/5ml (~10 μM). The dye primarily loaded into the exposed ICC network. Following incubation, tissues were re-perfused with Krebs’ solution to allow for de-esterification and trapping of the dye in cells.6,7,14 Preparations were then illuminated by a 100 W highpressure mercury burner and viewed with a BX50WI upright microscope fitted with epifluorescence using x4, x10, and x20 lenses (Olympus UMPlanF; Olympus, Melville, NY). Appropriate filters produced excitation of fluo-4 between 460-490 nm, and passed emissions > 515 nm (peaks: excitation 490 nm, emission 515 nm). Image sequences were captured at 15.6 frames/s using a Cascade 512B camera (Roper Scientific Inc., Trenton, NJ) and MetaMorph 6.26 software (Molecular Devices Corp, Downington, PA).6
Image analysis
Image sequences were analyzed using custom written software (Volumetry G6a, G.W.H.).6,7,14,19 Ca2+-induced fluorescence was measured in individual cells and characteristics of Ca2+ transients including frequency, time to peak, duration, and amplitude were calculated. In selected regions in the field of view (FOV), spatiotemporal (ST) maps were constructed. Fluorescence was averaged for each pixel row (horizontal) or column (vertical) within the region of interest (ROI) and the resulting lines of averaged pixels, representing fluorescence from many cells, were placed along side of each other from left to right, creating an ST map of Ca2+-induced fluorescence for the selected region (time progressing to the right). Velocity of propagation of Ca2+ waves was calculated from ST maps. For display purposes, all ST maps and individual frames presented are subtracted from the average background. The unit of Ca2+-induced fluorescence is an arbitrary unit, intensity unit (iu), corresponding to 1 pixel intensity change captured on a 16-bit gray scale. The F/F0 or F/Favg ratio was not used due to bleaching over the long recording periods. To create images of the network of ICC-MY and ICC-SEP and muscle in cross-sectional preparations, the average Ca2+ fluorescence was summed over 1,000 frames.
Immunohistochemical labeling of ICC
We verified that rhythmic fluorescent Ca2+ transients were observed in identified ICC-MY by using live labeling with Kit antibodies.6,7 After Ca2+-induced fluorescence was recorded, tissues were labeled with the AB-4 combination of murine anti-CD117/Kit/Stem cell receptor monoclonal antibodies (clones K69+, K44.2 K45; 5μg ml-1; Lab Vision Corp, Fremont, CA) for 1 hour at room temperature. Tissues were then washed with Krebs’ solution for 30 minutes before being incubated in Alexa Fluor 594 goat anti-mouse IgG (1:200; Molecular Probes, Eugene, OR) for 1 hour. Following secondary antibody tissues were again washed for 30 minutes before being examined. Labeled ICC were visualized using a Texas Red filter set (peaks: excitation 560 nm, emission 645 nm; Filter Set 41004, Chroma Technology, Rockingham, VT) and images overlaid with Ca2+-induced fluorescence signals.
Statistical analysis
Results are expressed as mean ± standard error. Data were evaluated by the paired or unpaired Student’s t-test. P < 0.05 was accepted as representing a statistical difference. “n” refers to the number of tissues (1 or 2 tissues were taken from each segment of jejunum).
Solutions and Drugs
The Krebs’ solution used in this study contained (in mM): 120.4 NaCl, 5.9 KCl, 15.5 NaHCO3, 11.5 glucose, 1.2 MgCl2, 1.2 NaH2PO4, and 2.5 CaCl2. This solution had a pH of 7.3-7.4 at 36.5 °C when bubbled with 97 % O2 - 3 % CO2. Cremophor EL, dimethyl sulfoxide, 18ß-glycyrrhetinic acid, nicardipine, and tetrodotoxin were purchased from Sigma-Aldrich Co (St. Louis, MO).
Results
Morphology of ICC network
Labeling cross-sectional preparations with antibodies to the Kit receptor3,6,7,14 enabled us to identify the complex architecture of the pacemaker network in the human small intestine. The ICC-MY network varied in thickness (100-250 μm) along the bowel, becoming thicker in between muscle bundles to form dense triangular shaped areas of ICC-MY that were continuous with ICC-SEP that extended along the outside of individual CM bundles (Figure 1A-C and Movie 1). ICC-SEP extended along the surface of CM bundles (Figure 1A-C), and we resolved penetration of the ICC-SEP to a depth of at least 607 ± 52 μm (52 ± 5 % of the total CM thickness). The maximum height and width of a CM bundle averaged 1153 ± 48 μm and 546 ± 42 μm (n=5), respectively.
Figure 1. Distribution of ICC and pacemaker activity.
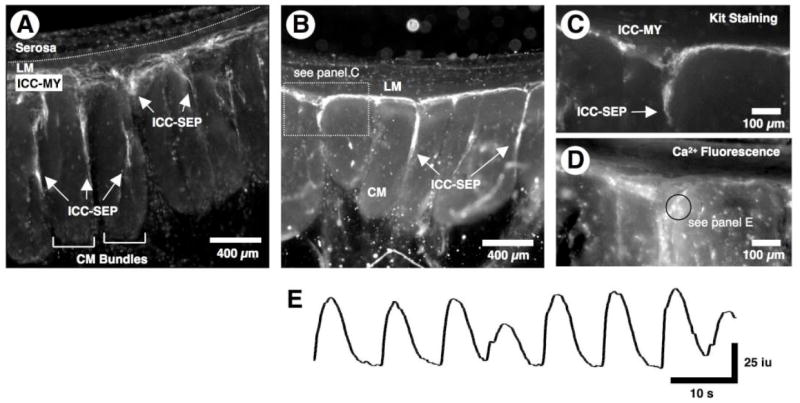
(A) Live loading of a cross-sectional preparation with antibodies to the Kit receptor revealed that ICC-MY were continuous with ICC-SEP that surrounded CM bundles. (B-E) In another preparation where the muscle did not load with fluo-4, live Kit staining (B and C) revealed that spontaneous Ca2+ transients (see E, which was recorded in ROI of D-black circle) occurred in Kit positive ICC-MY (C). C and D show the expanded triangular shaped region in B. Also, the structure of the ICC network revealed by averaging the Ca2+ fluorescence of 1,000 frames (D) corresponded to Kit positive ICC (C). Note that the spontaneous Ca2+ transients in ICC-MY varied in both amplitude and the interval between events.
Propagation of pacemaker activity in cross-sectional preparations
Cross-sectional preparations allowed dynamic resolution of the spread of pacemaker activity through the ICC-MY network and into ICC-SEP. This was not possible using flat-sheet preparations.6 Penetration of slow waves through ICC-SEP resulted in activation of muscle bundles within the CM layer.
In preparations where only the ICC-MY and ICC-SEP were loaded with fluo-4, their activity could be studied without contamination of Ca2+ signals from either the adjacent LM or CM. Spontaneous rhythmic Ca2+ transients occurred in ICC-MY (frequency 6.50 ± 0.34 c/min, range 4 to 9 c/min, n=16; duration 7.44 ± 0.22 s, n=26) (Figure 1D and E). The identity of these active cells was confirmed by spatially imaging Ca2+ transients and comparing their location with Kit antibody labeling of ICC (Figure 1B-E).6,7,14 Each Ca2+ transient was biphasic consisting of a rapid upstroke phase (time to peak 0.43 ± 0.01 s, n=25) followed by a prolonged plateau phase (time to peak 2.51 ± 0.09 s, n=25; duration 6.18 ± 0.22 s, n=25) (Figure 2C), which is similar in waveform to electrical slow waves and Ca2+ transients in flat-sheet preparations (Movie 2).6 The generation of pacemaker activity in ICC-MY was not dependent on neural activity since as it was unaffected by tetrodotoxin (1 μM, n=5).6,18
Figure 2. Propagation along ICC-MY and down ICC-SEP.
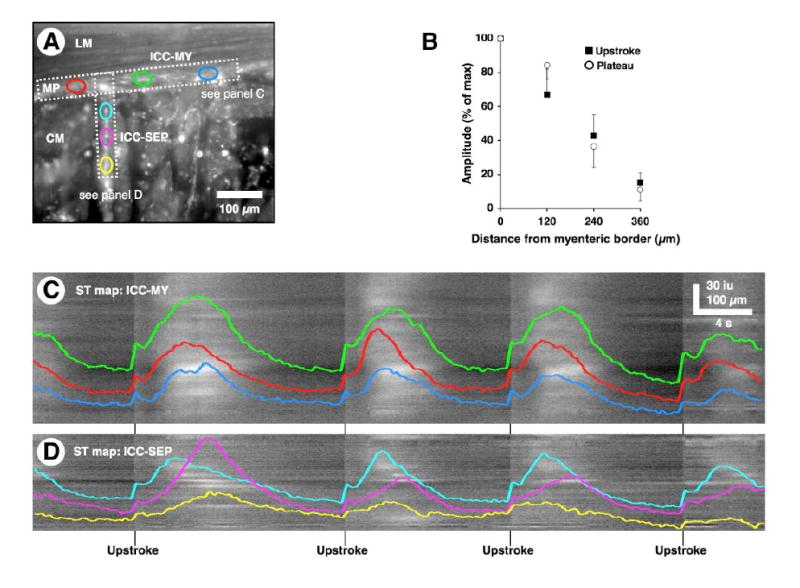
(A) Average Ca2+ fluorescence in the ICC-MY network and ICC-SEP network in a preparation where the CM did not load with fluo-4. Individual ROIs were selected from ICC-MY network (red, green, and blue ovals) and orthogonal ICC-SEP network (cyan, magenta, and yellow ovals). (B) Plot of upstroke and plateau amplitude of Ca2+ transients in ICC-SEP as a function of distance from myenteric surface of the CM (100 %, n=5). (C and D) ST maps were generated for activity in ICC-MY and ICC-SEP within the regions denoted by the horizontal and vertical rectangle in A, respectively. Several cycles of Ca2+ fluorescence were sampled from individual ROIs within the ICC-MY network (red, green, and blue traces, corresponding to the ovals in A) and ICC-SEP network (cyan, magenta, and yellow traces, corresponding to the ovals in A) regions. These traces were superimposed upon the ST maps in C and D. Note that the upstroke phase of the pacemaker activity occurred in sequence in ICC-MY and ICC-SEP. The typical pattern of Ca2+ transients in ICC-SEP was to decay in amplitude as a function of distance.
Pacemaker activity originated in ICC-MY either near the surface of the LM (n=8) or the CM (n=3) and propagated toward the opposite muscle, while at the same time propagating along the network at a velocity of 4.04 ± 0.49 mm/s (n=7). As pacemaker activity propagated along the ICC-MY network, it also conducted into ICC-SEP lying along the edges of CM bundles (Figure 2A and D and Movie 3). In many cases the spread of activity in ICC-MY failed to activate all ICC-SEP within the FOV. We also noted that activation of any given ICC-SEP was not obligatory during every pacemaker cycle. Both the upstroke and plateau phases of the pacemaker Ca2+ transient declined in amplitude in a linear manner down the ICC-SEP, reaching 37 % of their initial amplitude at the myenteric border at a depth of around 240 μm (Figure 2B). The rate-of-rise of the plateau phase, which is linearly dependent upon the size of the upstroke phase,8 also decreased as Ca2+ transients propagated through ICC-SEP (Figure 2A and D). However, ICC-SEP, like the cells within the conduction system of the heart, were also capable of generating rhythmic pacemaker activity when they were observed to be disconnected from ICC-MY. Rhythmic Ca2+ transients in ICC-SEP that appeared to be disconnected from ICC-MY occurred at a lower frequency than those in ICC-MY (ICC-SEP 3.07 ± 0.64 c/min vs. ICC-MY 6.36 ± 0.44 c/min, n=7, P < 0.01).
Activity in CM bundles
In cross-sectional preparations where the muscle was also loaded with fluo-4, pacemaker activity could be observed to spread along the ICC-MY network leading to the activation of robust Ca2+ transients (1/2 amplitude duration 0.94 ± 0.06 s, n=13) in one or more CM bundles, an example of which is shown in Figure 3A and B. Unlike the heart, however, each pacemaker cycle in ICC-MY did not necessarily activate all CM bundles within a given FOV (Figure 3A and B). If pacemaker activity in ICC-SEP caused the muscle to reach threshold, a rapid, large-amplitude Ca2+ transient was seen to propagate from the surface of the CM bundle into its interior (Figure 3C). It was not surprising that all the muscle bundles within the FOV were not activated simultaneously, since not all the ICC-SEP were activated at the same time (Figure 3A and C). In fact, activation of CM bundles in relation to a passing wave of pacemaker activity appeared to be irregular since a particular bundle could be activated several times in succession, several bundles could be activated simultaneously or activity could switch between adjacent muscle bundles (Figure 4A-C and Movie 4). It could be argued that the random activation of CM bundles was somewhat artificial due to the narrow width of our cross-sectional preparations. This seems unlikely, however, since a similar random activation of CM bundles was observed in flat-sheet preparations (Figure 4D). These preparations often showed a step-wise propagation across muscle bundles that could reverse direction of propagation after one or more cycles (Figure 4D). The rapid Ca2+ transients in muscle bundles were abolished by nicardipine (1 μM, n=6), suggesting they were generated by Ca2+ dependent action potentials through activation of L-type Ca2+ channels.3,5,6,17-19 In contrast, pacemaker activity in ICC-MY and ICC-SEP was unaffected by nicardipine.6
Figure 3. Activation of CM bundles.
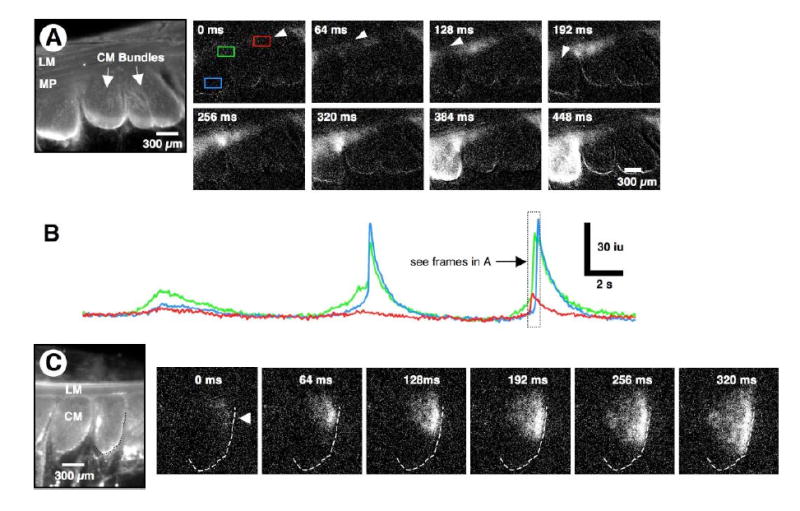
(A) Averaged Ca2+ florescence of a cross-sectional preparation. Ca2+ transients were recorded in both ICC and muscle. Activity was measured in the red and green rectangles on the ICC-MY network and the blue rectangle within a muscle bundle (see frame 0 ms). Pacemaker activity in ICC-MY originated at the arrow (see frame 0 ms) and spread along the ICC-MY network (see frame 128 ms) to the triangular ICC-MY region above ICC-SEP (see frames 128-320 ms). When activity reached ICC-SEP, it spread to the CM and excited a robust Ca2+ transient in a CM bundle (frames 384 and 448 ms). (B) Line traces taken from the three ROIs designated in A (see frame at 0 ms). Note that when pacemaker activity in the ICC-MY network was elevated (see green trace) it initiated Ca2+ transients in a CM bundle (see 2nd and 3rd cycles); the beginning of the 3rd cycle corresponds to the frames (0-448 ms) above. (C) In another preparation, pacemaker activity spread down into the ICC-SEP lying along the edge of a CM bundle (arrowhead in frame 0 ms; see outlined CM bundle in C), and then spread through the CM (right to left) toward the opposite border of the CM bundle (see frames 64 to 320 ms).
Figure 4. Activation of muscle bundles by ICC.
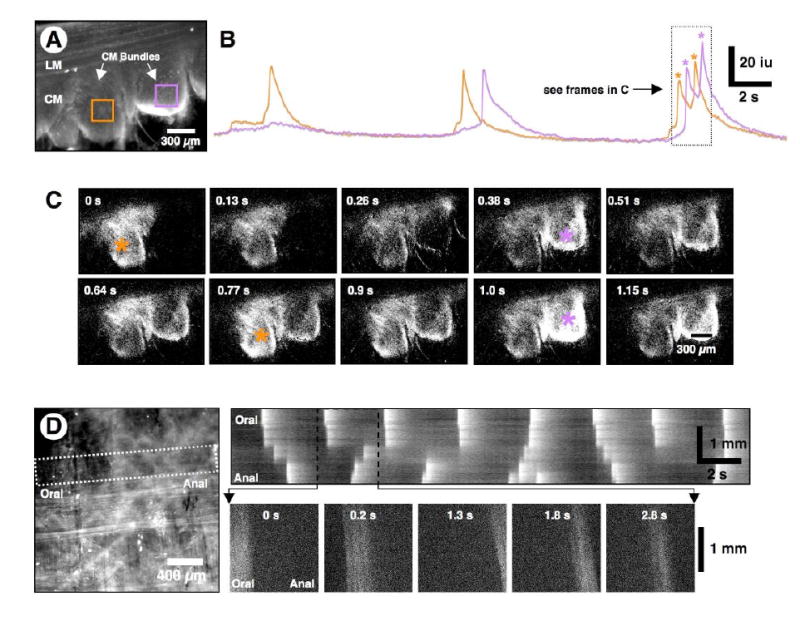
(A) Average Ca2+ florescence in cross-sectional preparation. Two ROIs were selected on adjacent CM bundles (orange and purple squares). (B) Line traces of fluorescence within the muscle ROIs show that the Ca2+ transients occurred in phase with the pacemaker cycle but were slightly out of phase in the two ROIs relative to each other (see 2nd and 3rd cycles). (C) The frames correspond to activity in the two ROIs designated in A during the final complex Ca2+ transients shown in the line traces in B (i.e., during the period designated by the dotted rectangle). Note that Ca2+ transients in the bundles showed temporal overlap, but the peaks of the transients were out of phase. The peaks of maximum activity in each bundle (orange and purple *) corresponds to the peaks of each Ca2+ transient. (D) A flat-sheet preparation from which most of the LM had been dissected away showed a network of ICC-MY lying upon the CM. The CM bundles are orientated in the vertical direction in this preparation. An ST map, constructed from the white dotted rectangle orientated across the CM bundles, shows disordered propagation of activity across CM bundles within the FOV. Note the “step-like” propagation (see 1st cycle), and incomplete propagation (2nd cycle). The lower frames (0 to 2.8 s) show the actual Ca2+ fluorescence in individual bundles across the FOV (see expanded black dotted region in the ST map). Note that each CM bundle, which runs top to bottom, was evenly illuminated when active.
Entrainment in ICC-MY networks
With low power imaging across several muscle bundles, pacemaker activity in the ICC-MY network often originated within the FOV. Under these circumstances, we observed periodic coupling and uncoupling of the pacemaker activities in two regions. When pacemaker activity was synchronized at either ends of the ICC-MY network within the FOV, ST maps showed propagation along the entire ICC-MY network. When entrainment broke-down, however, separate areas of the ICC-MY network exhibited activity at a similar frequency, but the activities in the two areas were out of phase (Figure 5A-E). Therefore, the amplitude, interval, and propagation distance of pacemaker events in ICC-MY could be irregular (Figure 5).
Figure 5. Periodic loss of entrainment of pacemaker activity.
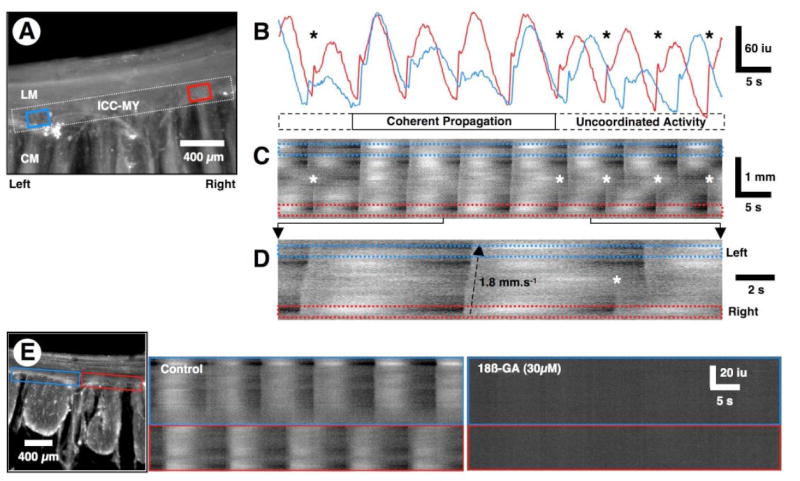
(A) Averaged Ca2+ fluorescence in a cross-sectional preparation. In this preparation, Ca2+ transients were measured only in ICC-MY. An ST map was constructed from the dotted white rectangle covering the ICC-MY network within the FOV. Ca2+ traces were also sampled in the ROIs (blue and red rectangles) near the opposite ends of the ICC-MY network. (B) Line traces taken from the red and blue ROIs in A. Note that pacemaker activity in ICC-MY is entrained and loses entrainment over a series of several cycles and is variable in amplitude with each cycle. (C) The ST map shows instances of propagated rhythmic activity along the entire length of the ICC-MY network (see also D). During the first two and last three cycles, pacemaker activity was not entrained (*) and two independent pacemaker regions emerged with similar frequencies. During the 3rd to 6th cycles, pacemaker activity propagated along the entire ICC-MY network in the FOV. (D) An expanded region of the ST map in C shows propagation across the ICC-MY network during the first two cycles (bottom to top in the ST map) and loss of entrainment of activity during the 3rd cycle (*). (E) ST maps were constructed from each of the blue and red rectangles along the ICC-MY network of the preparation shown on the left. Pacemaker activity in the two regions of the ICC-MY network occurred at similar frequencies, but the activity was out of phase. 18ß-glycyrrhetinic acid (18ß-GA, 30 μM) blocked all activity in the ICC-MY network.
The spread of pacemaker activity along ICC networks (n=6) and activation of muscle bundles (n=2) were abolished by the gap junction blocker 18ß-glycyrrhetinic acid (30 μM) (Figure 5E), suggesting these structures provide low resistance pathways between ICC, and between ICC and muscle for propagation of electrical pacemaker activity.6,11,19,25,26
Alternating pacemaker behavior in ICC networks
The upstroke and plateau phase of pacemaker events in ICC-MY that occurred prematurely in a cycle of activity were of reduced amplitude. This created an alternating pattern of activity in 36.8 % of cross-sectional preparations (n=21 of 57) (Figure 6B, D, and G). During the alternating pattern, ICC-SEP were barely activated during the smaller events (Figure 6F and G), suggesting that there is likely to be a threshold for the activation of ICC-SEP. In extreme situations where the upstroke phase was very premature and occurred during the falling phase of the previous pacemaker event, only a small upstroke phase of the Ca2+ transient was resolved (i.e., there was total inhibition of the plateau phase; see asterisks in Figure 6B and D). Figure 6D shows that two regions of an uncoupled ICC-MY network could also display alternating behavior.
Figure 6. Alternating patterns of pacemaker activity in ICC-MY and ICC-SEP.
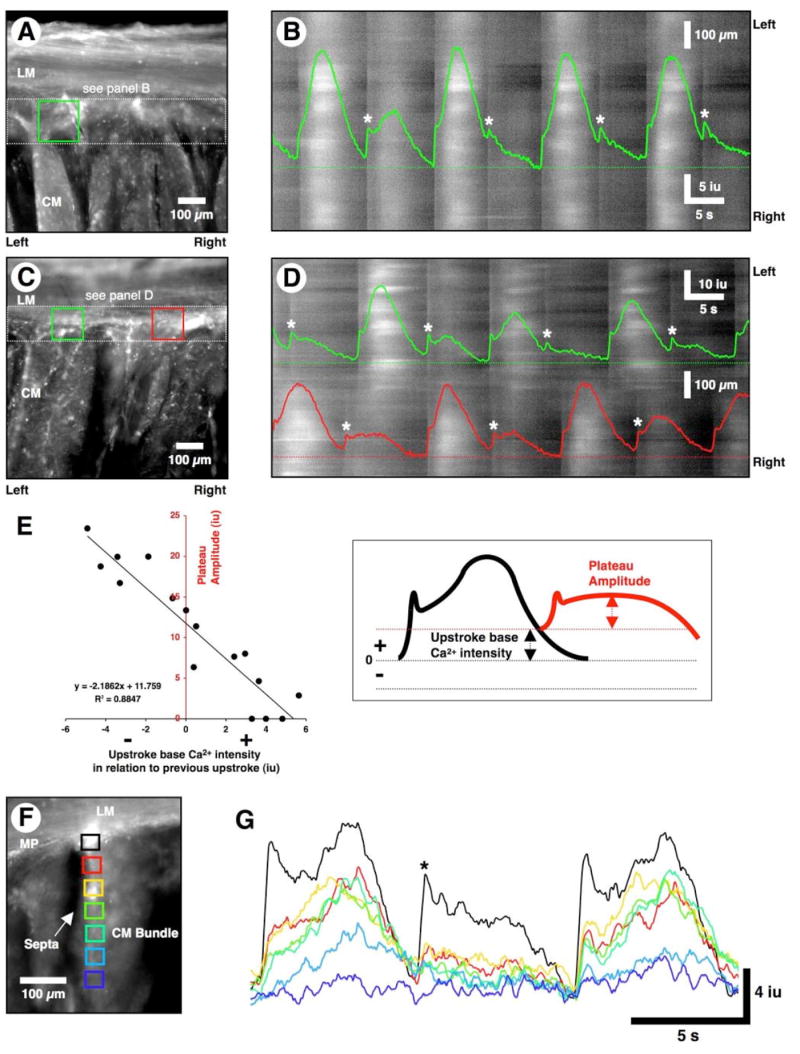
(A, C, and F) Averaged Ca2+ fluorescence in three cross-sectional preparations. (B) An ST map was constructed of ICC-MY activity within the white dotted rectangle in A. A line trace from the green ROI in A is superimposed on the ST map. Large Ca2+ transients were interspersed with small amplitude events. The small amplitude events (*) occurred prematurely, when the preceding Ca2+ transients had not fully relaxed. Premature Ca2+ transients often occurred in the absence of resolvable plateau phases. Small amplitude Ca2+ transients fully relaxed before the next events occurred and this resulted in large-amplitude transients. (D) An ST map was constructed for ICC-MY activity throughout the white dotted rectangle shown in C. Line traces from the green and red ROIs are superimposed on the ST map. Note that the red and green regions are not entrained and both regions display alternating patterns of activity as above (i.e., large amplitude transients interspersed with small amplitude transients (white asterisks). (E) A plot of the relationship between plateau amplitude and the level of Ca2+ restitution following a previous event. If the level of Ca2+ at the initiation of the upstroke phase was elevated following a previous event, then the amplitude of the subsequent Ca2+ transient was reduced, and vice versa. (F) ROIs were selected from the triangular shaped region of ICC-MY network (black square) and down the adjacent ICC-SEP (red to dark blue squares). (G) An alternating pattern of activity in ICC-MY (black trace). During the 2nd cycle, the reduced Ca2+ transient in ICC-MY (black trace) failed to propagate down ICC-SEP (red to dark blue rectangles).
The reduction of the upstroke and plateau phases of premature Ca2+ transients in ICC-MY was related to the residual level of Ca2+ from a preceding Ca2+ transient. If an event occurred before full relaxation of the preceding Ca2+ transient, then the amplitude of both phases of the premature event was reduced (Figure 6D and E). The amplitude of pacemaker events was dependent upon the interval between the relaxation of the Ca2+ transients and upstroke of the succeeding event.
The variation in amplitude of the pacemaker events in ICC-MY was not due to the thickness of the cross-sectional preparations, since it was also observed in 17 of 63 (27.0 %) flat-sheet preparations viewed under higher (x10 or x20) power.
Discussion
In this study, we show that the ICC-MY and ICC-SEP form a complex, three-dimensional conduction system that is necessary for active propagation of slow waves into the thick CM bundles of the human small intestine. The extensive ICC-MY network is morphologically and functionally continuous with the ICC-SEP that line the surface of CM bundles to a distance of at least 52% of the height of a bundle. Although ICC-SEP were morphologically continuous with ICC-MY, activation of ICC-SEP, and consequently CM bundles, was sporadic, and appeared to be related to the amplitude of Ca2+ transients in ICC-MY.
Spontaneous Ca2+ transients in ICC-MY in cross-sectional preparations were similar in waveform to those recorded in flat-sheet preparations, and share the same frequency and waveform characteristic of electrical slow waves.6 Previous studies have shown that the global Ca2+ transients in ICC are a response to slow wave depolarizations and due to the activation of at least two classes of voltage-dependent Ca2+ conductances.7 The Ca2+ transients in ICC-MY and ICC-SEP were typically biphasic, consisting of a rapid upstroke phase followed by a prolonged plateau phase. The upstroke phase appeared to result from Ca2+ influx through T-type, dihydropyridine-resistant voltage gated Ca2+ channels.6 The upstroke propagates rapidly through the ICC-MY and ICC-SEP networks in order to synchronize ICC and initiate the plateau phase. The rate-of-rise and amplitude of the plateau phase depends linearly upon the amplitude of the upstroke phase.6
As pacemaker activity spread from ICC-MY to ICC-SEP, both phases of Ca2+ transients declined in amplitude. The plateau phase, which is necessary for activating the adjacent muscle,6 declined in both amplitude and rate-of-rise in ICC-SEP as a function of distance from the ICC-MY junction. The average rate-of-decline in the amplitude of Ca2+ transients was remarkably similar to the rate-of-decline of slow waves as they propagate into septa between CM bundles in the canine colon.11 However, unlike the small bowel, the ICC-SEP in the colon appear to be continuous with ICC at the submucosal border,11 since this is the site of the primary pacemaker network.10
Most surprisingly, a passing wave of activity in ICC-MY did not consistently activate all ICC-SEP between CM bundles within the FOV. It is possible that the dense triangular areas of ICC at the entrance of ICC-SEP have a threshold that determines whether activity is gated to ICC-SEP or not. It is possible that ICC within this region are not as excitable as ICC within the ICC-MY network. The threshold may depend on the strength of the upstroke phase of the Ca2+ transient that in turn determines the amplitude and rate-of-rise of the plateau phase.6 Therefore, the inconsistent activation of ICC-SEP (and consequently muscle bundles) is probably related to the dynamic nature of the ICC-MY network, where different regions entrain and lose entrainment over time and the source of each pacemaker event within the ICC-MY network is constantly shifting.31 When regions of the ICC-MY network were entrained, pacemaker activity spread smoothly across the whole network within the FOV. When regions lost entrainment, they exhibited similar pacemaker frequencies but the activity occurred out of phase. This suggests that cells in a given region of an ICC-MY network are likely to exhibit a similar intrinsic frequency. Entrainment of pacemaker activity between ICC-MY depends upon the relative excitability and refractory properties of each cell.
Pacemaker activity is ongoing at all times, however, it is not advantageous for all slow waves traversing the ICC-MY network to activate Ca2+ transients (and contractions) in smooth muscle bundles. Inputs from enteric motor neurons may also participate in the gating of slow waves into ICC-SEP.32,33 Ultrastructural studies of the canine antrum, for example, have shown that ICC-SEP are innervated by enteric motor neurons.34 Thus, part of the neural regulation of gastrointestinal muscles, may involve recruitment of muscle bundles, similar to the recruitment of motor units in skeletal muscles, by regulating the efficacy of propagation of slow waves into ICC-SEP and muscle bundles.
Pacemaker activity in ICC-MY often occurred in an alternating pattern, consisting of large amplitude events that alternated with smaller amplitude events. This occurred when the interval between pacemaker events was less than the relative refractory period. As with slow waves,24 neither the upstroke phase nor the plateau phase of Ca2+ transients was an all-or-none event. The amplitude of Ca2+ transients in ICC-MY depended on the level of Ca2+ remaining from the preceding event. If the remaining Ca2+ was high then the subsequent event was smaller in amplitude, whereas, if the inter-transient interval was of sufficient length to allow restitution of basal Ca2+ levels, then the next pacemaker event was of normal or of larger amplitude. The reasons why intracellular Ca2+ causes refractoriness in ICC-MY is unknown. It could be related, in part, to the fact that high intracellular Ca2+ concentrations reduce the availability of the T-type Ca2+ channels underlying the upstroke phase; high Ca2+ concentrations have been shown to shift the I-V curve for T-type Ca2+ current in a positive direction in HEK 293 cells.29 The plateau phase of the Ca2+ transient showed dependence on the size of the upstroke phase.6 Thus, the plateau phase was also dependent upon the residual Ca2+ remaining from the preceding event. It is also possible that elevated Ca2+ may enhance openings of Ca2+-activated K+ conductances, and these channels may reduce excitability of ICC and increase the duration of the relative refractory period. It is also possible that intracellular Ca2+ causes inhibition of the non-selective cation current that underlies pacemaker activity.3,24,30 Refractoriness is also observed in the heart, where the amplitude of premature action potentials and the resulting contractions are reduced in amplitude and force.1 Our studies suggest that the long refractory periods observed for slow waves24 is a consequence of the Ca2+ dynamics in ICC-MY rather than a property of the muscle. In addition, the dissociation of slow waves along the canine small intestine recorded by multiple electrode arrays on the serosal surface27 and the waxing and waning of slow wave activity recorded from the CM of the cat and rabbit small intestine with intracellular microelectrodes28 likely result from dynamic changes in entrainment between regions of the ICC-MY network.
In summary, we show that pacemaker activity spreads through ICC-SEP and facilitates active propagation of slow waves deep into CM bundles. ICC-MY serve as the dominant group of pacemaker cells that can drive ICC-SEP, which by themselves beat at a lower frequency. Pacemaker activity in the ICC-MY network is inherently dynamic, since it can vary in amplitude, propagation length and direction. There appears to be a threshold phenomenon that determines whether activity propagation within ICC-MY will activate a given group of ICC-SEP. This can gate the access of slow wave activity to individual muscle bundles. Consequently, the activation of muscle bundles does not always follow pacemaker activity in ICC-MY in a one-to-one manner. Since the small intestine is not a uni-directional pump and depends upon segmental contractions that are constantly shifting their site of origin and length of contraction, the interactions between ICC-MY and ICC-SEP may be a contributory factor in the generation of the variety of motor patterns that underlie mixing and propulsion during digestion.
Supplementary Material
Movies 1-4 of ICC that are referred to in the text can be found on the following website http://www.unr.edu/physio/facterence.html
Acknowledgments
We thank Dr. Sang Don Koh for his helpful suggestions.
Grant Support: This study was funded by grants from the National Institute of Diabetes and Digestive and Kidney Diseases: RO1 DK45713 (T.K.S.) and program project grant DK41315 (K.M.S.). Imaging was performed in a Core laboratory supported by P20 RR-18751.
Abbreviations
- CM
circular muscle
- FOV
field of view
- ICC-MY
myenteric interstitial cells of Cajal
- ICC-SEP
septal interstitial cells of Cajal
- LM
longitudinal muscle
- ROI
region of interest
- ST
spatiotemporal
Footnotes
“There are no conflicts of interest to disclose”
Publisher's Disclaimer: This is a PDF file of an unedited manuscript that has been accepted for publication. As a service to our customers we are providing this early version of the manuscript. The manuscript will undergo copyediting, typesetting, and review of the resulting proof before it is published in its final citable form. Please note that during the production process errors may be discovered which could affect the content, and all legal disclaimers that apply to the journal pertain.
Contributor Information
Hyun-Tai Lee, Department of Physiology & Cell Biology, University of Nevada School of Medicine, Reno, Nevada 89557, USA.
Grant W. Hennig, Department of Physiology & Cell Biology, University of Nevada School of Medicine, Reno, Nevada 89557, USA
Neal W. Fleming, Department of Anesthesiology, University of California Davis Medical Center, Sacramento, California 95817, USA
Kathleen D. Keef, Department of Physiology & Cell Biology, University of Nevada School of Medicine, Reno, Nevada 89557, USA
Nick J. Spencer, Department of Physiology & Cell Biology, University of Nevada School of Medicine, Reno, Nevada 89557, USA
Sean M. Ward, Department of Physiology & Cell Biology, University of Nevada School of Medicine, Reno, Nevada 89557, USA
Kenton M. Sanders, Department of Physiology & Cell Biology, University of Nevada School of Medicine, Reno, Nevada 89557, USA
Terence K. Smith, Department of Physiology & Cell Biology, University of Nevada School of Medicine, Reno, Nevada 89557, USA
References
- 1.Berne RM, Levy MN. The cardiovascular system. In: Berne RM, Levy MN, editors. Physiology. 3. St. Louis: Mosby; 1993. pp. 382–385.pp. 461 [Google Scholar]
- 2.Murphy RA. Muscle. In: Berne RM, Levy MN, editors. Physiology. 3. St. Louis: Mosby; 1993. pp. 281–291. [Google Scholar]
- 3.Sanders KM, Koh SD, Ward SM. Interstitial cells of Cajal as pacemakers in the gastrointestinal tract. Annu Rev Physiol. 2006;68:307–343. doi: 10.1146/annurev.physiol.68.040504.094718. [DOI] [PubMed] [Google Scholar]
- 4.Edwards FR, Hirst GDS. An electrical description of the generation of slow waves in the antrum of the guinea-pig. J Physiol. 2005;564:213–232. doi: 10.1113/jphysiol.2004.077123. [DOI] [PMC free article] [PubMed] [Google Scholar]
- 5.Farrelly AM, Ro S, Callaghan BP, Khoyi MA, Fleming N, Horowitz B, Sanders KM, Keef KD. Expression and function of KCNH2 (HERG) in the human jejunum. Am J Physiol. 2003;284:G883–G895. doi: 10.1152/ajpgi.00394.2002. [DOI] [PubMed] [Google Scholar]
- 6.Lee HT, Hennig GW, Fleming NW, Keef KD, Spencer NJ, Ward SM, Sanders KM, Smith TK. The mechanism and spread of pacemaker activity through myenteric interstitial cells of Cajal in human small intestine. Gastroenterology. 2007;132:1852–1865. doi: 10.1053/j.gastro.2007.02.049. [DOI] [PubMed] [Google Scholar]
- 7.Park KJ, Hennig GW, Lee HT, Spencer NJ, Ward SM, Smith TK, Sanders KM. Spatial and temporal mapping of pacemaker activity in interstitial cells of Cajal in mouse ileum in situ. Am J Physiol. 2006;290:C1411–C1427. doi: 10.1152/ajpcell.00447.2005. [DOI] [PubMed] [Google Scholar]
- 8.Bauer AJ, Sarr MG, Szurszewski JH. Opioids inhibit neuromuscular transmission in circular muscle of human and baboon jejunum. Gastroenterology. 1991;101:970–976. doi: 10.1016/0016-5085(91)90723-x. [DOI] [PubMed] [Google Scholar]
- 9.Stark ME, Bauer AJ, Sarr MG, Szurszewski JH. Nitric oxide mediates inhibitory nerve input in human and canine jejunum. Gastroenterology. 1993;104:398–409. doi: 10.1016/0016-5085(93)90407-4. [DOI] [PubMed] [Google Scholar]
- 10.Smith TK, Reed JB, Sanders KM. Interaction of two electrical pacemakers in muscularis of canine proximal colon. Am J Physiol. 1987;252:C290–C299. doi: 10.1152/ajpcell.1987.252.3.C290. [DOI] [PubMed] [Google Scholar]
- 11.Ward SM, Sanders KM. Pacemaker activity in septal structures of canine colonic circular muscle. Am J Physiol. 1990;259:G264–G273. doi: 10.1152/ajpgi.1990.259.2.G264. [DOI] [PubMed] [Google Scholar]
- 12.Horiguchi K, Semple GSA, Sanders KM, Ward SM. Distribution of pacemaker function through the tunica muscularis of the canine gastric antrum. J Physiol. 2001;537:237–250. doi: 10.1111/j.1469-7793.2001.0237k.x. [DOI] [PMC free article] [PubMed] [Google Scholar]
- 13.Torihashi S, Ward SM, Sanders KM. Development of c-Kit-positive cells and the onset of electrical rhythmicity in murine small intestine. Gastroenterology. 1997;112:144–155. doi: 10.1016/s0016-5085(97)70229-4. [DOI] [PubMed] [Google Scholar]
- 14.Hennig GW, Hirst GDS, Park KJ, Smith CB, Sanders KM, Ward SM, Smith TK. Propagation of pacemaker activity in the guinea-pig antrum. J Physiol. 2004;556:585–599. doi: 10.1113/jphysiol.2003.059055. [DOI] [PMC free article] [PubMed] [Google Scholar]
- 15.Gabella G. Arrangement of smooth muscle cells and intramuscular septa in the taenia coli. Cell Tissue Res. 1977;184:195–212. doi: 10.1007/BF00223068. [DOI] [PubMed] [Google Scholar]
- 16.Tomita T. Spread of excitation in smooth muscle. Prog Clin Biol Res. 1990;327:361–373. [PubMed] [Google Scholar]
- 17.Spencer NJ, Hennig GW, Smith TK. Electrical rhythmicity and spread of action potentials in longitudinal muscle of guinea pig distal colon. Am J Physiol. 2002;282:G904–G917. doi: 10.1152/ajpgi.00345.2001. [DOI] [PubMed] [Google Scholar]
- 18.Stevens RJ, Publicover NG, Smith TK. Induction and organization of Ca2+ waves by enteric neural reflexes. Nature. 1999;399:62–66. doi: 10.1038/19973. [DOI] [PubMed] [Google Scholar]
- 19.Hennig GW, Smith CB, O’Shea DM, Smith TK. Patterns of intracellular and intercellular Ca2+ waves in the longitudinal muscle layer of the murine large intestine in vitro. J Physiol. 2002;543:233–253. doi: 10.1113/jphysiol.2002.018986. [DOI] [PMC free article] [PubMed] [Google Scholar]
- 20.Tack J, Smith TK. Calcium imaging of gut activity. Neurogastroenterol Motil. 2004;16:86–95. doi: 10.1111/j.1743-3150.2004.00481.x. [DOI] [PubMed] [Google Scholar]
- 21.Kubota M, Kanda E, Ida K, Sakakihara Y, Hayashi M. Severe gastrointestinal dysmotility in a patient with congenital myopathy: causal relationship to decrease of interstitial cells of Cajal. Brain Dev. 2005;27:447–450. doi: 10.1016/j.braindev.2004.10.006. [DOI] [PubMed] [Google Scholar]
- 22.Vanderwinden JM, Rumessen JJ. Interstitial cells of Cajal in human gut and gastrointestinal disease. Microsc Res Tech. 1999;47:344–360. doi: 10.1002/(SICI)1097-0029(19991201)47:5<344::AID-JEMT6>3.0.CO;2-1. [DOI] [PubMed] [Google Scholar]
- 23.Lee JI, Park H, Kamm MA, Talbot IC. Decreased density of interstitial cells of Cajal and neuronal cells in patients with slow-transit constipation and acquired megacolon. J Gastroenterol Hepatol. 2005;20:1292–1298. doi: 10.1111/j.1440-1746.2005.03809.x. [DOI] [PubMed] [Google Scholar]
- 24.Publicover NG, Sanders KM. Effects of frequency on the wave form of propagated slow waves in canine gastric antral muscle. J Physiol. 1986;371:179–189. doi: 10.1113/jphysiol.1986.sp015967. [DOI] [PMC free article] [PubMed] [Google Scholar]
- 25.Davidson JS, Baumgarten IM. Glycyrrhetinic acid derivatives: a novel class of inhibitors of gap-junctional intercellular communication. Structure-activity relationships. J Pharmacol Exp Ther. 1988;246:1104–1107. [PubMed] [Google Scholar]
- 26.Yamamoto Y, Fukuta H, Nakahira Y, Suzuki H. Blockade by 18ß-glycyrrhetinic acid of intercellular electrical coupling in guinea-pig arterioles. J Physiol. 1998;511:501–508. doi: 10.1111/j.1469-7793.1998.501bh.x. [DOI] [PMC free article] [PubMed] [Google Scholar]
- 27.Lammers WJEP, Ver Donck L, Schuurkes JAJ, Stephen B. Peripheral pacemakers and patterns of slow wave propagation in the canine small intestine in vivo. Can J Physiol Pharmacol. 2005;83:1031–1043. doi: 10.1139/y05-084. [DOI] [PubMed] [Google Scholar]
- 28.Suzuki N, Prosser CL, DeVos W. Waxing and waning of slow waves in intestinal musculature. Am J Physiol. 1986;250:G28–G34. doi: 10.1152/ajpgi.1986.250.1.G28. [DOI] [PubMed] [Google Scholar]
- 29.Lacinová L, Kurejová M, Klugbauer N, Hofmann F. Gating of the expressed T-type Cav3.1 calcium channels is modulated by Ca2+ Acta Physiol. 2006;186:249–260. doi: 10.1111/j.1748-1716.2006.01539.x. [DOI] [PubMed] [Google Scholar]
- 30.Koh SD, Jun JY, Kim TW, Sanders KM. A Ca2+-inhibited non-selective cation conductance contributes to pacemaker currents in mouse interstitial cell of Cajal. J Physiol. 2002;540:803–814. doi: 10.1113/jphysiol.2001.014639. [DOI] [PMC free article] [PubMed] [Google Scholar]
- 31.Publicover NG, Sanders KM. A technique to locate the pacemaker in smooth muscles. J Appl Physiol. 1984;57:1586–1590. doi: 10.1152/jappl.1984.57.5.1586. [DOI] [PubMed] [Google Scholar]
- 32.Smith TK, Reed JB, Sanders KM. Electrical pacemakers of the canine proximal colon are functionally innervated by inhibitory motor neurons. Am J Physiol. 1989;256:C466–C477. doi: 10.1152/ajpcell.1989.256.3.C466. [DOI] [PubMed] [Google Scholar]
- 33.Sanders KM, Smith TK. Enteric neural regulation of slow waves in the circular muscle of the canine proximal colon. J Physiol. 1986;377:297–313. doi: 10.1113/jphysiol.1986.sp016188. [DOI] [PMC free article] [PubMed] [Google Scholar]
- 34.Horiguchi K, Sanders KM, Ward SM. Enteric motor neurons form synaptic-like junctions with interstitial cells of Cajal in the canine gastric antrum. Cell Tissue Res. 2003;311:299–313. doi: 10.1007/s00441-002-0657-1. [DOI] [PubMed] [Google Scholar]
Associated Data
This section collects any data citations, data availability statements, or supplementary materials included in this article.
Supplementary Materials
Movies 1-4 of ICC that are referred to in the text can be found on the following website http://www.unr.edu/physio/facterence.html