Figure 3.
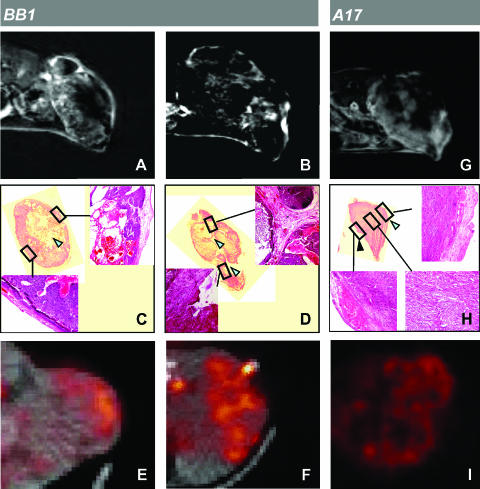
Mapping of perfusion and metabolic patterns in transplanted tumors. On BB1 tumors, third postcontrast minus precontrast images after Gd-DTPA injection showed enhancement at the tumor periphery, typical of carcinomas (A), or, less frequently, in restricted regions of the intratumoral parenchyma (B). On histologic analysis, the peripheral areas of enhancement matched peritumoral capsule and an epithelial subcapsular layer. MRI enhancement showed discontinuities in correspondence with necrotic areas (C) and, inside the tumor parenchyma, roughly matched large intratumoral stromal septa (D; arrowhead). The surrounding epithelial parenchyma showed progressively lower cellular density as distance from intratumoral connectival septa increased. FDG uptake showed a complementary pattern to Gd-DTPA distribution (E and F). Corresponding CT images were overlapped on PET images to allow tumor delineation. On A17 tumors, third postcontrast minus precontrast images after Gd-DTPA injection showed evident—although inhomogeneous—intratumoral enhancement (G). On histologic analysis (H), tumor parenchyma proved homogeneous from the periphery to the core with only a small focus of necrosis (black arrowhead) and did not exhibit a stromal capsule except at the external side, where tumor invaded the skin (cyan arrowheads). FDG uptake exhibited an inhomogeneous pattern (I) that is roughly complementary to MRI tracer enhancement.

