Abstract
Determination of HIV infectivity in vitro and its inhibition by antiretroviral drugs by monitoring reduction of production of p24 antigen is expensive and time consuming. Such assays also do not allow accurate quantitation of the number of infected cells over time. To develop a simple, rapid, and direct method for monitoring HIV infection, we generated a stable T-cell line (CEM) containing a plasmid encoding the green fluorescent protein (humanized S65T GFP) driven by the HIV-1 long terminal repeat. Clones were selected that displayed low constitutive background fluorescence, but a high level of GFP expression upon infection with HIV. HIV-1 infection induced a 100- to 1,000-fold increase in relative fluorescence of cells over 2 to 4 days as monitored by fluorescence microscopy, cytofluorimetry, and flow cytometry. Addition of inhibitors of reverse transcriptase, protease, and other targets at different multiplicities of infection permitted the accurate determination of drug susceptibility. This technique also permitted quantitation of infectivity of viral preparations by assessment of number of cells infected in the first round of infection. In conclusion, the CEM-GFP reporter cell line provides a simple, rapid, and direct method for monitoring HIV infectivity titers and antiretroviral drug susceptibility of syncytium-inducing strains.
Keywords: green fluorescent protein, antiretroviral
The syncytial focus plaque assay or the production of the HIV-1 p24 core antigen by ELISA are used to titer HIV infectivity, monitor the progress of infection, and determine drug susceptibility in T-cell lines (1). These methodologies are time consuming. Furthermore p24 antigen determinations are expensive and do not allow a precise quantitation of the number of infected cells. Other techniques have been developed to detect HIV infection, including cell viability assays, reverse transcriptase assays, visualization of virions by electron microscopy, in situ hybridization, and various PCR-based assays (1, 2). More recently, reporter system assays have been engineered for expressing genes such as firefly luciferase (3, 4), chloramphenicol acetyltransferase (CAT) (5, 6) and β-galactosidase (β-gal) (7) coupled to the HIV-1 long terminal repeat (LTR) promoter. However, these different techniques require measurement of aggregate production in the culture cells (CAT, p24 antigen), fixation of cells and exogenous substrates (β-gal), or killing of the cells (CAT, luciferase, and PCR). A simple, economical, and direct method for monitoring HIV infection in cell culture allowing rapid and accurate determination of the activity of antiretroviral drugs was sought.
The green fluorescent protein (GFP) of the bioluminescent jellyfish Aequorea victoria is a marker for gene expression with several promising features: small size of 238 amino acids, heat stability, and emission of green light after exposure to ultraviolet light without extrinsic labeling or fixation (8–10). In addition, GFP requires no cofactor and lacks apparent toxicity for eukaryotic cells. Relatively high levels of GFP expression are required for bright fluorescence, because each GFP molecule represents one fluorophore, and up to 106 molecules per cell are needed (11). This may explain why GFP-expressing stable cell lines have not yet been established and why detectable bright fluorescence signals were obtained only transiently in T-cell lines transfected with high amount of GFP-encoding plasmid (12, 13) or used as fusion protein tag (14, 15). Continuous high production of GFP appears to be required for signal detection, a situation analogous to viral production. Variants of GFP have been designed that are better adapted to mammalian expression and to present technologies of signal detection. The S65T GFP contains an amino acid substitution (Ser65 to Thr), which shifts the peak fluorescence of emission of GFP to 511 nm (16). The gene for this modified GFP molecule has been further improved to optimize the sequence to human codon-usage preference and to provide a Kozak sequence motif for better ribosome binding.
We report the establishment of a stable T-cell line expressing a plasmid encoding a humanized enhanced GFP under the control of a HIV-1 LTR promoter. Upon infection with HIV-1, we observed a 100- to 1,000-fold increase of fluorescence of infected cells, compared with uninfected cells. This technique enabled monitoring of HIV infection in real time, quantitation of infected cells over time, and determination of antiretroviral drug susceptibility easily and accurately.
MATERIALS AND METHODS
Construction of Plasmid pLTR-GFP.
The plasmid pEGFP-1 (CLONTECH) encodes a human codon-optimized S65T GFP downstream of a multiple cloning site. HIV-1 LTR derived from the NL4–3 strain was amplified by PCR using the following set of primers: forward, 5′-CGCACGCGTTGGAAGGGCTAATTTGGTCCC-3′; reverse, 5′-AGACCCGGGTGCTAGAGATTTTCCACACTG-3′ with the following parameters: 94°C for 45 s, then 30 cycles with denaturation step at 94°C for 30 s, hybridization 45°C for 30 s, and elongation at 72°C for 45 s with a final elongation at 72°C for 7 min. The PCR fragment of 632 bp was subsequently digested with HindIII to get a final LTR fragment of 530 bp and inserted between the BglII and HindIII sites in the pEGFP-1 upstream of the GFP initiation codon. The resulting plasmid (pLTR-GFP) was grown in Escherichia coli, strain DH5 alpha, purified by centrifugation on CsCl gradients (17) and electroporated in the lymphoblastoid CD4+ T-cell line CEM, obtained from Dennis Carson (University of California San Diego).
CEM cells electroporated with pLTR-GFP were selected for neomycin resistance (G418: 800 μg/ml) in medium containing RPMI medium 1640 (GIBCO/BRL) supplemented with 2 mM glutamine, 100 units/ml penicillin G, 100 μg/ml streptomycin, and 10% (vol/vol) fetal bovine serum, and referred to as CEM-GFP.
Selection of Clonal Populations of CEM-GFP.
After G418 selection, CEM-GFP cells were analyzed by flow cytometry (Coulter Elite fluorescence-activated cell sorter) using an excitation wavelength of 488 nm and detection at the emission wavelength of 530 nm. The cells with high constitutive GFP expression (about 25%) were removed. The remaining CEM-GFP cells with low levels of background fluorescence were cloned by three rounds of limiting dilution and further selected for high GFP expression upon infection with HIV-1.
HIV-1 Infection of CEM-GFP Cells and Determination of Antiretroviral Drug Susceptibility.
CEM-GFP cells were infected with the T-cell tropic strain HIV-1LAI (5 × 10⁶ TCID50/ml, titered by terminal dilution and p24 antigen production on parental CEM cells) (18) at different multiplicities of infection (MOIs) for 4 h at 37°C in the presence of 2 μg/ml Polybrene. The cells then were washed three times with PBS (GIBCO/BRL), resuspended in 2 ml of culture medium and incubated at 37°C in 5% CO2. Aliquots of 2.0 × 10⁵ cells were taken at days 1, 2, 3, 4, or 6 and fixed in 1% formaldehyde (Polysciences) in PBS. The cells were transferred to a 96-well low fluorescence plate (PerSeptive Biosystems, Framingham, MA). Fluorescence was measured using a fluorimeter (Cytofluor 2300 PerSeptive Biosystems) at an excitation wavelength of 485 nm and an emission wavelength of 530 nm. The cells also were analyzed either by flow cytometry or visualized under a fluorescence microscope (Nikon). Two hundred microliters of medium containing infected cells were used in parallel for measurement of the production of HIV-1 p24 antigen by antigen capture ELISA test (Coulter). In some experiments, antiretroviral drugs at different concentrations were added 1 h before infection (3 h for zidovudine) and maintained for the duration of the experiment.
Labeling of HIV-1-Infected CEM-GFP with Anti-gp120 Antibody.
CEM-GFP cells were infected with HIV-1LAI strain at a MOI of 0.001TCID50 per milliliter. At days 1 to 6 after infection, 2 × 10⁵ cells were harvested from the culture, centrifuged 2 min at 2,000 × g, and incubated for 30 min at 4°C in the presence of 1 μg/ml of mouse anti-gp120 mAbs (Hybridoma 902 recognizing the V3 loop; obtained through the AIDS Research and Reference Reagent Program, Division of AIDS, National Institute of Allergy and Infectious Diseases, National Institutes of Health, from Bruce Chesebro) (19, 20). The cells then were washed three times with PBS containing 0.2% BSA and 0.1% Na-azide, resuspended with 20 μl of a 1:50 diluted anti-mouse IgG labeled with phycoerythrin (Boehringer-Mannheim), and incubated 30 min at 4°C. The cells were washed and fixed in 1% formaldehyde/PBS and analyzed by flow cytometry gating for green (GFP) and red (anti-gp120) fluorescence (Coulter, Cellquest software).
RESULTS
Infection of CEM-GFP Cell Line by HIV-1.
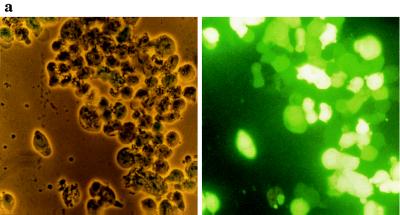
GFP expression induced by the production of the HIV-1 transactivating protein tat was monitored by three different methods (Fig. 1) in HIV-1-infected CEM-GFP cell lines. The microphotograph in Fig. 1a depicts CEM-GFP cells 4 days after infection with HIV-1LAI at a MOI of 0.01. The left panel shows the cell line with inverted light microscopy. The right panel represents the same cells visualized by fluorescence microscopy where more than 90% of the cells expressed high-level fluorescence.
Figure 1.
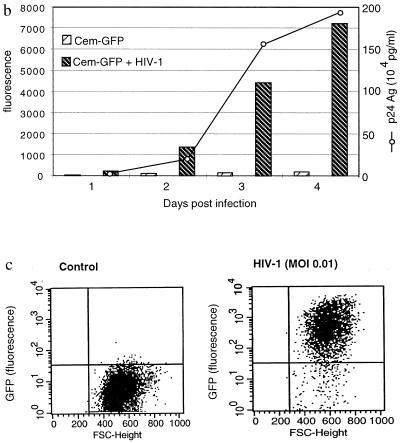
GFP expression in CEM-GFP cell line infected by HIV-1. (a) CEM-GFP cells 4 days after HIV-1 challenge at an input MOI of 0.01. CEM-GFP cells were visualized by conventional light-inverted microscopy (Left) and by fluorescence microscopy (Right). (b) Relative linear fluorescence quantification of 2 × 10⁵ CEM-GFP inoculated with HIV-1 at day 1, 2, 3, and 4 after infection (MOI 0.01). Cytofluorimetry was performed with an excitation wavelength of 485 nm and an emission wavelength of 508 nm, sensitivity 6. Parallel determination of the production of p24 antigen of infected cells by antigen capture ELISA test. (c) Analysis and enumeration of fluorescent CEM-GFP cells 4 days after infection with a MOI of 0.01 by flow cytometry.
To quantify the fluorescence emitted by these infected cells, 2 × 10⁵ cells were harvested and transferred to a 96-well plate for measurement of total fluorescence with a cytofluorimeter. Fluorescence of HIV-infected cells progressively increased over time (Fig. 1b). This increase reached a maximum of 2 log10 relative fluorescence intensity over noninfected cells at day 4. Production of p24 antigen also was monitored in parallel and correlated with relative fluorescence emission. The number of fluorescent cells and the shift of fluorescence in HIV-1-infected cells were analyzed by flow cytometry at day 4 (Fig. 1c). This technique confirmed that over 90% of cells after several cycles of HIV-1 replication had a 2 log10 increase in relative fluorescence intensity compared with uninfected cells.
Correlation of Expression of HIV-1 gp120 and GFP.
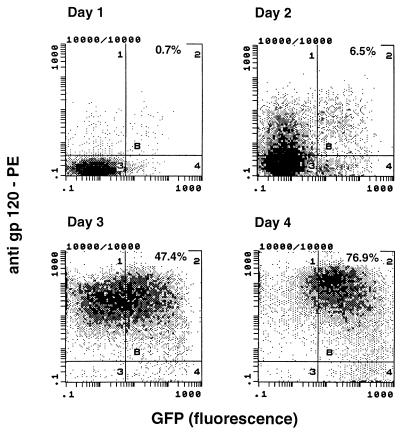
The HIV-1 LTR can be activated by different cytokines and transcriptional activators like tumor necrosis factor-α, interleukin 1 (IL-1), IL-2, IL-6, and NFκB (21–23). These effectors increased GFP transcription up to 4-fold only. We examined LTR-driven GFP expression achieved through non-tat-mediated activation of CEM-GFP. For this purpose, the cells were incubated with tumor necrosis factor-α (100 units/ml), phorbol 12-myristate 13-acetate (10–100 ng/ml), or both. CEM-GFP displayed a 2-fold, 3-fold, and 3.5-fold increase of fluorescence, respectively as compared with over 100-fold with HIV infection (data not shown). To confirm that high expression of GFP in the inoculated CEM-GFP cells was due to HIV-1 infection and presumably tat transactivation of the LTR, we infected CEM-GFP cells with HIV-1LAI strain at a MOI of 0.001 and then labeled with anti-gp120 antibodies coupled with phycoerythrin at days 1 through 4. These cells were subsequently analyzed by flow cytometry gating on green and red channels, respectively. Cells inoculated with HIV-1 are rapidly and selectively shifted toward gp120 positivity over time (95% at day 4) (Fig. 2). The signal for GFP is detectable with a short delay of about 1 day. The most likely explanation for the delay between reactivity for gp120 and GFP probably is attributable to the sensitivity of the detection methods for gp120 and GFP. About 106 molecules of GFP are necessary for detection in a cell (11), whereas detection of gp120 is done by amplification of the signal using a mouse anti-gp120 mAb revealed by a phycoerythrin-labeled goat anti-mouse secondary antibody. It is also possible that newly produced virions could label uninfected CD4-expressing CEM cells before replication could induce GPF expression (24). Of note, only a few cells (<5%) expressed the GFP without being positive for gp120 (lower right quadrant of Fig. 2). To determine that productive infection was required for GFP expression, we used psoralen-UV light-inactivated HIV-1 from the same virus stock. These inactivated viruses retain antigenicity, bind to the cell surface receptors, and enter the cells, but are unable to replicate (25). Under these experimental conditions, using equivalent input as assessed by p24, no GFP was produced by CEM-GFP cells inoculated with inactivated-virus (data not shown).
Figure 2.
Comparative analysis of HIV-1 gp120 antigen and GFP expression in CEM-GFP cells infected with HIV-1 (MOI. 0.01). CEM-GFP inoculated with HIV-1 were incubated with mouse mAb against HIV-1 gp120 followed by a goat anti-mouse IgG antibody labeled with phycoerythrin at days 1 to 4 after infection. Cells were analyzed by flow cytometry gating for green (GFP) and red (anti-gp120).
Determination of Antiretroviral Activity of Reverse Transcriptase and Protease Inhibitors with CEM-GFP Cells.
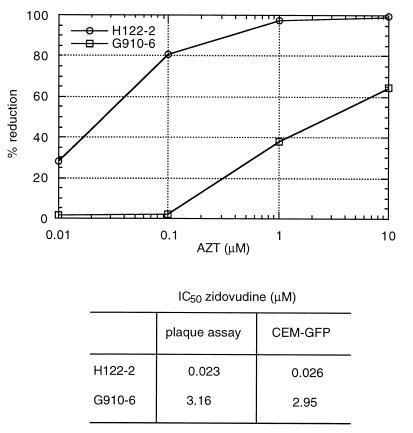
CEM-GFP cells (5 × 10⁵) were incubated for 3 h at 37°C with different concentrations of zidovudine (10, 1, 0.1, and 0.01 μM) before infection at a MOI of 0.1 with two T-cell tropic strains of HIV-1: A patient isolate (H112–2) sensitive to zidovudine with an IC50 of 0.023 μM as determined by HeLa-CD4 plaque assay and a zidovudine-resistant isolate (G910–6) later obtained from the same patient with an IC50 of 3.16 μM (26). An aliquot of 2 × 10⁵ cells for each condition was harvested 4, 6, and 8 days after infection and fixed in 1% formaldehyde in PBS. Fluorescence was quantified by cytofluorimetry (Fig. 3). IC50 values (0.026 μM for H112–2 and 2.95 μM for G910–6) were equivalent to those determined by the HeLa-CD4 plaque assay and by the reduction in p24 antigen production (1).
Figure 3.
Zidovudine susceptibility of the HIV-1 strains H112–2; zidovudine sensitive and its isogenic counterpart (G910–6) using cytofluorimetric measurements of infected cells obtained at days 4, 6 and 8 after infection (Upper). Cells were infected at a MOI of 0.1. The IC50 values as determined by plaque reduction in HeLa-CD4 cells and CEM-GFP assays are provided for comparison (Lower).
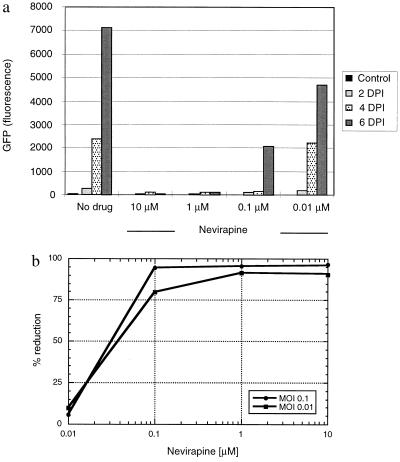
Similar experiments were performed with the nonnucleoside reverse-transcriptase inhibitor, nevirapine, to determine the IC50 of this drug with CEM-GFP cells. The nevirapine susceptibility of HIV-1 in these cells correlated closely with values obtained by plaque assay and p24 antigen reduction (Fig. 4) (27).
Figure 4.
GFP expression of CEM-GFP challenged with HIV-1 at an input MOI of 0.1 in the presence of multiple concentrations (10 μM, 1 μM, 0.1 μM, and 0.01 μM) of the nonnucleoside reverse transcriptase inhibitor nevirapine. (a) Fluorescence measurement performed by cytofluorimetry (excitation wavelength 485 nm, emission wavelength 508 nm, sensitivity 6). DPI: days postinfection. (b) Determination of the IC50 of the nonnucleoside reverse transcriptase inhibitor nevirapine, using the results of a.
The activity of other antiretroviral drugs was evaluated in CEM-GFP cells, including compounds targeted to tat (Ro24–7429, Roche Diagnostics) (21, 28), gag transport by cyclophilin (SDZ811, Sandoz Pharmaceuticals) (29), and the protease inhibitor saquinavir (Roche Diagnostics). All these compounds could be used in the CEM-GFP cell assay with values equivalent to assays using p24 antigen reduction (results not shown).
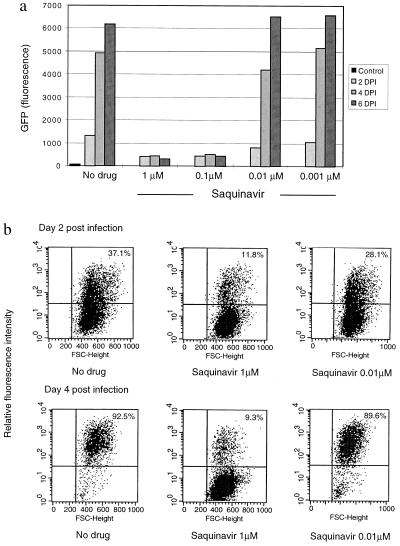
HIV protease inhibitors like saquinavir block only the late steps of maturation of new virions in HIV-infected cells. Under these conditions, tat is produced, and the CEM-GFP assay registered the first round of incoming virus, but not subsequent cycles of infection, because the progeny virions are noninfectious. This is illustrated in Fig. 5a where, with a concentration of saquinavir of 0.1 μM, the level of fluorescence remained constant over a 6-day period and reflected the initial MOI. Flow cytometric analysis confirmed that about 10% of the cells were positive when infected with a MOI of 0.1 (Fig. 5b) and 1% in samples with a MOI of 0.01 (data not shown). Moreover, this percentage of fluorescent cells did not significantly change over a 6-day period in samples where the concentration of saquinavir was ≥0.1 μM, implying that infected cells did not produce new infectious virions at these drug concentrations. In contrast, in samples in which the saquinavir concentration was <0.1 μM, the number of fluorescent cells increased with time demonstrating viral escape and infection of new target cells. Of note, at high MOI (>0.1), a decrease in fluorescence was observed at later timepoints, because infected CEM-GFP are killed by virus-induced apoptosis (30).
Figure 5.
GFP expression of cells challenged with HIV in the presence of the protease inhibitor, saquinavir. (a) Fluorescence measurement by cytofluorimetry of CEM-GFP challenged with HIV-1 at an input MOI of 0.1 in the presence of multiple concentrations (1 μM, 0.1 μM, 0.01 μM, and 0.001 μM) of saquinavir. (b) HIV-challenged CEM-GFP cells incubated with 1 μM of saquinavir were also analyzed by flow cytometry. The percentage in the upper right quadrant indicates the proportion of cells infected in one round of infection.
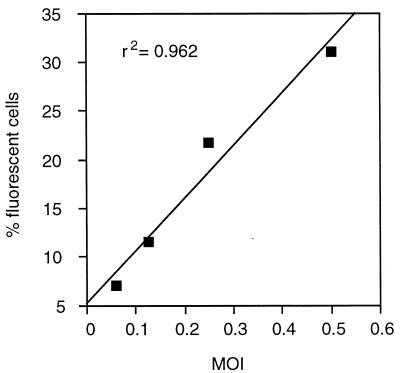
The CEM-GFP reporter system permitted the rapid determination of viral infectivity of virus preparations, because visualization and enumeration of fluorescent cells can be done for only one round of infection using a potent protease inhibitor. HIV-1LAI infection at MOIs of 0.06, 0.1, and 0.25 as titered by plaque assay on CEM cells resulted in 6.0, 11.5, and 21.7% of fluorescent cells, respectively (Fig. 6). At higher MOIs (≥0.5), the correlation was decreased possibly due to differential replication in different cell cycle phases and induction of apoptosis in HIV-infected cells. Experiments with other viral preparations (MN, HIV-2, and clinical isolates) gave similar results.
Figure 6.
Determination of viral infectivity titer. CEM-GFP were incubated at MOI of 0.06, 0.125, 0.25, and 0.5 with HIV-1LAI (titered on CEM cells by plaque assay) in the presence of 1 μM of saquinavir for 2 days. Cells were analyzed by flow cytometry.
DISCUSSION
Monitoring of HIV infection and antiretroviral drug activity in vitro are commonly performed by detecting p24 HIV core antigen production by infected cells or by HeLa-CD4 plaque assay. These methodologies, however, require multiple manipulations, are time consuming, and for p24 antigen are expensive. Furthermore, the p24 assay measures aggregate production of viral proteins from the cultured cells and do not permit an accurate quantitation of the number of infected cells. Assays of cytotoxicity that measure tetrazolium reduction have a similar limitation (31).
The reporter cell line CEM-GFP allows monitoring of GFP expression by three complementary methods. Fluorescence microscopy enables visualization and numeration of fluorescent cells over time (Fig. 1a). Quantification of relative fluorescence using a cytofluorimeter enables the quantitative measurement of cumulative infection in a microtiter plate format (Fig. 1b). Flow cytometry combines enumeration and intensity of relative fluorescence of individual cells (Fig. 1c). The T-cell tropic strains of HIV-1 or HIV-2 and transient cotransfection with a plasmid encoding the HIV-1 transactivating tat protein were all capable to shift CEM-GFP fluorescence 2 to 3 log10 over basal level (not shown). The time to this increase was shown to be dependent on the viral inoculum. CEM-GFP cells challenged with HIV-1 at different MOI ranging from 0.1 to 0.001 revealed a significant increase of fluorescence (>10×) even in samples where only 20 virions were initially inoculated (2 × 10⁵ cells, MOI 0.001 at day 6). Letting the initial inoculum spread in the culture permitted the detection of low-input inocula. This technique compared favorably to standard methodologies as exemplified by the proportionality of p24 core level assessment and fluorescence emission in HIV-infected cells (Fig. 1b). The parallel increase of p24 and fluorescence in cells suggested that HIV replication is likely to be responsible for the LTR-driven GFP expression. However, previous studies have provided evidence that the HIV-1 LTR promoter can be activated by substances such as phorbol 12-myristate 13-acetate and tumor necrosis factor-α, through the activation of the NF-κB binding sites present within the HIV-1 LTR (21–23). To further investigate the role of viral transcription in GFP expression, we used a UV-psoralen light-inactivated strain of HIV-1 to challenge the cells. Under these experimental conditions, no increase in fluorescence expression was detected, confirming the necessity of viral replication for GFP expression. Additionally, expression of HIV-1 gp120 protein on the cell surface also correlated with the increase in GFP expression.
Potential applications of the CEM-GFP reporter system include high throughput assays for anti-HIV drug susceptibility testing or neutralization assays. The method is fast (from 1 to 6 days depending on inoculum), easy (direct fluorescence measurement of HIV-challenged cells by cytofluorimetry), and inexpensive (essentially maintenance of the cells). The 96-well plate format permits the assay of multiple drugs at a range of concentrations. The feasibility of performing drug assays for reverse transcriptase, gag, tat, and protease inhibitors with results comparable to those obtained by p24 assay and HeLa-CD4 plaque assay has been demonstrated. Furthermore, analysis of two isolates, one sensitive and the other highly resistant to zidovudine obtained from the same individual before and after therapy, demonstrated the capability to discern drug susceptibility with clinical isolates.
The CEM-GFP reporter system also permits the rapid determination of viral infectivity titers. The percentage of CEM-GFP infected in the presence of inhibitory concentrations of an anti-HIV protease drug (1 μM of the protease inhibitor saquinavir, for example) defines the number of cells infected in the first round of infection. We observed that about 10% and 1% of the CEM-GFP cells were fluorescent when MOI 0.1 (i.e., 1 virus per 10 cells) and 0.01 (i.e. 1 virus per 100 cells) were used, respectively. The same percentage of fluorescent cells persisted throughout the experiment, because no production of infectious mature virions and subsequent infection of cells can occur in these conditions. The possibility to titer infectivity of multiple viral preparations with the CEM-GFP assay was confirmed by good correlations with plaque assay, using MOIs ranging from 0.05 to 0.25 (TCID50 per cell).
This reporter system may be enhanced by providing the CCR-5 receptor to CEM-GFP, allowing non-syncytium-inducing isolates (NSI) to infect them. Chemokine receptors have been shown to be mandatory coreceptors for HIV entry (32). CCR-5, a member of the seven-transmembrane G-protein receptor family, is present at the surface of primary CD4+ T cells and monocytes permitting primary NSI isolates and M-tropic strains of HIV to enter the cells (4, 33) but is absent in the CEM and most immortalized T-lymphoblastoid cell lines. The establishment of a CEM-GFP stable cell line expressing functional CCR-5 would enable the analysis of SI and NSI isolates. The possibility of addressing infectious viral burden may have multiple practical implications for investigating viral replication, dynamics, and pathogenesis, for example, HIV-induced apoptosis. Another potential application of CEM-GFP reporter cell line could be to investigate cellular signaling pathways resulting in NF-κB activation.
In summary, the establishment of a stable cell line expressing a LTR-driven GFP reporter gene has provided a fast, easy, inexpensive, and accurate tool for monitoring and investigating HIV infection, anti-HIV drug activity, and cellular signaling with T-cell tropic isolates. The unique feature of visualization, direct counting, and the possibility of sorting fluorescent cells without the addition of external substrate or labels is also of value compared with traditional methods.
Acknowledgments
We thank Sara Albanil and Marta Calbet for technical assistance. Special thanks go to Dr. David Looney, Center for AIDS Research. This project was supported through the University of California San Diego Center for AIDS research development grant (National Institute of Allergy and Infectious Diseases 1 P30 AI 36214), Grants CA67394-02 from the National Institutes of Health (J.C.) and DK49618 (F.W.S.), Grants AI 27670, AI38858, and AI 29164 from the National Institutes of Health, and grants from the Research Center for AIDS and HIV infection of the San Diego Veterans Affairs Medical Center (D.D.R.). A.G. is supported by a Swiss National Science Foundation training grant.
ABBREVIATIONS
- LTR
long terminal repeat
- GFP
green fluorescent protein
- MOI
multiplicity of infection
References
- 1.Richman D D, Johnson V A, Mayers D L, Shirasaka T, O’Brien M C, Mitsuya H. In: Current Protocols in Immunology. Ausubel F, Brent R, Kingston R E, Moore D D, Seidhan J G, Smith J A, Struhl K, editors. New York: Wiley; 1993. pp. 12.9.1–21. [Google Scholar]
- 2.Hirsch M S, Kaplan J C. Sci Amer. 1987;256:76–85. doi: 10.1038/scientificamerican0487-76. [DOI] [PubMed] [Google Scholar]
- 3.Schwartz O, Virelizier J L, Montagnier L, Hazan U. Gene. 1990;88:197–205. doi: 10.1016/0378-1119(90)90032-m. [DOI] [PubMed] [Google Scholar]
- 4.Deng H, Liu R, Ellmeier W, Choe S, Unutmaz D, Burkhart M, Di Marzio P, Marmon S, Sutton R E, Mark Hill C, Davis C B, Peiper S C, Shall T J, Littman D R, Landau N R. Nature (London) 1996;381:661–666. doi: 10.1038/381661a0. [DOI] [PubMed] [Google Scholar]
- 5.Merzouki A, Patel P, Cassol S, Ennaji M, Tailor P, Turcotte F R, O’Shaughnessy M, Arella M. Cell Mol Biol. 1995;41:445–452. [PubMed] [Google Scholar]
- 6.Swingler S, Easton A, Morris A. AIDS Res Hum Retroviruses. 1992;8:487–493. doi: 10.1089/aid.1992.8.487. [DOI] [PubMed] [Google Scholar]
- 7.Kimpton J, Emerman M. J Virol. 1992;66:2232–2239. doi: 10.1128/jvi.66.4.2232-2239.1992. [DOI] [PMC free article] [PubMed] [Google Scholar]
- 8.Chaflie M, Tu Y, Euskirchen G, Ward W, Prasher D. Science. 1994;263:802–805. doi: 10.1126/science.8303295. [DOI] [PubMed] [Google Scholar]
- 9.Prasher D, Eckenrode V, Ward W, Predergast F, Cormier M. Gene. 1992;111:229–233. doi: 10.1016/0378-1119(92)90691-h. [DOI] [PubMed] [Google Scholar]
- 10.Ormö M, Cubitt A B, Kallio K, Gross L A, Tsien R Y, Remington S J. Science. 1996;273:1392–1395. doi: 10.1126/science.273.5280.1392. [DOI] [PubMed] [Google Scholar]
- 11.Rizzuto R, Brini M, Pizzo P, Murgia M, Pozzan T. Curr Biol. 1995;5:635–642. doi: 10.1016/s0960-9822(95)00128-x. [DOI] [PubMed] [Google Scholar]
- 12.Plautz J D, Ray R N, Dailey G M, Welsh S B, Hall J C, Halpain S, Kay S A. Gene. 1996;173:83–87. doi: 10.1016/0378-1119(95)00700-8. [DOI] [PubMed] [Google Scholar]
- 13.Rogel M E, Wu L I, Emerman M. J Virol. 1995;69:882–888. doi: 10.1128/jvi.69.2.882-888.1995. [DOI] [PMC free article] [PubMed] [Google Scholar]
- 14.Stauber R, Gaitanaris G A, Pavlakis G N. Virology. 1995;213:439–449. doi: 10.1006/viro.1995.0016. [DOI] [PubMed] [Google Scholar]
- 15.Anderson M T, Tjioe I M, Lorincz M C, Parks D R, Herzenberg L A, Nolan G P, Herzenberg L A. Proc Acad Natl Sci USA. 1996;93:8508–8511. doi: 10.1073/pnas.93.16.8508. [DOI] [PMC free article] [PubMed] [Google Scholar]
- 16.Heim R, Cubitt A B, Tsien R Y. Nature (London) 1995;373:39–44. doi: 10.1038/373663b0. [DOI] [PubMed] [Google Scholar]
- 17.Sambrook J, Fritsch E, Maniatis T. Molecular Cloning: A Laboratory Manual. 2nd Ed. Plainview, NY: Cold Spring Harbor Lab. Press; 1989. [Google Scholar]
- 18.Kärber G. Arch Exp Pathol Pharmakol. 1931;162:480–483. [PubMed] [Google Scholar]
- 19.Chesebro B, Wehrly K. J Virol. 1988;62:3779–3788. doi: 10.1128/jvi.62.10.3779-3788.1988. [DOI] [PMC free article] [PubMed] [Google Scholar]
- 20.Pincus S, Wehrly K, Chesebro B. J Immunol. 1989;142:3070–3075. [PubMed] [Google Scholar]
- 21.Luznik L, Kraus G, Guatelli J, Richman D D, Wong-Staal F. J Clin Invest. 1995;95:328–335. doi: 10.1172/JCI117660. [DOI] [PMC free article] [PubMed] [Google Scholar]
- 22.Osborn L, Kunkel S, Nabel G. Proc Natl Acad Sci USA. 1989;86:2336–2340. doi: 10.1073/pnas.86.7.2336. [DOI] [PMC free article] [PubMed] [Google Scholar]
- 23.Thanos D, Maniatis T. Cell. 1995;80:529–532. doi: 10.1016/0092-8674(95)90506-5. [DOI] [PubMed] [Google Scholar]
- 24.Meylan P R, Spina C A, Richman D D, Kornbluth R S. Virology. 1993;193:256–267. doi: 10.1006/viro.1993.1121. [DOI] [PubMed] [Google Scholar]
- 25.Redfield D C, Richman D D, Oxman M N, Kronenberg L H. Infect Immun. 1981;32:1216–1226. doi: 10.1128/iai.32.3.1216-1226.1981. [DOI] [PMC free article] [PubMed] [Google Scholar]
- 26.Johnson V A, Walker B D, Barlow M A, Paradis T J, Chou T C, Hirsh M S. Antimicrob Agents Chemother. 1989;33:53–57. doi: 10.1128/aac.33.1.53. [DOI] [PMC free article] [PubMed] [Google Scholar]
- 27.Richman D D, Rosenthal A S, Skoog M, Eckner R J, Chou T-C, Sabo J P, Merluzzi V J. Antimicrob Agents Chemother. 1991;35:305–308. doi: 10.1128/aac.35.2.305. [DOI] [PMC free article] [PubMed] [Google Scholar]
- 28.Hsu M C, Schutt A D, Holly M, Slice L W, Sherman M I, Richman D D, Potash M-J, Volsky D J. Science. 1991;254:1799–1802. doi: 10.1126/science.1763331. [DOI] [PubMed] [Google Scholar]
- 29.Dorfman T, Gottlinger H G. J Virol. 1996;70:5751–5757. doi: 10.1128/jvi.70.9.5751-5757.1996. [DOI] [PMC free article] [PubMed] [Google Scholar]
- 30.Corbeil J, Tremblay M, Richman D D. J Exp Med. 1996;183:39–48. doi: 10.1084/jem.183.1.39. [DOI] [PMC free article] [PubMed] [Google Scholar]
- 31.Nakashima H, Pauwels R, Baba M, Schols D, Desmyter J, De Clercq E. J Virol Methods. 1989;26:319–329. doi: 10.1016/0166-0934(89)90114-6. [DOI] [PubMed] [Google Scholar]
- 32.Feng Y, Broder C C, Kennedy P E, Berger E A. Science. 1996;272:872–877. [Google Scholar]
- 33.Doranz B, Rucker J, Smyth Y R J, Samson M, Peiper S C, Parmentier M, Collman R G, Doms R W. Cell. 1996;89:1149–1158. doi: 10.1016/s0092-8674(00)81314-8. [DOI] [PubMed] [Google Scholar]


