

Abstract
With the introduction of multi-detector row computed tomography (MDCT), scan speed and image quality has improved considerably. Since the longitudinal coverage is no longer a limitation, multi-detector row computed tomography angiography (MDCTA) is increasingly used to depict the peripheral arterial runoff. Hence, it is important to know the advantages and limitations of this new non-invasive alternative for the reference test, digital subtraction angiography. Optimization of the acquisition parameters and the contrast delivery is important to achieve a reliable enhancement of the entire arterial runoff in patients with peripheral arterial disease (PAD) using fast CT scanners. The purpose of this review is to discuss the different scanning and injection protocols using 4-, 16-, and 64-detector row CT scanners, to propose effective methods to evaluate and to present large data sets, to discuss its clinical value and major limitations, and to review the literature on the validity, reliability, and cost-effectiveness of multi-detector row CT in the evaluation of PAD.
Keywords: Human, Peripheral vascular diseases, Radiography, Tomography, X-ray computed methods, Reproducibility of results, Sensitivity and specificity
Introduction
Before multi-detector row CT (MDCT) technology was available, the evaluation of peripheral arterial disease (PAD) using CT was restricted to imaging only a portion of the peripheral arterial tree [1–8]. With the introduction of four-detector row CT (4D-CT) in 1998, this major limitation was overcome. A complete coverage of the lower extremity inflow and runoff arteries was possible with one acquisition using a single-contrast bolus. With the launch of the 16-detector row CT (16D-CT), the spatial resolution increased to near isotropic voxels and the contrast medium efficiency improved [9–11]. True isotropic high spatial resolution of the entire volume was possible using the 64-detector row CT (64D-CT) scanner. In addition, improved X-ray tube capacity and scan speed allow submillimeter acquisition of a large coverage without limitations. These developments made multi-detector row CT angiography (MDCTA) an accurate alternative for the assessment of the peripheral arteries [12–25]. Using standardized scanning and reviewing protocols, peripheral CT angiography is a robust non-invasive technique for evaluating chronic and acute disease of the peripheral arteries. We present a review concerning our experience with 4-, 16-, and 64-detector row CT scanners in patients with PAD.
Technique
Preparation
There are no specific prescanning preparations necessary for MDCTA of the peripheral arteries. The patient is placed comfortably to avoid movement, in the supine position with raised arms on the CT table. The legs are stabilized with cushions around the legs and slightly strapped with adhesive tape distally. It is important that the patient does not wear metal zippers or buttons on their clothing, since this can have a negative influence on the image quality, especially when using postprocessed images. Oral contrast should not be used, as this complicates postprocessing display (Table 1). Contrast material needs to be administered at body temperature to decrease the viscosity. The protocol can be completely programmed into the scanner.
Table 1.
Prescanning preparation
| Parameter | Description |
|---|---|
| Clothing | No metal parts on clothing |
| Oral contrast | None |
| I.V. cannula antecubital | Minimally 22 G (0.6 mm inner diameter, blue valve) |
| Positioning | Supine, stabilized and lightly strapped, feet-first and arms elevated |
| Respiratory phase | Inspiration during abdominal-pelvic range |
Technical parameters
The main challenge for peripheral CT angiography is the great range of the vascular system that needs to be depicted. Using a scanogram of approximately 1,500-mm length, the coverage of the acquisition is planned from the celiac trunk (T12 vertebral body) to the level of the talus using 4D-CT, or to the level of the feet using 16D-CT or higher (Fig. 1).
Fig. 1.
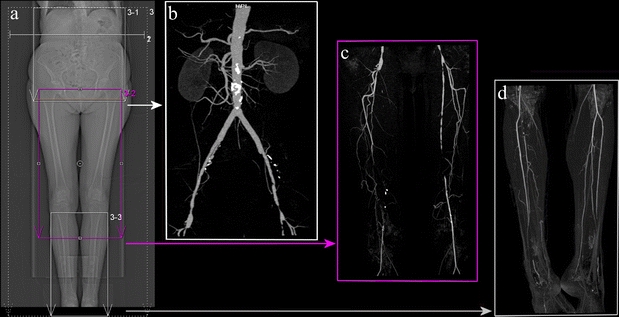
(a) Scout image with three planned reconstruction batches of the abdomen, the upper legs, and the lower legs to preserve postprocessed image resolution. The frames 3-1, 3-2, and 3-3 depict the field of view of the three data sets, which need to be as narrow as possible to optimize pixel size. Whole-body volume maximum intensity projection (MIP) images after semiautomated bone removal of the abdominal data set (b), the femoral data set (c), and the crural data set (d)
Scan duration
The optimal scan duration for peripheral CT angiography varies between approximately 20 to 40 s, depending on the number of detector rows and the collimation (Table 2). The velocity of a contrast bolus to travel from the aorta to the popliteal arteries varies from 29 to 177 mm/s in patients with PAD [26]. This large variability is unpredictable and does not correspond to the severity of PAD. Based on these bolus travel times, it is recommended to limit the maximum table speed on faster scanners to 30 mm/s to avoid outrunning the bolus, leading to poor distal vessel opacification. This can be obtained, for example, by limiting the gantry rotation speed from 0.33 to 0.5 rotations per second or reducing the pitch (Table 2). Moreover, it is advised to program a second acquisition protocol into the scanner to start immediately if delayed distal enhancement is detected (Fig. 2). Because the time of the contrast bolus to travel from the aorta to the ankles varies from 7 to 40 s, a longer scan duration increases the risk of venous contamination, especially when there is critical ischemia and inflammation [26, 27]. Nevertheless, the discrimination of the arteries from the veins is often possible due to the stronger arterial enhancement and the anatomic 3D information [12].
Table 2.
Acquisition parameters for various multi-detector row computed tomography (MDCT) configurations for the angiography of peripheral arteries
| Type of scanner | Section collimation width (mm)b | Rotation time (s) | Pitchc | Table feed (mm/ rotation) | Table speed (mm/s) | Scan duration (s) d | Characteristics |
|---|---|---|---|---|---|---|---|
| 4D-CTa | 4 × 2.5 | 0.5 | 1.5 | 15 | 30 | 40 | Slow scan protocol, thick minimal slice width |
| 16D-CTa | 16 × 0.75 | 0.5 | 1.3 | 15 | 30 | 40 | Slow scan protocol, high resolution |
| 16 × 1.5 | 0.5 | 0.7 | 17 | 34 | 35 | Slow scan protocol, less resolution, better in obese patients | |
| 16 × 1.5 | 0.5 | 1.0 | 24 | 48 | 25 | Fast scan protocol, less resolution, reduction of contrast media | |
| 64D-CTa | 2 × 32 × 0.6 | 0.5 | 0.8 | 15 | 30 | 40 | Slow scan protocol, high resolution, isotropic voxel, double z-sampling, scanning of obese patients possible |
| 2 × 32 × 0.6 | 0.33 | 0.8 | 16 | 48 | 25 | Fast scan protocol, reduction of contrast media, high resolution, isotropic voxel, double z-sampling, scanning of obese patients possible | |
| 2 × 32 × 0.6 | 0.33 | 1.0 | 19.8 | 60 | 20 | Fast scan protocol, reduction of contrast media, high resolution, isotropic voxel, double z-sampling, scanning of obese patients possible, risk of outrunning the bolus |
aProtocols designed for Siemens CT scanners (Siemens Medical Systems, Erlangen, Germany) and should be modified appropriately for other models and manufacturers
bValues are number of sections times section width
cPitch as the ratio of the table feed per rotation over the total width of the collimated beam
dScan times representing a scanned range of 120 cm
Fig. 2.
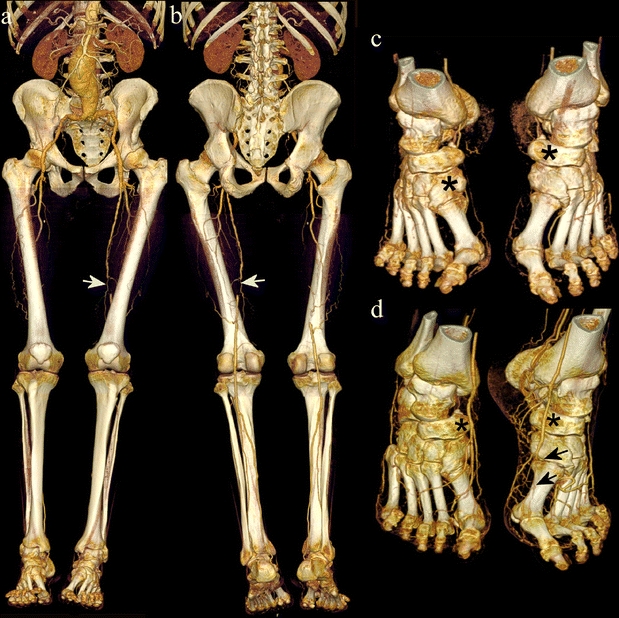
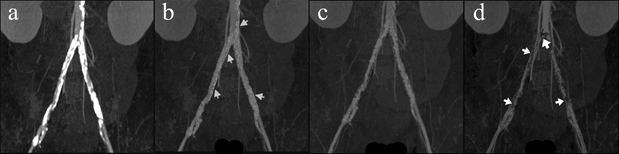
Images from the first and second delayed acquisition of a 37-year old male with blue toe syndrome of the left hallux. (a and b) VRT images of the first acquisition show in the aneurysmatic abdominal aorta a short occlusion of the left femoral artery (white arrows) due to thrombo-embolism and an occlusion of the entire right superficial femoral artery. The anterior tibial arteries seem occluded in both legs. (c and d) VRT image of the feet with the first and the delayed second acquisition. The first acquisition (c) shows that the arteries of the feet are not enhanced yet due to slow flow (asterisk). The delayed acquisition (d) shows that both dorsal pedal arteries are patent and that the proximal arcuate artery and the first dorsal metatarsal artery (black arrows) of the left foot are occluded due to thrombo-embolism
Using recent MDCT scanners, fast scans (25 s or less) can be performed of the peripheral arteries to reduce the amount of contrast media. To allow fast scan speed using 16-detector row CT (16D-CT) scanners, a wider collimation must be used (Table 2). The 64-detector row CT (64D-CT) even allows to perform fast scans while maintaining submillimeter collimation. However, to ensure distal opacification, the scanning delay must be increased appropriately in fast scans. Another difficulty of a fast scan is that there is a greater risk of asymmetric enhancement in patients with severe unilateral vascular disease. Therefore, it is safer to choose a slower scan speed.
Collimation
To aim for maximal spatial resolution, a thin section collimation width allows a narrow effective slice width. Furthermore, the partial volume effect and blooming effect of calcium will be reduced (Fig. 3) [10]. The collimation should be chosen as narrow as possible but still allowing for a table speed of 30 mm/s and depends on the number of detector-rows and heat capacity. On a 4-detector row CT (4D-CT), the collimation is limited to 4 × 2.5 mm, whereas the 16D-CT and 64-detector row CT (64D-CT) allow a submillimeter collimation of 16 × 0.75 mm and 32 × 2 × 0.6 mm, respectively.
Fig. 3a, b.
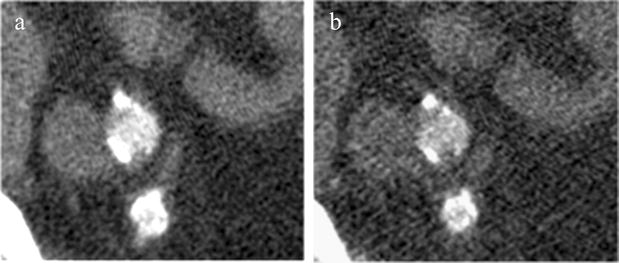
Images of 16-detector row CT (16D-CT) acquired with a collimation of 0.75 mm showing the effect of slice width (SW) on the blooming of the arterial wall calcifications. (a) Reconstructed axial image of the right external and internal iliac artery with SW of 3.0 mm using a B46 reconstruction kernel shows more blooming of the calcifications than (b). (b) Reconstructed axial image of the right external and internal iliac artery with SW of 0.75 mm using a B46 reconstruction kernel with less blooming of calcifications
Using 16D-CT in obese patients, the thin collimation protocol leads to unacceptable noise levels in the abdomen and pelvis because the tube is unable to deliver the necessary dose in this submillimeter configuration. In order to enable the tube to deliver a higher dose, a wider collimation (16 × 1.5 mm) with a reduced pitch factor of 0.7 (Table 2) is used to improve the image quality in obese patients. For the 64D-CT scanner, there is no longer a tradeoff between resolution and scan speed, and it allows, even in obese patients, a fast submillimeter scan protocol.
Contrast injection
It is important in peripheral CT angiography to obtain a high and homogenous enhancement of the arterial tree and to synchronize the acquisition with the enhancement. The optimization of acquisition timing and contrast medium delivery is essential for vascular assessment and image postprocessing. Normally, attenuation values higher than 200 HU in the arteries is considered suitable in MDCTA [12, 13]. For the intravenous injection of contrast medium in the antecubital vein, 22- and 20-gauge intravenous cannulas are needed for the maximal flow rates of 3.5 and 5.0 mL/s, respectively.
Acquisition timing
Due to the interindividual hemodynamic variability in peripheral CT angiography, reliable timing techniques are preferred over using a fixed delay. The test-bolus technique relies on the dynamic monitoring of small contrast boluses to measure the contrast arrival and travel time at the proximal and distal arteries, respectively. The bolus-triggering technique is a commonly used timing technique that is based on repetitive low-dose sequential scans at the level of the abdominal aorta, to monitor the arrival time of the contrast media. The acquisition starts automatically when the preferred threshold is reached, approximately 100 to 150 HU above the baseline value. During a transition delay, which is the time needed for the table to move and start the scan, of approximately 4 s, breathing instructions can be given to the patient. During this delay, the enhancement of the aorta will further increase to an absolute value of more than 200 HU.
For a fast scan protocol, an extra delay must be added to the contrast arrival time to ensure distal arterial opacification [28]. This extra delay can be calculated as 35 s minus the scanning time. Thus, for a scan time of 25 s, a extra delay of 10 s. must be added. Another option is to monitor at the proximal level of the popliteal artery and to start the scan manually when enhancement is visualized. Consequently, the time of contrast arrival increases by approximately 8 s [26, 27] and the transition delay of the scanner increases to 11 s to travel from the knees to the diaphragm and then starting the acquisition.
Contrast injection
The volume of contrast material ranges from 120 to 160 ml for a typical scan duration of 40 s. The amount of contrast media depends on the scan duration and on the flow rate. Because the last volume of the bolus will not contribute to the enhancement when scanning below the knees, the injection duration can be shortened by 5 s, e.g., a 35-s injection time is used for an acquisition of 40 s. However, to ensure the enhancement of all arteries, the injection duration should not be shorter than 30 s and in fast scan protocols, a delay time needs to be added appropriately to prevent outrunning the contrast bolus. A flow rate of 3 to 4 ml/s is necessary for adequate arterial enhancement [12]. This corresponds to an iodine administration rate of 1.0 to 1.4 g/s using a contrast media concentration of approximately 320 to 350 mg I/mL. Based on the reported literature the average values of contrast media volume, concentration, injection rate, and administration rate are 134 ml, 341 mg I/mL, 3.5 ml/s, and 1.2 g/s, respectively [9–25, 29–36]. By increasing the iodine concentration to a concentration of 400 mg I /mL, the iodine administration rate can be increased to 1.6 g/s to increase the enhancement [37]. To optimize the enhancement, 20 to 60 mL of saline is injected immediately after the contrast media. A tighter bolus can be obtained to increase the attenuation.
Using a monophasic injection rate, the arterial enhancement increases over time to decrease at the end of the bolus. Consequently, the Hounsfield values of the enhanced arteries start lower at the level of the aorta and increase at the level of the popliteal artery to the highest attenuation value, and, subsequently, decrease distally in the runoff arteries, especially for longer scan durations [26]. A more homogenous enhancement can be achieved using a biphasic injection rate using a higher rate (5–6 ml/s) at the beginning (during the first 5 s) of the injection and a lower rate (3 ml/s) for the remaining volume. In clinical practice, a monophasic injection rate is often used because it is a simple method and has resulted in adequate image quality [37].
Patient dose in MDCT
A particular concern with MDCT scanners is delivering potentially higher radiation doses. To maintain the noise level in submillimeter slices, the dose needs to increase proportionally. On the other hand, with the increasing number of detector rows, the z-axis efficiency improves, since the overbeamed area decreases. Current MDCT scanners present an indication of patient dose on the scanner console for dose awareness and to help optimize the scan protocol. Useful in CT angiography is that, when reducing the X-ray energy, the contrast-to-noise ratio increases. Compared to a standard scan with 120 kVp, selecting 100 kVp, results in a dose saving of approximately 40% [38–40]. Furthermore, dose reduction can be achieved by decreasing the tube current using automatic tube current modulation. With angular tube current modulation, the tube current varies during the course of a rotation. The changing attenuation through different projections around the patient (e.g., at the level of the pelvis) can be used, to reduce unnecessary x-rays in the anterior–posterior projection without any substantial effect on image quality [9, 41, 42]. With longitudinal tube current modulation, the tube current varies along the z-axis based on the size, shape, and attenuation to maintain a predefined noise ratio. Compared with constant tube current, this technique results in acceptable image noise and a dose reduction of 20% or more without compromising diagnostic image quality [9, 41, 42].
The average patient dose reported in the literature in the assessment of PAD with CT angiography is 7.47 mSv [9, 12, 24, 31, 43]. The radiation risk from these doses is not a major concern in patients with PAD. Their life expectancy is shorter than the latency period of a radiation-induced fatal malignancy [44–46].
Display and evaluation
Image reconstruction
The raw data set is reconstructed using an increment with 50% to 70% overlap. Peripheral CT angiography generates more than 1,500 axial images, depending on slice width and reconstruction increment. It is recommended to reconstruct separate data sets. Routinely, we calculate three separate data sets of the peripheral runoff (Fig. 1). The first advantage is that it allows us to reconstruct thicker slices, e.g., of 1.5 mm for the abdominal and femoral data set, and thinner slices for the crural data set to optimize the resolution and to minimize the data load [9, 10, 16, 20, 23]. Secondly, longitudinal images that are calculated from the entire data set have a decreased resolution, due to the limited display matrix (e.g., 512 × 512) [32]. Images that are reconstructed from the separate data sets will preserve the initial longitudinal resolution.
A smooth kernel (B20 for Siemens CT scanners) is generally used in CT angiography and leads to an accurate depiction of the diameter of the vessels and is very appropriate for postprocessing. A sharp kernel (B46) is used when stents or severe vessel wall calcifications are present, as it minimizes the blooming effect at the cost of some increase in the noise level [47].
The field of view (FOV) is selected as small as possible to optimize pixel size. A FOV of 380 mm, 350 mm, and 300 mm for the abdominal, femoral, and crural data sets, results in pixel sizes of approximately 0.74 mm, 0.68 mm, and 0.58 mm, respectively. Also, the FOV can be further decreased to 200 mm by including only one leg, leading to a pixel size of 0.4 mm.
Advanced postprocessing and image evaluation
Additional two-dimensional (2D) and three-dimensional (3D) postprocessing techniques are required to facilitate interpretation and presentation. Reviewing exclusively the transverse images is inefficient and less accurate than reviewing a combination of reformatted images.
To preserve the study quality for clinical decision making, a standard set of postprocessed images needs to be included in the protocol. These include thin-slab maximum-intensity projections (MIPs) through visceral and renal arteries and the abdominal aorta, through femoropopliteal arteries, and through crural arteries (Fig. 4); whole-volume MIPs of the separate data sets after bone removal (Fig. 1) and when necessary, after removal of vessel wall calcifications (Fig. 5); and curved planar reformations (CPRs), e.g., through the iliac arteries. Volume-rendered (VR) images are fast and effortless created to present the pathology to clinicians, who normally do not have the possibility to review the data set interactively.
Fig. 4a–d.
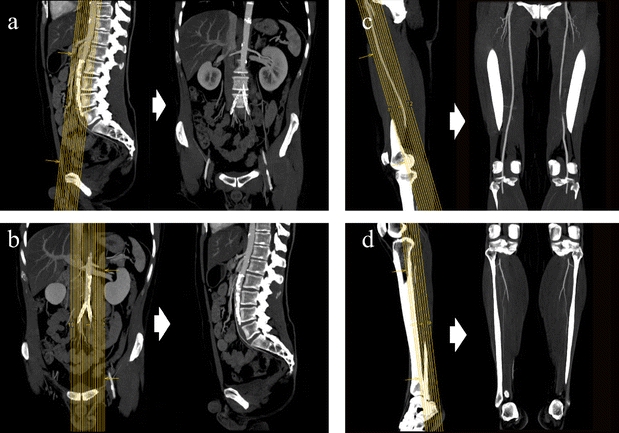
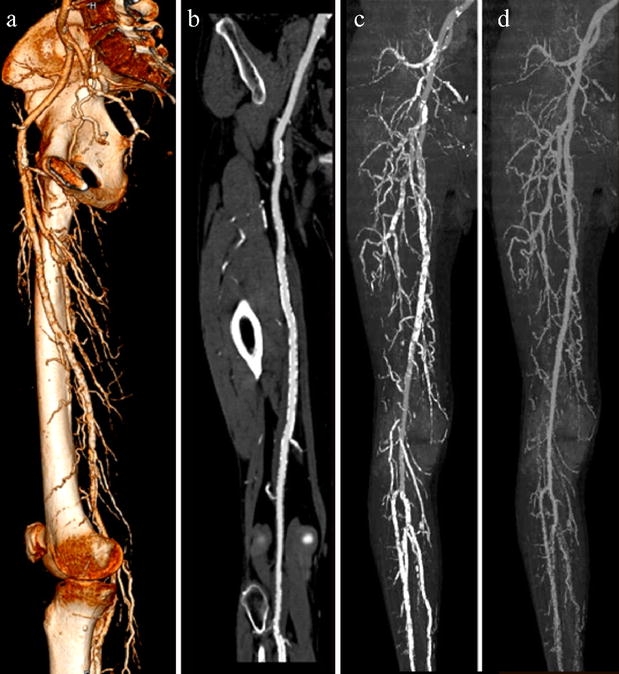
Standard slab MIP images in the postprocessing protocol make MDCTA of peripheral arteries on a routine basis feasible. Slab MIPs are easy and fast to create and to evaluate. The images depict the vasculature without superimposing bones (a and b). From the abdominal data set, MIP images are created in coronal projection to depict the renal arteries (b) and in sagittal projection to depict the celiac trunk and mesenteric arteries (d). The aorta is also depicted for evaluation. (c) Standard coronal slab MIPs from the data set of the upper legs are created, which are parallel to the superficial femoral and popliteal artery. (d) Standard coronal slab MIPS from the data set of the lower legs display the crural arteries
Fig. 5a–d.
Volume MIP images in anteroposterior projection show the result of three different threshold levels used for the segmentation of arterial wall calcifications. (a) Volume MIP before removal of the calcifications shows that the lumen is not visible. (b) Volume MIP after removal of the calcifications shows that, still, many voxels of calcification are present, hampering lumen assessment (arrows). (c) Volume MIP shows angiogram after calcium segmentation using a correct threshold level allowing lumen assessment. The rest of the voxels of the burden of calcifications are just visible as unesthetical noise, which is, however, preferable to introducing pseudo-stenoses (d) (arrows) by using a too low threshold level
The data sets are reviewed effectively by evaluating the standard set of postprocessed images and, interactively, exploring the data set using multiplanar reformations (MPRs) . The transverse images (or true cross-sectional images) need to be considered to verify diseased segments [4, 6, 19].
When extensive calcifications or stents are present, the vessel lumen visibility and the clinicians’ confidence in the CT images will decrease [25]. In whole-volume MIPs, superimposing calcifications can be selected to be removed digitally from the data set using thresholding and region-growing techniques (Fig. 6). However, the removal of the numerous arterial wall calcifications can be very time consuming. Another limitation of these segmentation techniques is that readers should be aware of artificial stenoses and occlusions. These can be introduced when voxels that represent lumen are inadvertently removed when in close contact with the bones (Figs. 7 and 8) or when a too low threshold value is used (Fig. 5). In addition, in VR images, the lumen is also obscured by vessel wall calcifications and, as a result, should not be used for the lumen assessment (Fig. 6). A more reliable technique for stenosis detection in extensive calcified arteries is CPR, which displays the lumen as a longitudinal cross-section (Fig. 6). When using an application that semi-automatically traces the vessel lumen, the risk of an inaccurately positioned central lumen line is minimized. The CPR projection should include at least two perpendicular longitudinal projections and true cross-sectional images can be viewed for lumen assessment [19]. Software tools are available for automatic quantitative evaluation of the traced lumen and to generate a graphical presentation of luminal diameter (Fig. 9). Multipath CPRs are under development and could enhance image evaluation.
Fig. 6a–d.
Influence of vessel wall calcifications on postprocessed images and the ability for lumen assessment. (a) VRT image (medial view) of right femoropopliteal segment showing arterial wall calcification; does not allow luminal assessment. (b) CPR image (anteroposterior view) shows the interior of blood vessels as a longitudinal cross-section, even in the presence of the arterial wall calcifications. This is the preferred imaging technique when extensive calcifications of the vessel wall are present. Volume MIP (anteroposterior view) after bone removal using region-growing and threshold techniques (c) does not allow lumen evaluation. Volume MIP after additional calcification removal (d) removes superimposing calcification to enable lumen evaluation
Fig. 7a–c.
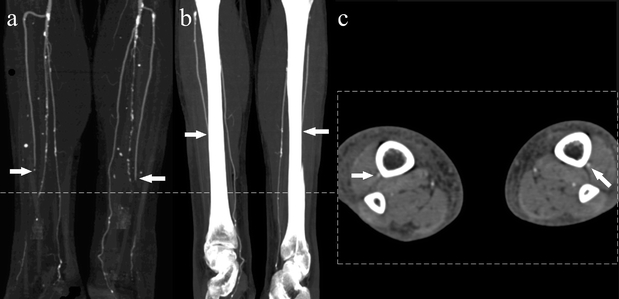
Images of segmentation artifacts due to bone removal in 16D-CTA. (a) Volume MIP after bone segmentation of the lower legs showing a pseudo-occlusion of both distal anterior crural arteries (arrows), which is caused by segmentation of the bones. (b) MIP of the lower legs showing the anterior tibial arteries in close proximity to the tibia (arrows), which is the cause of the false positive pseudo-occlusion. (c) Axial image of the lower legs just caudal from the pseudo-occlusion, showing the patency of both anterior tibial arteries of both legs in close proximity of the tibia (arrows)
Fig. 8a–c.
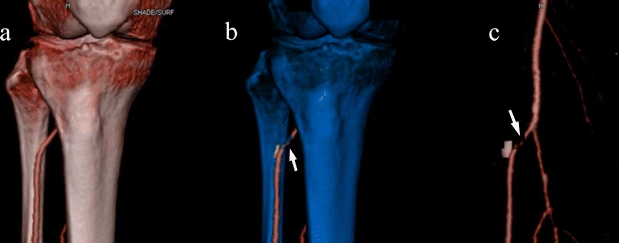
Applying blue color to the voxels selected for removal helps to identify the sites of segmentation artifacts in VRT images. (a) VRT image before bone segmentation of the lower legs showing patent proximal anterior tibial arteries. (b) VRT with blue bones to indicate the voxels to be removed shows the voxels of the bone which are in contact with the proximal anterior tibial artery are not selected for removal and shows the voxels of the artery which are selected for removal. (c) Segmented VRT image showing the pseudo-occlusion of the anterior tibial artery
Fig. 9a, b.
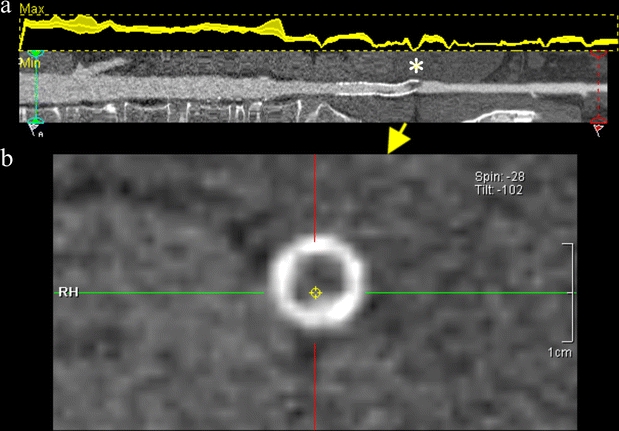
Results of semiautomated quantitative lumen assessment in aortoiliac arteries of a patient with in stent thrombosis. (a) Graph (upper section) displaying the maximum and minimum diameters of the lumen to quantify stenosis. CPR (lower section) through the aortoiliac arteries, which can be rotated around its longitudinal axis, depicts the luminal obstruction (asterisk) due to a thrombus inside an iliac stent. (b) Corresponding transverse image confirms the occlusion of the iliac stent
Wall calcification problem
The depiction of vessel wall calcifications using MDCT can be valuable, since severely calcified arteries may have consequences for bypass surgery. On the other hand, these wall calcifications are known to hamper the assessment of the lumen [2, 10, 14, 19]. Approximately 20% to 50% of the vascular segments contain wall calcifications, of which, 10% severely calcified [11, 19]. Patients with a history of diabetes mellitus, cardiac disease, or elderly age are very likely to have extensive calcifications [48]. Furthermore, we found that patients with Fontaine stage III/IV have more infrapopliteal arterial wall calcifications compared to stage IIb.
How can we deal with the vessel wall calcifications depicted with MDCTA? It is important to use a wider window width (WW) and higher window center (WC) level settings from the usual CT angiography level of around 150 WC ± 250 WW to 200 WC ± 1000 WW for a better differentiation of calcifications and stents from the enhanced lumen and to minimize the effect of blooming. A further minimization of blooming is reached by using a sharper reconstruction kernel and higher spatial resolution.
Especially in MIP images, the lumen is hidden by the circumferential calcifications. In these circumstances, transverse images, CPR images, and the digital removal of the calcifications help to depict the lumen, at least for the larger arteries. Despite all of the available tools, in particular in the smaller crural arteries, the concentric calcifications still hamper lumen assessment [11]. Recent publications showed that a subtraction technique using two acquisitions is feasible in some patients with PAD using MDCTA [24, 49]. In the near future, automated 3D applications could help to minimize the impediment of the calcifications [50]. Whether dual-energy CT angiography can improve this limitation of CT needs to be evaluated.
Clinical value
Because MDCT angiography for the imaging of the peripheral arteries is a rather new non-invasive technique, there are a small number of studies published on its performance and reproducibility (Table 3). The majority report on 4D-CT; two authors report on 16D-CT. There are no reports of the assessment of PAD using 64D-CTA. In our meta-analysis soon appearing in Radiology, which included 436 patients and 9,541 arterial segments, a pooled sensitivity and specificity for detecting a >50% stenosis of 92% and 93% was estimated, respectively.
Table 3.
Validity of CT angiography in peripheral arterial disease (PAD)
| Authora | No. of patients | No. of analyzed segments | No. of detectors | Reported sensitivity (%)e | Reported specificity (%)e | Assessed segments | Stenosis category (%)h |
|---|---|---|---|---|---|---|---|
| Richter et al. 1994 | 32 | ns | 1 | 84 | ns | Iliac | >50 |
| Lawrence et al. 1995 | 6 | 134 | 1 | 93 | 96 | Femorocrural | >50 |
| Raptopoulos et al. 1996 | 39 | 624 | 1 | 93 | 96 | Aortoiliac | 85–99 |
| Rieker et al. 1996 | 50 | 400 | 1 | 73–88b | 94–100b | Femorocrural | 75–99 |
| Rieker et al. 1997 | 30 | 210 | 1 | 93 | 99 | Aortoiliac | 75–99 |
| Kramer et al. 1998 | 10 | ns | 2 | 94 | ns | Iliocrural | >90–99 |
| Ishikawa et al. 1999 | 49 | ns | 1 | 97 | 95 | Bypass grafts | ns |
| Bourlet et al. 2000 | 22 | 318 | 1 | 95 | 90 | Aortoiliac | >50 |
| Puls et al. 2001 | 31 | 186 | 4 | 89 | 86 | Total tree | 50–99 |
| Willman et al. 2003 | 46 | 769 | 4 | 91 | 99 | Aortoiliac grafts | ns |
| Ofer et al. 2003 | 18 | 410 | 4 | 91 | 92 | Total tree | >50 |
| Heuschmid et al. 2003 | 18 | 568 | 4 | 91c | 92c | Total tree | >50 |
| Martin et al. 2003 | 41 | 1,312 | 4 | 92 | 97 | Total tree | 75–99 |
| Catalano et al. 2004 | 50 | 1,148 | 4 | 96 | 93 | Total tree | >50 |
| Mesurolle et al. 2004 | 16 | 168 | 2 | 91 | 93 | Total tree | >50 |
| Ota et al. 2004 | 24 | 470 | 4 | 99 | 99 | Total tree | >50 |
| Poletti et al. 2004d | 12 | 144 | 4 | 82/96g | ns | ns | >50 |
| Portugaller et al. 2004 | 50 | 740 | 4 | 92 | 83 | Total tree | area >70 |
| Romano et al. 2004 | 42 | 3,402 | 4 | 93 | 95 | Total tree | ns |
| Romano et al. 2004 | 22 | 1,782 | 4 | 92 | 94 | Total tree | ns |
| Stueckle et al. 2004 | 52 | ns | 4 | 82 | 100 | Total tree | ns |
| Edwards et al. 2005 | 44 | 1,024 | 4 | 79 | 93 | Total tree | 50–99 |
| Fraioli et al. 2006 | 75 | 1,425 | 4 | 96–99h | 94–96h | Total tree | 50–99 |
| Schertler et al. 2005 | 17 | 170 | 16 | 96 | 90 | Popliteocrural | >50 |
| Willmann et al. 2005 | 39 | 1,365 | 16 | 96 | 96 | Total tree | >50 |
| Unpooled mean | 91 | 94 |
aBased on references [1–6, 8–10, 13–24, 31, 34, 35, 56, 57]
bFor various anatomic levels
cCalculated from the data
dBased only on subtracted MDCTA images, the positive predictive value was 95%
eSensitivity as published or calculated overall mean.
fDiameter stenosis is mentioned unless specified (>50 means stenosis more than 50% including occlusion)
gFor subtracted and nonsubtracted segments, respectively
hDepending on the MDCTA protocol with varying mAs
Publications on the reproducibility of CT angiography reported a good intertest agreement between MDCTA and DSA (Table 4) and a good to excellent interobserver agreement for 4D-CTA [12, 21, 23, 35] and 16D-CTA (Table 5) [9, 11]. A few studies provide stratified data on the aortoiliac, femoropopliteal, and crural tract and show that the accuracy and reproducibility of the crural tract is lower than for the aortoiliac and femoropopliteal tracts [9, 11, 20, 22, 23].
Table 4.
Intertest agreement between CT angiography and digital subtraction angiography in PAD
| Authora | No. of patients | No. of assessed segments | No. of detectors | Reported intertest agreementd | Assessed segments |
|---|---|---|---|---|---|
| Raptopoulos et al. 1996 | 39 | 624 | 1 | 90% | Aortoiliac |
| Beregi et al. 1997 | 20 | 52 | 1 | 100% | Popliteal |
| Tins et al. 2001 | 35 | 219 | 1 | 84% | Aortoiliac |
| Walter et al. 2001 | 22 | 456 | 4 | κ = 0.68 (0.50–0.97)c | Total tree |
| Rubin et al. 2001 | 18 | 351 | 4 | 100% | Total tree |
| Heuschmid et al. 2003 | 23 | 1,136 | 4 | 86% | Total tree |
| Ofer et al. 2003 | 18 | 444 | 4 | 78% | Total tree |
| Romano et al. 2004 | 42 | 3,402 | 4 | κ = 0.68; 90% | Total tree |
| Romano et al. 2004 | 22 | 1,782 | 4 | κ = 0.68; 90% | Total tree |
Table 5.
Interobserver agreement of CT angiography in PAD
| Authora | No. of patients | No. of analyzed segments | No. of detectors | Reported interobserver agreementb | Assessed segments |
|---|---|---|---|---|---|
| Rieker et al. 1997 | 30 | 210 | 1 | ρ=0.95 | Aortofemoral |
| Walter et al. 2001 | 22 | 456 | 4 | κ = 0.71–0.76c | Total tree |
| Tins et al. 2001 | 35 | 219 | 1 | 78% | Aortofemoral |
| Martin et al. 2003 | 41 | 1,312 | 4 | κw = 0.84 | Total tree |
| Romano et al. 2004 | 42 | 3,402 | 4 | κ = 0.84;0.86d | Total tree |
| Romano et al. 2004 | 42 | 1,782 | 4 | κ = 0.85, 0.88, κ = 0.80e | Total tree |
| Catalano et al. 2004 | 50 | 1,137 | 4 | κ = 0.80 | Total tree |
| Ota et al. 2004 | 24 | 470 | 4 | κ = 0.88 | Iliac |
| Portugaller et al. 2004 | 50 | 740 | 4 | κ = 0.81 | Total tree |
| Kock et al.f | 73 | 2,268 | 4 | κw = 0.84 | Total tree |
| Ouwendijk et al. 2005 | 79 | 2,419 | 16 | κw = 0.85 | Total tree |
| Willmann et al. 2005 | 39 | 1,365 | 16 | κ = 0.85–1 | Total tree |
aBased on references [4, 7, 9, 11, 15, 17–19, 21, 23, 35]
bAn unweighted kappa statistic (κ) is reported, unless indicated (κw=weighted kappa statistic; ρ=intraclass agreement coefficients as a measure of agreement for ordinal or quantitative data). A linear weighting was used, except in one paper [15], where a quadratic weighting was used
cRange of kappa values of the individual anatomical segments
dFor reader one and two, respectively
eFor intraobserver (two readers) and interobserver agreement, respectively
fBased on unpublished data
MDCTA leads to adequate decision making for treatment recommendations concerning both the anatomical level and the technique of revascularization [51]. A cost-effectiveness study showed that MDCTA is a cost-effective diagnostic strategy in the work-up of PAD [52, 53]. Randomized controlled trials confirmed that MDCTA in PAD is the optimal diagnostic imaging technique [25, 54] and reduces the diagnostic costs when compared to DSA and CEMRA with comparable clinical utility and patient outcomes. Besides these evidence-based results, local expertise and availability also define which modality to use in clinical practice (Table 6).
Table 6.
Advantages and limitations of multi-detector row CT angiography (MDCTA), contrast enhanced MR angiography (CEMRA), and digital subtraction angiography (DSA)
| MDCTA | CEMRA | DSA | |
|---|---|---|---|
| Intermittent claudication (Fontaine II) | + | + | + |
| Chronic critical ischemia (Fontaine III or IV) | − | + | + |
| Short examination time | + | − | − |
| Short postprocessing time | − | + | + |
| Outpatient setting | + | + | − |
| Availability | + | − | + |
| Non-invasive technique/patient comfortb | + | + | − |
| Low diagnostic imaging costs | + | − | − |
| Contrast media tolerance | − | + | − |
| Three-dimensional imaging | + | + | − |
| Non-interference of stentsc | + | − | + |
| Radiation risk | +(−)d | − | +(−)d |
| Acute clinical setting | + | − | + |
| Hemodynamic assessment | − | −a | + |
| Extraluminal pathology visualization | + | −a | − |
It is reported that arterial wall calcifications lead to false-positive interpretations and a decreased reproducibility in reading MDCTA [2, 14, 11]. We have to acknowledge this limitation with current technology. A preferential indication for MDCTA in patients with intermittent claudication (Fontaine stage IIb) is clearly justified. However, patients with critical limb ischemia (Fontaine stage III/IV), who are likely to have extensive calcifications of the smaller arteries, could be better off undergoing contrast-enhanced magnetic resonance angiography (CEMRA) or digital subtraction angiography (DSA).
Finally, MDCTA is an accurate technique to evaluate the patency after revascularization procedures [43]. The technique can be used in the evaluation of acute ischemia, e.g., after a revascularization procedure or in thrombo-embolic disease (Fig. 10). For aneurysmatic popliteal artery disease or entrapment syndromes of the popliteal artery, MDCTA is the preferred imaging modality (Fig. 11) [55].
Fig. 10a, b.
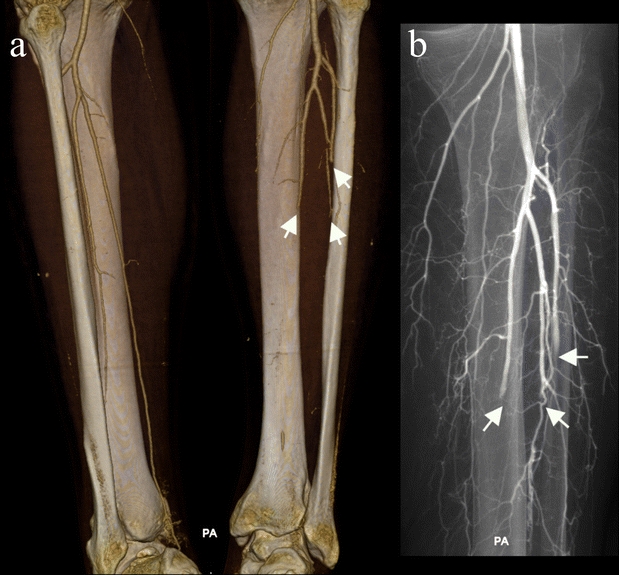
Acute thrombosis of the crural arteries in a 53-year-old woman with an acutely cold left leg after stopping anticoagulation therapy. The patient refused angiography. (a) VRT image (posteroanterior view) of MDCTA at the level of the crural arteries shows abrupt stoppage of arterial opacification in the left peroneal, anterior, and posterior tibial artery (arrows). The contralateral right crural arteries are patent. (b) Selective anterograde DSA image (posteroanterior view) confirms the occlusions of the three left crural arteries (arrows) due to thrombo-embolisms
Fig. 11a–d.
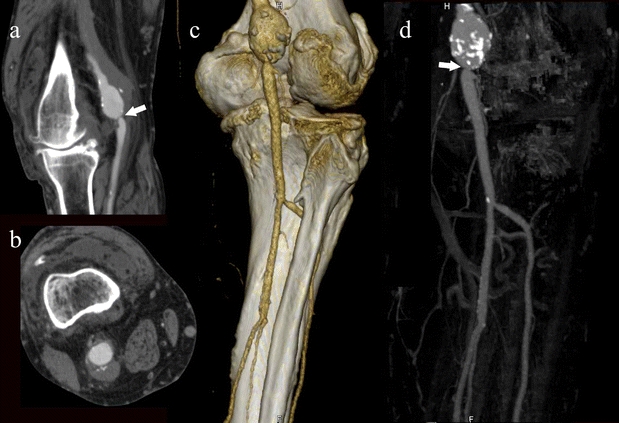
A 56-year old male patient who had a history of deep venous thrombosis with intermittent claudication of the right lower extremity. (a and b) Thin MIP image shows an aneurysmatic right popliteal artery with a tight stenosis distally. (c) VRT and volume MIP (d) confirm these findings and show patent proximal crural arteries
Conclusion
Multi-detector row CT angiography (MDCTA) is an outstanding non-invasive imaging test in the evaluation of patients with peripheral arterial disease (PAD) and is currently the modality of choice in patients with intermittent claudication. The technique can be used in the evaluation of patency after revascularization procedures and in acute ischemia. MDCTA has been shown to have high diagnostic performance and reproducibility in evaluating peripheral arterial disease (PAD). MDCTA reduces diagnostic costs and provides adequate information for decision making. The most important drawback is the limited lumen evaluation of extensive calcified arteries. MDCTA appears to be clinically less valuable in critical limb ischemia because of extensive crural artery calcifications.
Acknowledgments
This study was funded by the Netherlands Organization for Scientific Research, grant number 904-66-091. The authors also wish to thank our radiological technologists RT1 and RT2 for their excellent scanning and postprocessing work.
Abbreviations
- PAD
peripheral arterial disease
- CT
computed tomography
- MDCT
multi-detector row computed tomography
- MDCTA
multi-detector row computed tomography angiography
- 4D-CT
four-detector row computed tomography
- 16D-CT
sixteen-detector row computed tomography
- 64D-CT
sixty-four detector row computed tomography
- DSA
digital subtraction angiography
- 3D
three-dimensional
- MIP
maximum intensity projection
- MPR
multiplanar reformat
- CPR
curved planar reformat
- VR
volume rendered
Footnotes
From the Program for the Assessment of Radiological Technology (ART Program).
References
- 1.Richter CS, Biamino G, Ragg C, Felix R (1994) CT angiography of the pelvic arteries. Eur J Radiol 19:25–31 [DOI] [PubMed]
- 2.Lawrence JA, Kim D, Kent KC, Stehling MK, Rosen MP, Raptopoulos V (1995) Lower extremity spiral CT angiography versus catheter angiography. Radiology 194:903–908 [DOI] [PubMed]
- 3.Raptopoulos V, Rosen MP, Kent KC, Kuestner LM, Sheiman RG, Pearlman JD (1996) Sequential helical CT angiography of aortoiliac disease. AJR Am J Roentgenol 166:1347–1354 [DOI] [PubMed]
- 4.Rieker O, Düber C, Neufang A, Pitton M, Schweden F, Thelen M (1997) CT angiography versus intraarterial digital subtraction angiography for assessment of aortoiliac occlusive disease. AJR Am J Roentgenol 169:1133–1138 [DOI] [PubMed]
- 5.Rieker O, Düber C, Schmiedt W, von Zitzewitz H, Schweden F, Thelen M (1996) Prospective comparison of CT angiography of the legs with intraarterial digital subtraction angiography. AJR Am J Roentgenol 166:269–276 [DOI] [PubMed]
- 6.Kramer SC, Gorich J, Aschoff AJ, Orend KH, Mickley V, Sokiranski R, Brambs HJ, Rilinger N (1998) Diagnostic value of spiral-CT angiography in comparison with digital subtraction angiography before and after peripheral vascular intervention. Angiology 49:599–606 [DOI] [PubMed]
- 7.Tins B, Oxtoby J, Patel S (2001) Comparison of CT angiography with conventional arterial angiography in aortoiliac occlusive disease. Br J Radiol 74:219–225 [DOI] [PubMed]
- 8.Bourlet P, De Fraissinnette B, Garcier JM, Lipiecka E, Privat C, Ravel A, Franconi JM, Boyer L (2000) Comparative assessment of helical CT-angiography, 2D TOF MR-angiography and 3D gadolinium enhanced MRA in aorto-iliac occlusive disease (in French). J Radiol 81:1619–1625 [PubMed]
- 9.Willmann JK, Baumert B, Schertler T, Wildermuth S, Pfammatter T, Verdun FR, Seifert B, Marincek B, Bohm T (2005) Aortoiliac and lower extremity arteries assessed with 16-detector row CT angiography: prospective comparison with digital subtraction angiography. Radiology 236:1083–1093 [DOI] [PubMed]
- 10.Schertler T, Wilermuth S, Alkadhi H, Kruppa M, Marincek B, Boehm T (2005) Sixteen-detector row CT angiography for lower-leg arterial occlusive disease: analysis of section width. Radiology 237:649–656 [DOI] [PubMed]
- 11.Ouwendijk R, Kock MCJM, Visser K, Pattynama PM, de Haan MW, Myriam Hunink MG (2005) Interobserver agreement for the interpretation of contrast-enhanced 3D MR angiography and MDCT angiography in peripheral arterial disease. AJR Am J Roentgenol 185:1261–1267 [DOI] [PubMed]
- 12.Rubin GD, Schmidt AJ, Logan LJ, Sofilos MC (2001) Multi-detector row CT angiography of lower extremity arterial inflow and runoff: initial experience. Radiology 221:146–158 [DOI] [PubMed]
- 13.Puls R, Knollmann F, Werk M, Gebauer B, Gaffke G, Steinkamp H, Stroszczynski C, Felix R (2001) Multi-slice spiral CT: 3D CT angiography for evaluating therapeutically relevant stenosis in peripheral arterial occlusive disease (in German). Rontgenpraxis 54:141–147 [PubMed]
- 14.Ofer A, Nitecki SS, Linn S, Epelman M, Fischer D, Karram T, Litmanovich D, Schwartz H, Hoffman A, Engel A (2003) Multidetector CT angiography of peripheral vascular disease: a prospective comparison with intraarterial digital subtraction angiography. AJR Am J Roentgenol 180:719–724 [DOI] [PubMed]
- 15.Martin ML, Tay KH, Flak B, Fry PD, Doyle DL, Taylor DC, Hsiang YN, Machan LS (2003) Multidetector CT angiography of the aortoiliac system and lower extremities: a prospective comparison with digital subtraction angiography. AJR Am J Roentgenol 180:1085–1091 [DOI] [PubMed]
- 16.Heuschmid M, Krieger A, Beierlein W, Luz O, Kuettner A, Kopp AF, Claussen CD, Seemann MD (2003) Assessment of peripheral arterial occlusive disease: comparison of multislice-CT angiography (MS-CTA) and intraarterial digital subtraction angiography (IA-DSA). Eur J Med Res 8:389–396 [PubMed]
- 17.Romano M, Amato B, Markabaoui K, Tamburrini O, Salvatore M (2004) Multidetector row computed tomographic angiography of the abdominal aorta and lower limbs arteries: a new diagnostic tool in patients with peripheral arterial occlusive disease. Minerva Cardioangiol 52:9–17 [PubMed]
- 18.Romano M, Mainenti PP, Imbriaco M, Amato B, Markabaoui K, Tamburrini O, Salvatore M (2004) Multidetector row CT angiography of the abdominal aorta and lower extremities in patients with peripheral arterial occlusive disease: diagnostic accuracy and interobserver agreement. Eur J Radiol 50:303–308 [DOI] [PubMed]
- 19.Ota H, Takase K, Igarashi K, Chiba Y, Haga K, Saito H, Takahashi S (2004) MDCT compared with digital subtraction angiography for assessment of lower extremity arterial occlusive disease: importance of reviewing cross-sectional images. AJR Am J Roentgenol 182:201–209 [DOI] [PubMed]
- 20.Mesurolle B, Qanadli SD, El Hajjam M, Goeau-Brissonniere OA, Mignon F, Lacombe P (2004) Occlusive arterial disease of abdominal aorta and lower extremities: comparison of helical CT angiography with transcatheter angiography. Clin Imaging 28:252–260 [DOI] [PubMed]
- 21.Catalano C, Fraioli F, Laghi A, Napoli A, Bezzi M, Pediconi F, Danti M, Nofroni I, Passariello R (2004) Infrarenal aortic and lower-extremity arterial disease: diagnostic performance of multi-detector row CT angiography. Radiology 231:555–563 [DOI] [PubMed]
- 22.Edwards AJ, Wells IP, Roobottom CA (2005) Multidetector row CT angiography of the lower limb arteries: a prospective comparison of volume-rendered techniques and intra-arterial digital subtraction angiography. Clin Radiol 60:85–95 [DOI] [PubMed]
- 23.Portugaller HR, Schoellnast H, Hausegger KA, Tiesenhausen K, Amann W, Berghold A (2004) Multislice spiral CT angiography in peripheral arterial occlusive disease: a valuable tool in detecting significant arterial lumen narrowing? Eur Radiol 14:1681–1687 [DOI] [PubMed]
- 24.Poletti PA, Rosset A, Didier D, Bachmann P, Verdun FR, Rutschmann O, Vallee JP, Terrier F, Khatchatourov G (2004) Subtraction CT angiography of the lower limbs: a new technique for the evaluation of acute arterial occlusion. AJR Am J Roentgenol 183:1445–1448 [DOI] [PubMed]
- 25.Kock MCJM, Adriaensen MEAPM, Pattynama PMT, van Sambeek MRHM, van Urk H, Stijnen T, Myriam Hunink MG (2005) DSA versus multi-detector row CT angiography in peripheral arterial disease: randomized controlled trial. Radiology 237:727–737 [DOI] [PubMed]
- 26.Fleischmann D, Rubin GD (2005) Quantification of intravenously administered contrast medium transit through the peripheral arteries: implications for CT angiography. Radiology 236:1076–1082 [DOI] [PubMed]
- 27.Polak JF (1997) Femoral arteriography. In: Baum S (ed) Abrams’ angiography. Little, Brown, Boston, Massachusetts, pp 1697–1742
- 28.Fleischmann D, Hallett RL, Rubin GD (2006) CT angiography of peripheral arterial disease. J Vasc Interv Radiol 17:3–26 [DOI] [PubMed]
- 29.Boll DT, Lewin JS, Fleiter TR, Duerk JL, Merkle EM (2004) Multidetector CT angiography of arterial inflow and runoff in the lower extremities: a challenge in data acquisition and evaluation. J Endovasc Ther 11:144–151 [DOI] [PubMed]
- 30.Bui TD, Gelfand D, Whipple S, Wilson SE, Fujitani RM, Conroy R, Pham H, Gordon IL (2005) Comparison of CT and catheter arteriography for evaluation of peripheral arterial disease. Vasc Endovascular Surg 39:481–490 [DOI] [PubMed]
- 31.Fraioli F, Catalano C, Napoli A, Francone M, Venditti F, Danti M, Pediconi F, Passariello R (2006) Low-dose multidetector-row CT angiography of the infra-renal aorta and lower extremity vessels: image quality and diagnostic accuracy in comparison with standard DSA. Eur Radiol 16:137–146 [DOI] [PubMed]
- 32.Jakobs TF, Wintersperger BJ, Becker CR (2004) MDCT-imaging of peripheral arterial disease. Semin Ultrasound CT MR 25:145–155 [DOI] [PubMed]
- 33.Meyer BC, Ribbe C, Kruschewski M, Wolf KJ, Albrecht T (2005) 16-row multidetector CT angiography of the aortoiliac system and lower extremity arteries: contrast enhancement and image quality using a standarized examination protocol. Rofo 177:1562–1570 [DOI] [PubMed]
- 34.Schertler T, Wildermuth S, Alkadhi H, Kruppa M, Marincek B, Boehm T (2005) Sixteen-detector row CT angiography for lower-leg arterial occlusive disease: analysis of section width. Radiology 237:649–656 [DOI] [PubMed]
- 35.Stueckle CA, Haegele KF, Jendreck M, Zipser MC, Kirchner J, Kickuth R, Liermann D (2004) Multislice computed tomography angiography of the abdominal arteries: comparison between computed tomography angiography and digital subtraction angiography findings in 52 cases. Australas Radiol 48:142–147 [DOI] [PubMed]
- 36.Walter F, Leyder B, Fays J, Bronner J, Lehalle B, Blum A, Roland J (2001) Value of arteriography scanning in lower limb artery evaluation: a preliminary study (in French). J Radiol 82:473–479 [PubMed]
- 37.Cademartiri F, van der Lugt A, Luccichenti G, Pavone P, Krestin GP (2002) Parameters affecting bolus geometry in CTA: a review. J Comput Assist Tomogr 26:598–607 [DOI] [PubMed]
- 38.Wintersperger B, Jakobs T, Herzog P, Schaller S, Nikolaou K, Suess C, Weber C, Reiser M, Becker C (2005) Aorto-iliac multidetector-row CT angiography with low kV settings: improved vessel enhancement and simultaneous reduction of radiation dose. Eur Radiol 15:334–341 [DOI] [PubMed]
- 39.Huda W, Ravenel JG, Scalzetti EM (2002) How do radiographic techniques affect image quality and patient doses in CT? Semin Ultrasound CT MR 23:411–422 [DOI] [PubMed]
- 40.Flohr TG, Schaller S, Stierstorfer K, Bruder H, Ohnesorge BM, Schoepf UJ (2005) Multi-detector row CT systems and image-reconstruction techniques. Radiology 235:756–773 [DOI] [PubMed]
- 41.Mulkens TH, Bellinck P, Baeyaert M, Ghysen D, Van Dijck X, Mussen E, Venstermans C, Termote J-L (2005) Use of an automatic exposure control mechanism for dose optimization in multi-detector row CT examinations: clinical evaluation. Radiology 237:213–223 [DOI] [PubMed]
- 42.Kalender WA, Wolf H, Suess C, Gies M, Greess H, Bautz WA (1999) Dose reduction in CT by on-line tube current control: principles and validation on phantoms and cadavers. Eur Radiol 9:323–328 [DOI] [PubMed]
- 43.Willmann JK, Mayer D, Banyai M, Desbiolles LM, Verdun FR, Seifert B, Marincek B, Weishaupt D (2003) Evaluation of peripheral arterial bypass grafts with multi-detector row CT angiography: comparison with duplex US and digital subtraction angiography. Radiology 229:465–474 [DOI] [PubMed]
- 44.Murabito JM, Evans JC, D’Agostino RB Sr, Wilson PW, Kannel WB (2005) Temporal trends in the incidence of intermittent claudication from 1950 to 1999. Am J Epidemiol 162:430–437 [DOI] [PubMed]
- 45.Hooi JD, Stoffers HE, Kester AD, van Ree JW, Knottnerus JA (2002) Peripheral arterial occlusive disease: prognostic value of signs, symptoms, and the ankle-brachial pressure index. Med Decis Making 22:99–107 [DOI] [PubMed]
- 46.Muluk SC, Muluk VS, Kelley ME, Whittle JC, Tierney JA, Webster MW, Makaroun MS (2001) Outcome events in patients with claudication: a 15-year study in 2777 patients. J Vasc Surg 33:251–257; discussion 257–258 [DOI] [PubMed]
- 47.Suzuki S, Furui S, Kaminaga T, Yamauchi T, Kuwahara S, Yokoyama N, Suzuki M, Isshiki T (2005) Evaluation of coronary stents in vitro with CT angiography: effect of stent diameter, convolution kernel, and vessel orientation to the z-axis. Circ J 69:1124–1131 [DOI] [PubMed]
- 48.Ouwendijk R, Kock MCJM, van Dijk LC, van Sambeek MRHM, Stijnen T, Myriam Hunink MG (2006) Vessel wall calcifications at multi-detector row CT angiography in patients with peripheral arterial disease: effect on clinical utility and clinical predictors. Radiology 241:603–608 [DOI] [PubMed]
- 49.van Straten M, Venema HW, Streekstra GJ, Reekers JA, den Heeten GJ, Grimbergen CA (2003) Removal of arterial wall calcifications in CT angiography by local subtraction. Med Phys 30:761–770 [DOI] [PubMed]
- 50.Keller D, Wildermuth S, Boehm T, Boskamp T, Mayer D, Schuster HL, Marincek B, Alkadhi H (2006) CT angiography of peripheral arterial bypass grafts: accuracy and time-effectiveness of quantitative image analysis with an automated software tool. Acad Radiol 13:610–620 [DOI] [PubMed]
- 51.Gouny P, Verhaeghe A, Nonent M, Gueret G, Badra A (2005) Multi-detector row computed tomography angiography: an alternative imaging method for surgical strategy in lower extremity arterial occlusive disease. Acta Chir Belg 105:592–601 [DOI] [PubMed]
- 52.Visser K, Kock MCJM, Kuntz KM, Donaldson MC, Gazelle GS, Myriam Hunink MG (2003) Cost-effectiveness targets for multi-detector row CT angiography in the work-up of patients with intermittent claudication. Radiology 227:647–656 [DOI] [PubMed]
- 53.Visser K, de Vries SO, Kitslaar PJ, van Engelshoven JMA, Myriam Hunink MG (2003) Cost-effectiveness of diagnostic imaging work-up and treatment for patients with intermittent claudication in The Netherlands. Eur J Vasc Endovasc Surg 25:213–223 [DOI] [PubMed]
- 54.Ouwendijk R, de Vries M, Pattynama PM, van Sambeek MR, de Haan MW, Stijnen T, van Engelshoven JMA, Myriam Hunink MG (2005) Imaging peripheral arterial disease: a randomized controlled trial comparing contrast-enhanced MR angiography and multi-detector row CT angiography. Radiology 236:1094–1103 [DOI] [PubMed]
- 55.Beregi JP, Djabbari M, Desmoucelle F, Willoteaux S, Wattinne L, Louvegny S (1997) Popliteal vascular disease: evaluation with spiral CT angiography. Radiology 203:477–483 [DOI] [PubMed]
- 56.Ishikawa M, Morimoto N, Sasajima T, Kubo Y (1999) Three-dimensional computed tomographic angiography in lower extremity revascularization. Surg Today 29:243–247 [DOI] [PubMed]
- 57.Willmann JK, Wildermuth S, Pfammatter T, Roos JE, Seifert B, Hilfiker PR, Marincek B, Weishaupt D (2003) Aortoiliac and renal arteries: prospective intraindividual comparison of contrast-enhanced three-dimensional MR angiography and multi-detector row CT angiography. Radiology 226:798–811 [DOI] [PubMed]
- 58.Visser K, Bosch JL, Leiner T, van Engelshoven JMA, Passchier J, Myriam Hunink MG (2003) Patients’ preferences for MR angiography and duplex US in the work-up of peripheral arterial disease. Eur J Vasc Endovasc Surg 26:537–543 [DOI] [PubMed]
- 59.Maintz D, Tombach B, Juergens K-U, Weigel S, Heindel W, Fischbach R (2002) Revealing in-stent stenoses of the iliac arteries: comparison of multidetector CT with MR angiography and digital radiographic angiography in a Phantom model. AJR Am J Roentgenol 179:1319–1322 [DOI] [PubMed]