Abstract
Background and aims
The integrity of motor pathways and functional connectivity patterns are important in assessing plastic changes related to successful recovery, to obtain prognostic information and to monitor future therapeutic strategies of stroke patients. We tested the following hypotheses: (1) that changes in axonal integrity along the corticospinal tract after stroke can be detected as a reduction in fractional anisotropy; and (2) that sustained low fractional anisotropy is indicative of axonal loss and therefore is correlated with poor motor outcome, as measured by specific neurological motor scores.
Methods
We developed a segmentation tool based on magnetic resonance diffusion tensor imaging in conjunction with three dimensional fibretracking for longitudinal studies of the corticospinal tract, and used specific neurological motor scores to test the hypotheses in five stroke patients within the first week and 30 and 90 days after the stroke.
Results
Reduction in fractional anisotropy within the first weeks after stroke reflected a decline in axonal integrity, leading to Wallerian degeneration, and demonstrated a correlation between the temporal evolution of fractional anisotropy and motor function in patients with poor motor outcome.
Conclusion
The study demonstrated the feasibility of fibretracking as a segmentation tool for mapping distal parts of the corticospinal motor pathways and showed that fractional anisotropy in the segmented corticospinal tract is a sensitive measure of structural changes after stroke.
Studies on the recovery of cerebral grey matter after stroke with positron emission tomography,1,2,3 functional MRI4,5,6 or transcranial magnetic stimulation7,8 demonstrate that the adult brain is capable of regeneration and compensation for motor deficits after ischaemia. However, the integrity of the underlying motor pathways is crucial in understanding the dynamics of cortical activation patterns and qualitatively the substrate of successful recovery in individual patients. The recent introduction of magnetic resonance diffusion tensor imaging (DTI) allows the characterisation of the integrity of the white matter tract by recording the diffusion characteristics of water molecules in the highly organised environment of hydrophobic myelin sheets. White matter fibre orientation can be inferred by measuring the preferred direction of water movements and the course of fibre tracts subsequently visualised by so called “fibretracking”. The extent to which myelin sheets directs water diffusion along a specific direction is parameterised by the fractional anisotropy (FA) index. FA values have been measured in studies of both healthy subjects and chronic stroke patients.9,10,11 In the latter, reduced FA values measured distally to the infarct were low, interpreted as evidence of axonal loss and Wallerian degeneration (WD). In stroke patients,12,13,14 DTI tracks the pyramidal fibres in their craniocaudal course and delineates lesions to motor fibres in relation to existing neurological deficits. A recent study demonstrated a clear prognostic value of the procedure by showing that the degree of corticospinal involvement in the infarcts is related directly to stroke severity, and inversely to functional recovery.15 Furthermore, DTI revealed changes consistent with WD within the first 2 weeks of the insult, thus proving that this technique detects structural changes earlier than conventional T2 and proton density magnetic resonance images.16,17
In the present study, we developed a fibretracking based technique to segment the corticospinal tract on initial DTI images and, using this volume as a template and in a longitudinal setting, to monitor FA from the early phase in stroke patients. Using specific neurological scores, we then studied patients, testing the hypothesis that sustained low FA values associate with poor motor outcome.
Methods
Patients
Five right‐handed, first time stroke patients, aged 51–65 years (four men and one woman), with subcortical infarcts in the area of the internal capsule and/or corona radiata, underwent MRI in the early phase (1–4 days) and 30 and 90 days after the stroke, and were tested clinically with the Medical Research Council (MRC) Scale, the Motor Assessment Scale (MAS),18 the Scandinavian Stroke Scale19 and Barthel's Index.20 (MAS is a scale of eight areas of motor function, including advanced movements of the hand.) On admission, various degrees of motor impairment were diagnosed in all five patients, with an average MRC value (upper extremity) ranging from 2.3 to 4.6 and an MAS score (upper extremity) of 0–10.
Patients were treated in accordance with standard guidelines for stroke patient management. The study was approved by the official institutional medical ethics committee and written informed consent was obtained from all patients. The criteria for inclusion were first time stroke with subcortical lesions, mild to moderate hemiparesis and the ability of the patient or relative to give consent in writing after oral information. Exclusion criteria: subarachnoid or intracerebral haemorrhage, dementia, severe fluent aphasia, degenerative or progressive neurological disease (multiple sclerosis, amyotrophic lateral sclerosis, tumour, hydrocephalus), severe diseases of the heart, liver or kidneys, age younger than 25 years, clinical depression (Hamilton Depression Rating Scale score >18), treatment with CNS active medication or clinical status such that participation in the trial was deemed too strenuous.
MRI/data processing
T1 and T2 weighted imaging, diffusion weighted imaging, and fluid attenuated inversion recovery (FLAIR) and DTI sequences were obtained with a 1.5 T GE Signa System MR scanner (GE Medical Systems, Milwaukee, Wisconsin, USA).
DTI was performed with a birdcage head coil and double spin echo single shot EPI.
The diffusion encoding scheme consisted of 17 directions isotropically distributed in space, with a b‐factor of 1000 s/mm2. In addition, two b‐factor = 0 s/mm2 images were acquired. The maximum gradient strength was kept at 36 mT/m. Fifty slice locations of slice thickness 3.3 mm were acquired, using 24 cm FOV in a 128×128 matrix (TR/TE = 17000/84 ms). Four repeated scans were performed and acquisition time was 22 min. In addition, T1 weighted three dimensional imaging and diffusion weighted imaging, T2, FLAIR and MR angiograms were also acquired with a total scan time of 55 min.
Data analysis
Diffusion weighted images were corrected for eddy current distortion.21 Diffusion tensors were calculated in each voxel of the brain using a linear least squares regression method. The symmetric positive definite 3×3 matrix was diagonalised to find the eigen system, the principal eigen vector and the FA value for each voxel. Regions of interest (ROIs) were manually outlined on the ADC and FA maps independently by three raters. To standardise the localisation of the ROIs, a general procedure, defined by one of the raters, was used in the drawing of ROIs. The selection of ROIs was repeated three times by one rater and performed once by three raters, showing reproducible and concordant results regarding both intra‐rater and inter‐rater result variability (results not shown). The presented FA values are based on ROIs defined by rater No 1. One ROI was placed in the ventral part of the cerebral peduncle, and another ROI in the posterior limb of the internal capsule. Fibre tracking between ROI 1 and ROI 2 was performed. The tracked part of the corticospinal tract consisted, on average, of 250 voxels on both the ipsilesional and contralesional sides. Fibretracking was performed by the Fibre Assignment by Continuous Tracking (FACT) algorithm,22 a FA threshold of 0.15 as a stop criterion, separating white from grey, and an angle between adjacent diffusion directions above 42°.23
FA maps calculated from the 30 and 90 day follow‐up scans were co‐registered to the initial FA map using the mritoself program from the MINC suite (McConnell Brain Imaging Center, Montreal Neurological Institute, McGill University, Canada). Based on the alignment of the anatomical images, the program co‐registrated FA maps and allowed extraction of the corticospinal volume for each longitudinal scan for each patient based on the segmentation from the initial scan. The mean FA values of the corticospinal tract were then calculated, and the distribution between 0 and 1 calculated by a kernel density estimation. In addition, average FA values of each tracking were calculated, and the spatial evolution of the FA values was visualised by maps showing FA values along the corticospinal tract.
Results
Clinical data
Table 1 shows the evolution of motor function in the five patients measured by specific motor scales from baseline and throughout the 90 days of recovery. MAS evaluates the function of the upper extremity, in contrast with the MRC Scale which measures muscle strength. All patients had leucoaraiosis present on MRI FLAIR sequences (not shown) and small vessel disease but the group was otherwise heterogeneous.
Table 1 Clinical and demographic data.
| Patient No/sex | 1/M | 2/M | 3/F | 4/M | 5/M |
| Age (y) | 51 | 57 | 64 | 55 | 65 |
| Risk factors* | S | 0 | HA, HC, S | HA, S, Cl | S |
| Localisation of infarct | Striatocapsular dex | Centrum semiovale dex | Infarcts subcortically sin | Corona radiate sin | Internal capsule dex |
| Scan time | Day 4 | Day 1 | Day 2 | Day 3 | Day 4 |
| MRC1†/SSS1‡ | 2.30/36 | 3.87/50 | 4.60/54 | 3.92/52 | 2.97/46 |
| MRC2/SSS2 | 2.19/36 | 4.55/56 | 5.00/58 | 4.45/56 | 3.97/52 |
| MRC3/SSS3 | 2.44/41 | 4.80/58 | 5.00/58 | 4.61/56 | 4.75/55 |
| Barthel1¶ | 20 | 70 | 95 | 95 | 60 |
| Barthel2 | 50 | 100 | 100 | 100 | 100 |
| Barthel3 | 60 | 100 | 100 | 100 | 95 |
| MAS1§ | 0 | 6 | 10 | 5 | 1 |
| MAS2 | 3 | 15 | 18 | 10 | 10 |
| MAS3 | 3 | 18 | 18 | 17 | 12 |
*Cl, Claudicatio intermittens; HA, hypertension arterialis; HC, hypercholesterolaemia; S, smoking.
†MRC, Medical Research Council Scale (0 = no movement, 5 = normal muscle strength), average value of both upper and lower extremities.
‡SSS, Scandinavian Stroke Scale (0–58).
¶Barthel, modified Barthel (0–100).
§MAS, Motor Assessment Scale (upper extremity 0–18).
Neurological scores performed on admission = 1, after 30 days = 2 and after 90 days = 3.
Patient No 1 suffered from a deep infarct in the middle cerebral artery presenting with a sustained moderate left hemiparesis. The patient regained the ability to walk but the function of the arm remained poor (MAS of 3). Patient Nos 2, 3 and 4 had smaller infarcts in the area of the corona radiata with mild to moderate impairment, especially of the upper extremity, with generally excellent recovery. Patient No 5 had a lesion of the internal capsule and deficits of the upper extremity remaining after 90 days with a low MAS score of 12 but an MRC score of 4.75.
Fractional anisotropy
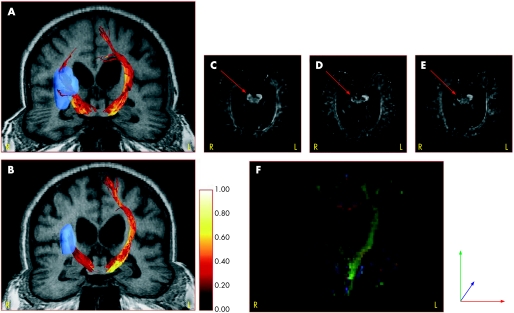
Figure 1 shows the dynamic changes in FA values in the corticospinal fibres (fig 1A, B) and the corresponding conventional FA maps (fig 1C–F) from day 4 to day 90 in patient No 1 who suffered from a deep middle artery infarct and severe neurological impairment. The tracked corticospinal fibres demonstrated a colour coded shift towards darker intensities on the right side, reflecting a decrease in FA values along the fibres. Similar changes were found on the FA maps after 30 and 90 days, showing a decrease in the grey scale intensity on the affected side of the cerebral peduncle. The coronal FA colour map (fig 1F) visualises the affection of the right ipsilesional tract anterograde and retrograde to the infarct.
Figure 1 Temporal changes in fractional anisotropy (FA) values in corticospinal fibres and corresponding FA maps in patient No 1. (A, B) FA values along the tracked corticospinal fibres (high values in bright colours) and a deep middle cerebral artery infarct (blue colour) on the right side at day 4 and day 90. The FA values in (A, B) were colour coded according to the colour bar to the right of (B). (C–E) FA maps showing the cerebral peduncle with low intensity on the affected right side at day 30 and day 90 (red arrows). (F) Coronal colour FA map at day 90.
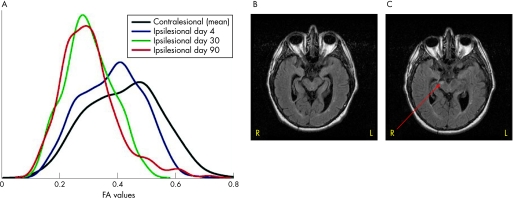
In fig 2A, the temporal changes in the distribution of the FA values in all voxels are shown for patient No 1. The black line is the mean FA values in the contralesional corticospinal tract obtained on three scanning sessions. The initial FA values showed a distribution with a maximum close to 0.4, suggesting that myelin fails to maintain anistropic water diffusion in the corticospinal tract. At day 30 and day 90, a shift towards lower FA values was seen on the ipsilesional side with peaks close to 0.30. For comparison, structural changes on the MRI FLAIR sequence are shown as a hyperintensity in the affected peduncle after 90 days (fig 2C) but no changes were found at day 30 (fig 2B).
Figure 2 Dynamic changes in the segmented voxels in the distribution of fractional anisotropy (FA) values in patient No 1 compared with fluid attenuated inversion recovery (FLAIR) images after 30 and 90 days. Changes in the distribution of FA values after 4, 30 and 90 days along with the mean value of the contralesional side are shown in (A). (B, C) Structural FLAIR images with visible hyperintensity in the affected right cerebral peduncle after 90 days (red arrow).
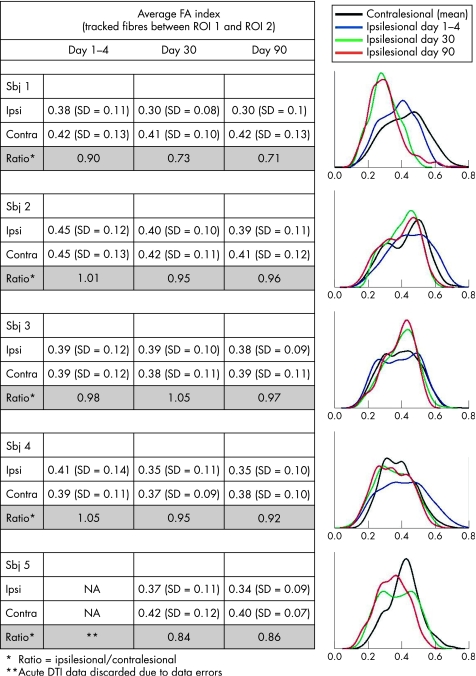
The table in fig 3 lists the average FA values of the corticospinal tract, showing a decline in the ratio (ipsi/contralesional side) in patient No 1 from 0.90 to 0.70, discrete reduction in patient Nos 2, 3 and 4, but always above 0.90, and an FA index ratio in patient No 5 close to 0.85 at 30 and 90 days. The corresponding distribution of FA values in each patient is shown in fig 3. In patient Nos 2 and 4, a more subtle shift towards lower FA values was noted only on the ipsilesional side and no differences were found in patient No 3. In patient No 5, as in patient No 1, a shift towards lower FA values was seen in the follow‐up scans but no early phase data were available because of data errors. The corresponding FLAIR images of patient Nos 2–4 did not show any hyperintensities in the areas of and between the ROIs. The patients all suffered from small vessel disease, and FLAIR images showed subcortical and periventricular white matter changes. However, FLAIR images of patient No 5 after 30 and 90 days showed a small hyperintense area within the cerebral peduncle on the right side (images not shown), as well as subcortical changes.
Figure 3 Average fractional anisotropy (FA) values and corresponding values for FA distribution in all patients. The average FA values in voxels between region of interest (ROI) 1 and ROI 2 and the ratio (ipsi/contralesional side) (right side) are shown. Temporal change in the distribution of FA values in five patients (left side) is also shown.
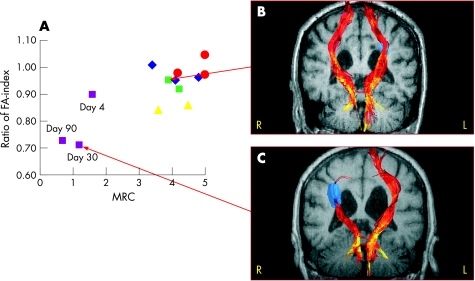
The association between the FA ratio and motor function measured by the MRC Scale on days 1–4, 30 and 90 is illustrated in fig 4A. Good recovery according to the MRC Scale is defined as MRC ⩾4. In our study, patients with good recovery all had FA ratios above 0.85 whereas the patient with a persistently low MRC score demonstrated a decline in the FA ratio from 0.90 (at day 4) to 0.70 (at days 30 and 90). In fig 4B and C, magnetic resonance images with tracked corticospinal fibres are shown for patients Nos 1 and 4 at day 30, each representing either a good or a poor motor outcome.
Figure 4 Dynamic changes in fractional anisotropy (FA) index along the corticospinal tract correlated with motor function (Medical Research Council (MRC) scale). (Pink squares = patient No 1, dark blue diamond = patient No 2, red circles = patient No 3, green squares = patient 4 and yellow triangles = patient 5). Corresponding fibretracking images in two patients (B, C). The fibretracts were colour coded according to the FA values along the tracts using the same colour bar as in fig 1A, B.
Discussion
This longitudinal study of the correlation between FA values of the corticospinal tract and motor outcome supports the claim that the FA index is a sensitive measure of structural change after stroke; reduction in FA reflects deterioration of axonal integrity leading to axonal loss and WD. The results further reveal an association between the temporal evolution of FA indices and motor function with (i) decline in the FA values in patients with poor motor outcome and (ii) good recovery in a patient with an FA index ratio (ipsi/contralesional) above 0.85.
Our study confirms the notion that a decrease in FA values is a potential early marker of ongoing degeneration of axons compared with more conventional imaging with T2 and FLAIR sequences.15 The data obtained after 1 and 3 months were very similar, suggesting that the change in FA values occurs weeks after the onset of stroke, but repeated scans at shorter intervals after stroke are needed to elucidate the more precise dating and degree of reversibility or irreversibility of these changes.
The study suggests that changes in FA values reflect more permanent damage to the pathways, as seen in the patients with sustained neurological impairments and anterograde structural changes on FLAIR and T2 after 3 months. A study of DTI in chronic stroke patients10 also found that low FA values, compared with contralesional values, was a sign of WD, and that DTI was more sensitive than T2.
Differential patterns of recovery were found in the present study; thus patient No 3 recovered fully within days while patient No 1 continued to improve throughout the period of rehabilitation, presumably by means of preservation of original motor fibres and formation or activation of alternate networks. This patient regained the ability to walk, despite severe disruption of fibres in the affected internal capsule and basal ganglia.
The present fibretracking method is capable of depicting anatomical changes that correlate with motor function estimated by the crude MRC Scale. The MAS covers not only muscle strength but also motor skills and thus is a measure of more complex regeneration, including changes in connectivity, which is not yet measurable with available fibretracking techniques.
The study demonstrates the feasibility of fibretracking as a segmentation tool for mapping distal parts of the corticospinal motor pathways, including both the pyramidal tract and fibres from associated regions of the supplementary motor area and premotor cortex. Co‐alignment with subacute scans allows detailed studies to be made of the temporal evolution of degenerative changes in the corticospinal tract. Furthermore, because of the high resolution of the technique, the integrity of the pathways can be assessed by evaluating FA values along and across tracked fibres.
The study would have benefited from inclusion of more patients, representing varying age groups and degrees of neurological deficits. There are also several limitations in the choice of the fibretracking method and of fibretracking in general. The technique cannot reliably detect fibre orientation in areas with low FA values in and adjacent to the infarct, especially as oedema and necrosis alters tissue microstructure over time. Furthermore, current techniques fail to track fibres in areas with crossing fibre bundles (eg, in the crossing with the longitudinal superficial fasciculus and the arcuate fibres below the cortex). Because of these restrictions, only distal parts of the motor pathway were investigated.
The results nevertheless confirm that fibretracking and the application of FA values can segment motor pathways, and demonstrate degenerative changes consistent with WD induced by larger lesions.
The method is standardised and reproducible and may be useful as a future tool for monitoring therapeutic strategies in stroke patients, after thorough testing in other centres. To further target the connectivity of brain areas involved in recovery after stroke and other neurodegenerative diseases, combined DTI fibretracking and functional MRI with the execution of motor tasks is a tempting avenue to experimentally demonstrate adaptive plastic changes.
Abbreviations
DTI - diffusion tensor imaging
FA - fractional anisotropy
FLAIR - fluid attenuated inversion recovery
MAS - Motor Assessment Scale
MRC Scale - Medical Research Council Scale
ROI - region of interest
WD - Wallerian degeneration
Footnotes
Competing interests: None.
References
- 1.Carey L M, Abbott D F, Egan G F.et al Motor impairment and recovery in the upper limb after stroke: behavioral and neuroanatomical correlates. Stroke 200536625–629. [DOI] [PubMed] [Google Scholar]
- 2.Calautti C, Leroy F, Guincestre J Y.et al Dynamics of motor network overactivation after striatocapsular stroke: a longitudinal PET study using a fixed‐performance paradigm. Stroke 2001322534–2542. [DOI] [PubMed] [Google Scholar]
- 3.Chollet F, DiPiero V, Wise R J.et al The functional anatomy of motor recovery after stroke in humans: a study with positron emission tomography. Ann Neurol 19912963–71. [DOI] [PubMed] [Google Scholar]
- 4.Ward N S, Brown M M, Thompson A J.et al Neural correlates of motor recovery after stroke: a longitudinal fMRI study. Brain 20031262476–2496. [DOI] [PMC free article] [PubMed] [Google Scholar]
- 5.Tombari D, Loubinoux I, Pariente J.et al A longitudinal fMRI study: in recovering and then in clinically stable sub‐cortical stroke patients. Neuroimage 200423827–839. [DOI] [PubMed] [Google Scholar]
- 6.Calautti C, Baron J C. Functional neuroimaging studies of motor recovery after stroke in adults: a review. Stroke 2003341553–1566. [DOI] [PubMed] [Google Scholar]
- 7.Traversa R, Cicinelli P, Bassi A.et al Mapping of motor cortical reorganization after stroke. A brain stimulation study with focal magnetic pulses. Stroke 199728110–117. [DOI] [PubMed] [Google Scholar]
- 8.Foltys H, Kemeny S, Krings T.et al The representation of the plegic hand in the motor cortex: a combined fMRI and TMS study. Neuroreport 200011147–150. [DOI] [PubMed] [Google Scholar]
- 9.Virta A, Barnett A, Pierpaoli C. Visualizing and characterizing white matter fiber structure and architecture in the human pyramidal tract using diffusion tensor MRI. Magn Reson Imaging 1999171121–1133. [DOI] [PubMed] [Google Scholar]
- 10.Pierpaoli C, Barnett A, Pajevic S.et al Water diffusion changes in Wallerian degeneration and their dependence on white matter architecture. Neuroimage 2001131174–1185. [DOI] [PubMed] [Google Scholar]
- 11.Werring D J, Toosy A T, Clark C A.et al Diffusion tensor imaging can detect and quantify corticospinal tract degeneration after stroke. J Neurol Neurosurg Psychiatry 200069269–272. [DOI] [PMC free article] [PubMed] [Google Scholar]
- 12.Kunimatsu A, Aoki S, Masutani Y.et al Three‐dimensional white matter tractography by diffusion tensor imaging in ischaemic stroke involving the corticospinal tract. Neuroradiology 200345532–535. [DOI] [PubMed] [Google Scholar]
- 13.Yamada K, Mori S, Nakamura H.et al Fiber‐tracking method reveals sensorimotor pathway involvement in stroke patients. Stroke 200334E159–E162. [DOI] [PubMed] [Google Scholar]
- 14.Konishi J, Yamada K, Kizu O.et al MR tractography for the evaluation of functional recovery from lenticulostriate infarcts. Neurology 200564108–113. [DOI] [PubMed] [Google Scholar]
- 15.Thomalla G, Glauche V, Koch M A.et al Diffusion tensor imaging detects early Wallerian degeneration of the pyramidal tract after ischemic stroke. Neuroimage 2004221767–1774. [DOI] [PubMed] [Google Scholar]
- 16.Kuhn M J, Mikulis D J, Ayoub D M.et al Wallerian degeneration after cerebral infarction: evaluation with sequential MR imaging. Radiology 1989172179–182. [DOI] [PubMed] [Google Scholar]
- 17.Orita T, Tsurutani T, Izumihara A.et al Early, evolving Wallerian degeneration of the pyramidal tract in cerebrovascular diseases: MR study. J Comput Assist Tomogr 199418943–946. [DOI] [PubMed] [Google Scholar]
- 18.Carr J H, Shepherd R B, Nordholm L.et al Investigation of a new motor assessment scale for stroke patients. Phys Ther 198565175–180. [DOI] [PubMed] [Google Scholar]
- 19.Scandinavian Stroke Study Group Multicenter trial of hemodilution in ischemic stroke—background and study protocol. Stroke 198516885–890. [DOI] [PubMed] [Google Scholar]
- 20.Mahoney F I, Barthel D W. Functional evaluation: The barthel index. Md State Med J 19651461–65. [PubMed] [Google Scholar]
- 21.Haselgrove J C, Moore J R. Correction for distortion of echo‐planar images used to calculate the apparent diffusion coefficient. Magn Reson Med 199636960–964. [DOI] [PubMed] [Google Scholar]
- 22.Mori S, Crain B J, Chacko V P.et al Three‐dimensional tracking of axonal projections in the brain by magnetic resonance imaging. Ann Neurol 199945265–269. [DOI] [PubMed] [Google Scholar]
- 23.Mori S, Itoh R, Zhang J.et al Diffusion tensor imaging of the developing mouse brain. Magn Reson Med 20014618–23. [DOI] [PubMed] [Google Scholar]


