

Abstract
Background
The 10th revision of the International Classification of Diseases (ICD) represents a major change in the ICD system. This paper investigates the impact on relative risk estimates of inconsistencies in outcome classification between ICD‐9 and ICD‐10, including scenarios in which occupational exposure levels are correlated with year of death (and therefore with the ICD revision in effect at death). The setting of interest is a cohort mortality study in which follow up spans the periods during which ICD‐9 and ICD‐10 were in effect. The relative risk estimate obtained when death certificates are coded to the ICD revision in effect at time of death is compared to the relative risk estimate that would be obtained if all death certificates were coded to a consistent ICD revision (that is, ICD‐10). The ratio of these relative risks is referred to as the coefficient of bias.
Methods
Simple equations relate the coefficient of bias to the sensitivity and specificity of the classification of decedents into categories of cause of death via ICD‐9 (treating classifications based upon ICD‐10 as the standard). Bridge coded mortality data for 2 296 922 decedents (that is, death certificates coded to ICD‐9 and ICD‐10) are used to derive estimates of sensitivity and specificity by category of cause of death. Numerical examples illustrate the application of these equations.
Results
Estimates of the sensitivity of classification of decedents into categories of death defined by ICD‐9 ranged from 0.26–1.00. Specificity was above 0.98 for all categories of cause of death. Numerical examples illustrate that inconsistencies in outcome classification between ICD‐9 and ICD‐10 may have substantial impact on relative risk estimates if there is a strong relation between exposure status and the proportion of deaths coded to a given ICD revision.
Conclusions
For analyses of mortality outcomes that exhibit poor comparability between ICD‐9 and ‐10, it may be prudent to recode cause of death information to a standard ICD revision in order to avoid bias that can occur when exposures are correlated with the proportion of deaths coded to a given ICD revision.
Keywords: death certificates, cause of death, occupational mortality, epidemiologic methods
Mortality outcomes for occupational cohort research often are defined in terms of underlying causes of death coded according to the International Classification of Diseases (ICD). The use of ICD coding of cause of death information allows investigators to conduct analyses using a standardised methodology for coding the textual cause of death information on the death certificate and it provides investigators a standardised methodology for selection of a single underlying cause of death from a set of listed causes.1
However, roughly once every decade a new revision of the ICD is adopted. As a result, methodologies for coding cause of death information change over time, as do rules for selection of the underlying cause of death. The adoption of the 10th revision of the ICD is particularly noteworthy, as ICD‐10 marks a significant departure from the previous revisions both in form and structure.2 Consequently, the rationale that use of the ICD permits the conduct of epidemiological analyses following a standardised methodology for coding (and selection) of underlying cause of death information may be undermined by the periodic revisions to ICD, particularly substantial revisions such as that from ICD‐9 to ICD‐10.
One way for epidemiologists to address this problem is to code all death certificates for decedents in a study population to a standard revision of the ICD (for example, ICD‐10). Such an approach ensures that death certificates with the same listed causes of death are assigned to the same categories of death regardless of the ICD revision in effect at the time of death. However, there are often good reasons for not coding all death certificates to a single revision of the ICD. For example, for analyses that compare mortality rates in a study population to an external referent population via the standardised mortality ratio, cause of death information is preferably tabulated to contemporaneous revisions of the ICD (as is done for calculation of referent rates at the state and national level). Furthermore, there are practical obstacles to coding all death certificates to a standard ICD revision. The investigator must obtain copies of all death certificates so that these may be coded by a trained nosologist to a standard ICD revision. The collection of death certificates for epidemiological research has become less common as access to national databases of cause of death information, such as the US National Death Index, have made it more efficient to obtain cause of death information from a national death registry. Since cause of death information in the US national death registry is coded to the contemporaneous revision of the ICD, the investigator may not have the ability to recode cause of death information to different versions of the ICD.
The objective of this paper is to evaluate the impact on relative risk estimates of the transition from ICD‐9 to ICD‐10. Data from a large comparability study are used to assess the classification of decedents into categories of death defined by ICD‐9 and ‐10 codes. Simple equations relate the impact on relative risk estimates to the sensitivity and specificity of the classification of decedents into categories of cause of death via ICD‐9 (treating classifications based upon ICD‐10 as the standard); numerical examples illustrate the impact on relative risk estimates of coding death certificates to contemporaneous revisions of ICD‐9 and ICD‐10, rather than coding all certificates to a standard ICD revision.
Methods
Consider a hypothetical study comparing disease risk in two groups within a closed cohort followed to extinction. Let's say that study outcomes are classified in terms of categories of cause of death using information on underlying cause of death coded to ICD‐10; we can denote the observed risk in the exposed subgroup as r1, and the observed risk in the unexposed group as r0, where r1 and r0 denote incidence proportions.
Now, consider the scenario in which some of the decedents have their underlying cause of death information coded to ICD‐9 rather than ICD‐10. Let's say that a proportion, P1, of those in the exposed subcohort is coded to ICD‐9, while the remainder is coded to ICD‐10; similarly, a proportion, P0, of those in the unexposed subcohort is coded to ICD‐9. If outcome classifications based upon ICD‐10 serves as our standard then we can refer to the sensitivity (Se) and specificity (Sp) of outcome classifications that occur when using cause of death information coded to ICD‐9.
Among the exposed subcohort, therefore, the sensitivity of case classification will be Se1 = (1−P1)+Se* P1; the specificity of case classification among the exposed can be expressed as Sp1 = (1−P1)+Sp* P1. Similarly, among the unexposed the sensitivity and specificity of case classification can be expressed as Se0 = (1−P0)+Se* P0 and Sp0 = (1−P0)+Sp* P0, respectively.
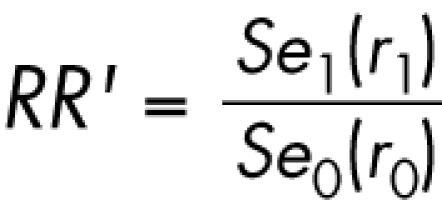
An analysis of these data would yield an estimate of risk in the exposed subgroup, r′1 = Se1(r1)+(1−Sp1)(1−r1); an estimate of risk among the unexposed, r′0 = Se0 (r0)+(1−Sp0)(1−r0); and a risk ratio estimate of RR′ = r′1/r′0.
Given that RR reflects the relative risk estimate that would be observed if all deaths were coded to ICD‐10, and RR′ reflects the relative risk estimate obtained when proportions P1 and P0 of the deaths in the exposed and unexposed subgroups, respectively, are coded to ICD‐9, the ratio, RR′/RR, may be referred to as a coefficient of bias in the relative risk estimate due to inconsistencies in outcome classification between ICD‐9 and ICD‐10.
Estimates of Se and Sp are shown in table 1. These values were obtained via analyses of comparability (that is, bridge coding) data. All US death certificates for 1996 were originally coded and classified according to ICD‐9; a comparability file was created by appending ICD‐10 codes to each record in the 1996 mortality file. 99.1% of the 2 318 212 records are coded by both ICD‐9 and ICD‐10. For the purposes of the comparability study 130 mortality outcomes were defined along with comparable ranges of ICD‐9 and ICD‐10 codes for each mortality outcome.2 The list of outcomes and associated ICD‐9 and ICD‐10 codes is shown in the online Appendix I (see http://www.occenvmed.com/supplemental). Table 1 reports the numbers of decedents classified into disease categories by ICD‐9 only, ICD‐10 only, ICD‐9 and ‐10, as well as estimates of Se and Sp (rounded to three decimal places) for 130 outcomes.
Table 1 Classification of 2 296 922 deaths into categories defined by underlying cause of death coded to ICD‐9 and ICD‐10.
| Category of death | Number of decedents classified into disease category by ICD‐9 and ICD‐10 | Number of decedents classified into disease category by ICD‐9 only | Number of decedents classified into disease category by ICD‐10 only | Sensitivity* | Specificity* |
|---|---|---|---|---|---|
| Salmonella infections | 46 | 12 | 6 | 0.885 | 1.000 |
| Shigellosis and amebiasis | 6 | 2 | 1 | 0.857 | 1.000 |
| Certain other intestinal infections | 458 | 361 | 246 | 0.651 | 1.000 |
| Respiratory tuberculosis | 753 | 159 | 104 | 0.879 | 1.000 |
| Other tuberculosis | 169 | 120 | 32 | 0.841 | 1.000 |
| Whooping cough | 4 | 0 | 2 | 0.667 | 1.000 |
| Scarlet fever and erysipelas | 1 | 2 | 0 | 1.000 | 1.000 |
| Meningococcal infection | 270 | 18 | 15 | 0.947 | 1.000 |
| Septicemia | 20074 | 1262 | 5316 | 0.791 | 0.999 |
| Syphilis | 39 | 34 | 18 | 0.684 | 1.000 |
| Acute poliomyelitis | 0 | 0 | 1 | – | 1.000 |
| Arthropod‐borne viral encephalitis | 2 | 1 | 0 | 1.000 | 1.000 |
| Measles | 1 | 0 | 0 | 1.000 | 1.000 |
| Viral hepatitis | 2567 | 1202 | 126 | 0.953 | 0.999 |
| Human immunodeficiency virus (HIV) disease | 30631 | 273 | 2810 | 0.916 | 1.000 |
| Malaria | 5 | 0 | 0 | 1.000 | 1.000 |
| Other and unspecified infectious and parasitic diseases and their sequelae | 3402 | 2876 | 2314 | 0.595 | 0.999 |
| Malignant neoplasms of lip, oral cavity, and pharynx | 7179 | 656 | 340 | 0.955 | 1.000 |
| Malignant neoplasm of oesophagus | 10914 | 285 | 225 | 0.980 | 1.000 |
| Malignant neoplasm of stomach | 12983 | 309 | 402 | 0.970 | 1.000 |
| Malignant neoplasms of colon, rectum, and anus | 54833 | 1458 | 1388 | 0.975 | 0.999 |
| Malignant neoplasms of liver and intrahepatic bile ducts | 10911 | 631 | 215 | 0.981 | 1.000 |
| Malignant neoplasm of pancreas | 26776 | 392 | 313 | 0.988 | 1.000 |
| Malignant neoplasm of larynx | 3706 | 201 | 221 | 0.944 | 1.000 |
| Malignant neoplasms of trachea, bronchus, and lung | 147147 | 4426 | 2059 | 0.986 | 0.998 |
| Malignant melanoma of skin | 6732 | 527 | 160 | 0.977 | 1.000 |
| Malignant neoplasm of breast | 42474 | 853 | 1170 | 0.973 | 1.000 |
| Malignant neoplasm of cervix uteri | 4394 | 140 | 123 | 0.973 | 1.000 |
| Malignant neoplasms of corpus uteri and uterus, part unspecified | 6054 | 238 | 390 | 0.939 | 1.000 |
| Malignant neoplasm of ovary | 12825 | 300 | 218 | 0.983 | 1.000 |
| Malignant neoplasm of prostate | 33044 | 964 | 1453 | 0.958 | 1.000 |
| Malignant neoplasms of kidney and renal pelvis | 10720 | 348 | 308 | 0.972 | 1.000 |
| Malignant neoplasm of bladder | 10926 | 480 | 424 | 0.963 | 1.000 |
| Malignant neoplasms of meninges, brain, and other parts of central nervous system | 11667 | 664 | 385 | 0.968 | 1.000 |
| Hodgkin's disease | 1309 | 95 | 99 | 0.930 | 1.000 |
| Non‐Hodgkin's lymphoma | 21730 | 1135 | 647 | 0.971 | 1.000 |
| Leukaemia | 19674 | 622 | 833 | 0.959 | 1.000 |
| Multiple myeloma and immunoproliferative neoplasms | 9965 | 258 | 700 | 0.934 | 1.000 |
| Other and unspecified malignant neoplasms of lymphoid, haematopoietic, and related tissue | 0 | 0 | 72 | – | 1.000 |
| All other and unspecified malignant neoplasms | 54700 | 2261 | 10106 | 0.844 | 0.999 |
| In situ neoplasms, benign neoplasms, and neoplasms of uncertain or unknown behaviour | 6517 | 1090 | 5894 | 0.525 | 1.000 |
| Anaemias | 3574 | 743 | 497 | 0.878 | 1.000 |
| Diabetes mellitus | 59674 | 1811 | 2999 | 0.952 | 0.999 |
| Malnutrition | 2492 | 1015 | 1043 | 0.705 | 1.000 |
| Other nutritional deficiencies | 117 | 54 | 187 | 0.385 | 1.000 |
| Meningitis | 681 | 64 | 73 | 0.903 | 1.000 |
| Parkinson's disease | 11263 | 534 | 653 | 0.945 | 1.000 |
| Alzheimer's disease | 20597 | 695 | 13070 | 0.612 | 1.000 |
| Acute rheumatic fever and chronic rheumatic heart diseases | 3911 | 1065 | 476 | 0.891 | 1.000 |
| Hypertensive heart disease | 20405 | 5568 | 334 | 0.984 | 0.998 |
| Hypertensive heart and renal disease | 2017 | 473 | 789 | 0.719 | 1.000 |
| Acute myocardial infarction | 207911 | 5081 | 2005 | 0.990 | 0.998 |
| Other acute ischaemic heart diseases | 2329 | 547 | 755 | 0.755 | 1.000 |
| Atherosclerotic cardiovascular disease, so described | 64335 | 3815 | 7896 | 0.891 | 0.998 |
| All other forms of chronic ischaemic heart disease | 251673 | 7037 | 6159 | 0.976 | 0.997 |
| Acute and subacute endocarditis | 735 | 103 | 129 | 0.851 | 1.000 |
| Diseases of pericardium and acute myocarditis | 650 | 64 | 100 | 0.867 | 1.000 |
| Heart failure | 45832 | 1220 | 3044 | 0.938 | 0.999 |
| All other forms of heart disease | 89569 | 16104 | 8577 | 0.913 | 0.993 |
| Essential (primary) hypertension and hypertensive renal disease | 11814 | 1070 | 2567 | 0.822 | 1.000 |
| Cerebrovascular diseases | 154524 | 4331 | 12313 | 0.926 | 0.998 |
| Atherosclerosis | 15363 | 1292 | 723 | 0.955 | 0.999 |
| Aortic aneurysm and dissection | 16011 | 350 | 360 | 0.978 | 1.000 |
| Other diseases of arteries, arterioles, and capillaries | 8119 | 2627 | 1014 | 0.889 | 0.999 |
| Other disorders of circulatory system | 2379 | 1828 | 1726 | 0.580 | 0.999 |
| Influenza | 712 | 31 | 31 | 0.958 | 1.000 |
| Pneumonia | 55687 | 26615 | 1485 | 0.974 | 0.988 |
| Acute bronchitis and bronchiolitis | 302 | 172 | 40 | 0.883 | 1.000 |
| Unspecified acute lower respiratory infection | 0 | 0 | 119 | – | 1.000 |
| Bronchitis, chronic and unspecified | 1066 | 2061 | 141 | 0.883 | 0.999 |
| Emphysema | 15457 | 1722 | 1064 | 0.936 | 0.999 |
| Asthma | 4687 | 927 | 284 | 0.943 | 1.000 |
| Other chronic lower respiratory diseases | 77435 | 2056 | 9612 | 0.890 | 0.999 |
| Pneumoconioses and chemical effects | 1074 | 61 | 80 | 0.931 | 1.000 |
| Pneumonitis due to solids and liquids | 9685 | 579 | 1653 | 0.854 | 1.000 |
| Other diseases of respiratory system | 16293 | 2328 | 4383 | 0.788 | 0.999 |
| Peptic ulcer | 4748 | 379 | 231 | 0.954 | 1.000 |
| Diseases of appendix | 367 | 54 | 43 | 0.895 | 1.000 |
| Hernia | 1257 | 134 | 151 | 0.893 | 1.000 |
| Alcoholic liver disease | 10420 | 1542 | 1551 | 0.870 | 0.999 |
| Other chronic liver disease and cirrhosis | 11972 | 927 | 1716 | 0.875 | 1.000 |
| Cholelithiasis and other disorders of gall bladder | 2565 | 251 | 141 | 0.948 | 1.000 |
| Acute and rapidly progressive nephritic and nephrotic syndrome | 182 | 138 | 26 | 0.875 | 1.000 |
| Chronic glomerulonephritis, nephritis, and nephropathy not specified as acute or chronic, and renal sclerosis unspecified | 603 | 1026 | 67 | 0.900 | 1.000 |
| Renal failure | 21255 | 969 | 8232 | 0.721 | 1.000 |
| Other disorders of kidney | 29 | 13 | 7 | 0.806 | 1.000 |
| Infections of kidney | 796 | 89 | 109 | 0.880 | 1.000 |
| Hyperplasia of prostate | 428 | 27 | 34 | 0.926 | 1.000 |
| Inflammatory diseases of female pelvic organs | 91 | 21 | 9 | 0.910 | 1.000 |
| Pregnancy with abortive outcome | 32 | 7 | 9 | 0.780 | 1.000 |
| Other complications of pregnancy, childbirth, and the puerperium | 214 | 32 | 70 | 0.754 | 1.000 |
| Certain conditions originating in the perinatal period | 12555 | 361 | 1337 | 0.904 | 1.000 |
| Congenital malformations, deformations, and chromosomal abnormalities | 9525 | 2215 | 989 | 0.906 | 0.999 |
| Symptoms, signs, and abnormal clinical and laboratory findings, not elsewhere classified | 22496 | 3010 | 2381 | 0.904 | 0.999 |
| All other diseases (residual) | 128432 | 32240 | 18414 | 0.875 | 0.985 |
| Motor vehicle accidents | 40525 | 2512 | 476 | 0.988 | 0.999 |
| Other land transport accidents | 678 | 51 | 1932 | 0.260 | 1.000 |
| Water, air and space, and other and unspecified transport accidents and their sequelae | 1967 | 320 | 208 | 0.904 | 1.000 |
| Falls | 10215 | 3701 | 528 | 0.951 | 0.998 |
| Accidental discharge of firearms | 1026 | 6 | 23 | 0.978 | 1.000 |
| Accidental drowning and submersion | 3312 | 128 | 230 | 0.935 | 1.000 |
| Accidental exposure to smoke, fire, and flames | 3539 | 110 | 108 | 0.970 | 1.000 |
| Accidental poisoning and exposure to noxious substances | 7859 | 94 | 377 | 0.954 | 1.000 |
| Other and unspecified nontransport accidents and their sequelae | 10107 | 489 | 5705 | 0.639 | 1.000 |
| Intentional self‐harm (suicide) by discharge of firearms | 17791 | 93 | 114 | 0.994 | 1.000 |
| Intentional self‐harm (suicide) by other and unspecified means and their sequelae | 11927 | 96 | 142 | 0.988 | 1.000 |
| Assault (homicide) by discharge of firearms | 13809 | 46 | 72 | 0.995 | 1.000 |
| Assault (homicide) by other and unspecified means and their sequelae | 6207 | 78 | 92 | 0.985 | 1.000 |
| Legal intervention | 297 | 31 | 10 | 0.967 | 1.000 |
| Discharge of firearms, undetermined intent | 220 | 2 | 2 | 0.991 | 1.000 |
| Other and unspecified events of undetermined intent and their sequelae | 2482 | 78 | 41 | 0.984 | 1.000 |
| Operations of war and their sequelae | 5 | 7 | 2 | 0.714 | 1.000 |
| Complications of medical and surgical care | 1136 | 1897 | 776 | 0.594 | 0.999 |
*Treating classifications based upon ICD‐10 as the standard.
Numerical example
Numerical examples are provided for three categories of cause of death: lung cancer, renal failure, and essential hypertension. Coefficients of bias are derived under assumptions that P0 and P1 took values equal to 0.0, 0.2, 0.4, 0.6, 0.8, and 1.0. For the purposes of these examples, the baseline risk (r0) for each outcome was specified as 0.05 and RR (that is, r1/r0) was specified as 2.0. Results are easily computed for alternative assumptions; however, estimates of the coefficient of bias are not influenced by assumptions about RR, and, for categories of cause of death with Sp near unity, estimates of the coefficient of bias are minimally influenced by assumptions about the magnitude of the baseline risk (see Appendix II).
Results
Table 1 reports estimates of sensitivity and specificity of outcome classifications made via ICD‐9 relative to classifications made via ICD‐10 coding of underlying cause of death information. The sensitivity of classification of decedents into categories of death defined by underlying cause of death coded according to ICD‐9 ranged from 0.26–1.00. For deaths due to external causes and infectious diseases sensitivity ranged from 0.26–1.00 and 0.6 –1.00, respectively; for cancer deaths, sensitivity tended to be fairly high (that is, greater than 0.90). Specificity was above 0.98 for all categories of cause of death.
Table 2 presents estimates of the coefficient of bias for estimates of the relative risk of lung cancer. The rows and columns of the table define various assumptions about the proportions of decedents for whom cause of death information was coded to ICD‐9. By definition, the coefficient of bias equals 1.00 for the cell defined by P0 = 0.0 and P1 = 0.0 (that is, no decedents were coded to ICD‐9 in either the exposed or unexposed subgroups).
Table 2 Hypothetical data. Coefficients of bias* for analyses of the relative risk of lung cancer mortality under varying assumptions about the proportion of exposed decedents (P1) coded to ICD‐9 rather than ICD‐10 and the proportion of unexposed decedents (P0) coded to ICD‐9 rather than ICD‐10.
| P1 | P0 | |||||
|---|---|---|---|---|---|---|
| 0.0 | 0.2 | 0.4 | 0.6 | 0.8 | 1.0 | |
| 0.0 | 1.00 | 1.00 | 1.00 | 1.00 | 1.00 | 1.00 |
| 0.2 | 1.00 | 1.00 | 1.00 | 1.00 | 1.00 | 1.00 |
| 0.4 | 0.99 | 0.99 | 0.99 | 0.99 | 0.99 | 0.99 |
| 0.6 | 0.99 | 0.99 | 0.99 | 0.99 | 0.99 | 0.99 |
| 0.8 | 0.98 | 0.98 | 0.98 | 0.98 | 0.98 | 0.99 |
| 1.0 | 0.98 | 0.98 | 0.98 | 0.98 | 0.98 | 0.98 |
*The ratio of the relative risk estimate obtained when death certificates are coded to the ICD revision in effect at time of death to the relative risk estimate that would be obtained if all death certificates were coded to ICD‐10.
In an occupational setting, exposure status may be related to the proportion of deaths coded to ICD‐9 versus ICD‐10. For example, if occupational exposures tended to be higher in earlier calendar periods than in later calendar periods then exposure status may be related to year of death (and consequently, P1 may be greater than P0). An extreme scenario is one in which all deaths among the exposed are coded to ICD‐9 (P1 = 1) and all deaths among the unexposed are coded to ICD‐10 (P0 = 0). Under this scenario, the estimate of the association between exposure and death due to lung cancer is very comparable to the relative risk estimate that would be obtained if all deaths were coded to ICD‐10 (coefficient of bias = 1.00). An alternative, equally extreme scenario is one in which all deaths among the exposed are coded to ICD‐10 (P1 = 0) and all deaths among the unexposed are coded to ICD‐9 (P0 = 1). Under the latter scenario, the estimate of the association between exposure and death due to lung cancer is only modestly attenuated when compared to the relative risk estimate that would be obtained if all deaths were coded to ICD‐10 (coefficient of bias = 0.98). Such calculations illustrate how maximal and minimal values for the coefficient of bias may be obtained, permitting an investigator to evaluate the magnitude of bias potentially attributable to coding death certificates to contemporaneous revisions of the ICD rather than coding all certificates to a standard ICD revision.
Table 3 presents coefficient of bias for estimates of the relative risk of death due to essential hypertension. From table 3, maximal and minimal values for the coefficient of bias may be obtained. The minimal value for the coefficient of bias is 0.82 (for the scenario P1 = 1 and P0 = 0), while the maximal value for the coefficient of bias is 1.22. Table 4 presents coefficient of bias for estimates of the relative risk of death due to renal failure. Under the scenario (P1 = 1 and P0 = 0) the minimal value for the coefficient of bias is 0.72 while under the scenario (P1 = 0 and P0 = 1) the coefficient of bias is 1.39.
Table 3 Hypothetical data. Coefficients of bias* for analyses of the relative risk of mortality due to essential hypertension under varying assumptions about the proportion of exposed decedents (P1) coded to ICD‐9 rather than ICD‐10 and the proportion of unexposed decedents (P0) coded to ICD‐9 rather than ICD‐10.
| P1 | P0 | |||||
|---|---|---|---|---|---|---|
| 0.0 | 0.2 | 0.4 | 0.6 | 0.8 | 1.0 | |
| 0.0 | 1.00 | 0.96 | 0.93 | 0.89 | 0.86 | 0.82 |
| 0.2 | 1.04 | 1.00 | 0.96 | 0.93 | 0.89 | 0.85 |
| 0.4 | 1.08 | 1.04 | 1.00 | 0.96 | 0.92 | 0.89 |
| 0.6 | 1.12 | 1.08 | 1.04 | 1.00 | 0.96 | 0.92 |
| 0.8 | 1.17 | 1.12 | 1.08 | 1.04 | 1.00 | 0.96 |
| 1.0 | 1.22 | 1.17 | 1.13 | 1.09 | 1.04 | 1.00 |
*The ratio of the relative risk estimate obtained when death certificates are coded to the ICD revision in effect at time of death to the relative risk estimate that would be obtained if all death certificates were coded to ICD‐10.
Table 4 Hypothetical data. Coefficients of bias* for analyses of the relative risk of mortality due to renal failure under varying assumptions about the proportion of exposed decedents (P1) coded to ICD‐9 rather than ICD‐10 and the proportion of unexposed decedents (P0) coded to ICD‐9 rather than ICD‐10.
| P1 | P0 | |||||
|---|---|---|---|---|---|---|
| 0.0 | 0.2 | 0.4 | 0.6 | 0.8 | 1.0 | |
| 0.0 | 1.00 | 0.94 | 0.89 | 0.83 | 0.78 | 0.72 |
| 0.2 | 1.06 | 1.00 | 0.94 | 0.88 | 0.82 | 0.76 |
| 0.4 | 1.13 | 1.06 | 1.00 | 0.94 | 0.87 | 0.81 |
| 0.6 | 1.20 | 1.13 | 1.07 | 1.00 | 0.93 | 0.87 |
| 0.8 | 1.29 | 1.22 | 1.14 | 1.07 | 1.00 | 0.93 |
| 1.0 | 1.39 | 1.31 | 1.23 | 1.15 | 1.08 | 1.00 |
*The ratio of the relative risk estimate obtained when death certificates are coded to the ICD revision in effect at time of death to the relative risk estimate that would be obtained if all death certificates were coded to ICD‐10.
Discussion
Over the last century, there have been 10 revisions of the ICD. Information about the degree of consistency in disease classification when cause of death information is coded to different revisions of the ICD is of direct relevance to understanding of potential bias in results obtained from epidemiological research on mortality outcomes. This paper focuses on the period spanned by ICD revisions 9 and 10;3 this encompasses the period of coverage of the US National Death Index (NDI) and therefore is of direct relevance to US researchers who rely upon the NDI for collection of cause of death information. ICD‐10 is much more detailed than ICD‐9. Three additional chapters have been added to the ICD and some chapters rearranged, and cause of death titles (and some coding rules) have been changed.2 The use of bridge coded data offers a way to assess the sensitivity and specificity of outcome classification using categories of death defined in relation to ICD‐9 and 10 codes, specifically evaluating how events defined via death certificate information coded to ICD‐9 would be classified if the death certificate information were coded to ICD‐10. As illustrated via numerical examples in this paper, maximal and minimal values for the coefficient of bias may be obtained, providing a sense of the magnitude of bias potentially attributable to coding death certificates to contemporaneous revisions of the ICD.
It can be shown (Appendix II) that the maximal and minimal bounds for the coefficient of bias are approximately Se and 1/Se, corresponding to the extreme scenarios in which there is perfect concordance between exposure status and ICD revision. For most cancer outcomes, as illustrated by the numerical example for lung cancer, there is minimal potential for bias due to outcome misclassification. Even in scenarios where there is a strong correlation between exposure status and the proportion of deaths coded to a given ICD revision, the coefficient of bias will be very near unity. For some non‐cancer outcomes, in contrast, there is potential for substantial bias under scenarios in which exposure status is highly correlated with the proportion of deaths coded to ICD‐9, as illustrated by the numerical examples for deaths due to essential hypertension and deaths due to renal disease.
For simplicity, our examples focused on the scenario of estimation of incidence proportions in a closed cohort followed to extinction. Often, of course, in a cohort mortality study incidence rates are estimated and a proportion of the cohort survives to the end of follow up. The equations presented in the Methods section are readily adapted from incidence proportions to incidence rates (Appendix III) accommodating the scenario in which a portion of the cohort remains alive at the end of follow up. Following the arguments in Appendix II, it can be shown that the maximal and minimal bounds for the coefficient of bias in analyses of incident rate ratios are approximately Se and 1/Se. Also for simplicity, this paper focused solely on evaluating the impact on relative risk estimates of inconsistencies in outcome classification between ICD‐9 and ICD‐10. It is not uncommon for the period of follow up in a cohort study to span several ICD revisions (for example, ICD‐8, ‐9, and ‐10). While the transition from ICD‐8 to ICD‐9 was not as significant as the transition from ICD‐9 to ICD‐10, further work could be done to assess the impact on relative risk estimates of outcome misclassification when cause of death data are coded to a series of earlier ICD revisions. It is plausible that the sensitivity and specificity of classification of decedents (treating classifications based upon ICD‐10 as the standard) would be progressively poorer as one considered deaths coded to progressively earlier ICD revisions. As observed in this paper, inconsistencies in outcome classification between ICD revisions might have the greatest impact on relative risk estimates if there is a strong relation between exposure status and the proportion of deaths coded to a given ICD revision.
One approach to assess potential bias due to inconsistencies in outcome classification between ICD‐9 and ICD‐10 is to stratify analyses into time periods during which deaths were coded to a single standard ICD revision. Under idealised conditions (including perfect specificity), stratification should control for this source of bias. In practice, of course, the results may be difficult to interpret because changes in effect estimates observed after stratification by calendar period of death (that is, ICD revision) may be due to factors other than bias induced by lack of comparability between ICD revisions. Therefore, the formulae in this paper (and the empirical data on sensitivity and specificity) are useful because they provide information on the potential magnitude of this bias without having to resort to stratified analyses. For example, this paper demonstrates that for most categories of cause of death, including most cancer outcomes, the potential magnitude of this source of bias is very small, and analyses that follow the standard practice of defining a mortality outcome in terms of ranges of ICD codes that span revisions (and not stratifying analyses by calendar period of death) should be appropriate. Stratification by calendar time may also constrain analytical exploration of other temporal factors (such as variation in exposure effect with time since exposure). Therefore, for epidemiological investigations that focus on categories of cause of death that exhibit poor comparability of outcome classification between ICD revisions, recoding cause of death information to a standard ICD revision may be the most straightforward approach to eliminating this potential source of bias.
The analyses in this paper consider a list of categories of cause of death (defined in terms of ICD‐9 and ICD‐10 codes) proposed by the US National Center for Health Statistics.2 Some investigators have employed different definitions of mortality outcomes than those employed in this paper (for example, they have posited slightly different ranges of ICD‐9 and/or ICD‐10 codes associated with a category of cause of death). The LTAS program released by the US National Institute of Occupational Safety and Health, for example, defines 117 minor categories of cause of death in terms of ICD codes for revisions 7 through 10; and, the program OCMAP released by the University of Pittsburgh defines 60 categories of cause of death in terms of ICD codes for revisions 6 through 10.4,5 The bridge coded data used in these analyses are publicly available (http://ftp.cdc.gov/pub/Health_Statistics/NCHS/Datasets/Comparability/icd9_icd10/); therefore, interested investigators can calculate sensitivities and specificities for different definitions of categories of cause of death. Use of different definitions of categories of cause of death could lead to estimates of sensitivity and specificity that differ from those values reported in table 1, and definitions of outcomes that exhibit greater consistency across ICD revisions should result in less overall bias. However, the general conclusions of this paper are unlikely to be substantially changed given that for many categories of death, such lung cancer and breast cancer, there is substantial consensus on the specified ranges of ICD codes associated with the category of death.
In addition to definitions of comparable ranges of ICD‐9 and ICD‐10 codes for a given category of cause of death, outcome classifications may differ depending upon the ICD revision used to code cause of death information as a result of changes between ICD revisions in rules for selection of the underlying cause of death.1,6 Consequently, use of multiple cause coding of death information should lead to greater consistency in the classification of decedents into categories of death. We found that use of multiple cause coding slightly improved the consistency of classification of decedents into categories of death (results not shown).
The impact of using deaths coded to contemporaneous revisions of the ICD (and subsequently defining categories of cause of death via appropriate ranges of ICD‐9 and ICD‐10 codes) appears to be minimal for categories of cause of death that have high levels of comparability between ICD‐9 and ICD‐10 (that is, high sensitivity and specificity values in table 1). For such outcomes, even when exposures are correlated with the proportion of deaths coded to one of the ICD revisions a small degree of bias is expected. In contrast, for categories of cause of death that exhibit low levels of comparability between ICD revisions, the relative risk estimates obtained when death certificates are coded to the ICD revision in effect at time of death may diverge substantially from the relative risk estimate that would be obtained if all death certificates were coded to a consistent ICD revision (that is, ICD‐10).
Supplementary Material
Acknowledgements
This project was supported by grant R01 OH007871 from the National Institute for Occupational Safety and Health of the Centers for Disease Control and Prevention.
Appendix II
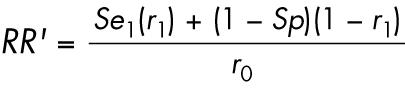
If Sp very closely approximates unity (as is the case for the categories of cause of death shown in table 1) then the expression for RR′ can be approximated as
 |
The minimal value for the coefficient of bias occurs under the scenarios in which all deaths among the exposed study subjects are coded to ICD‐9, while all deaths among the unexposed were coded to ICD‐10 (that is, P1 = 1 and P0 = 0). In this case
Se1 = (1−P1)+Se* P1 = Se,
Sp1 = (1−P1)+Sp* P1 = Sp,
Se0 = (1−P0)+Se* P0 = 1,
Sp0 = (1−P0)+Sp* P0 = 1; therefore,
 |
which, as noted above, can be approximated by
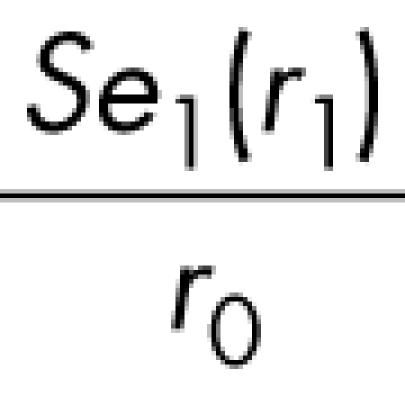 |
when Sp∼1. Therefore, the minimal value for the coefficient of bias,
 |
can be approximated by Se, the sensitivity of the outcome classification under ICD‐9 relative to ICD‐10. Following a similar argument, if Sp very closely approximates unity, the maximal value for the coefficient of bias can be approximated by
Appendix III
Consider a study comparing mortality rates, rather than incidence proportions, in two groups. Let's denote the observed mortality rate for a specified category of cause of death in the exposed subgroup as r1, and the observed rate in the unexposed group as r0, where r1 and r0 denote incidence rates. Let us further denote d1 and d0 as the death rates from all other causes. An analysis of these data would yield a rate estimate in the exposed subgroup, r′1 = Se1(r1)+(1−Sp1)(d1); a rate estimate among the unexposed, r′0 = Se0 (r0)+(1−Sp0)(d0); and, a rate ratio estimate of RR′ = r′1/r′0.
References
- 1.Israel R A, Rosenberg H M, Curtin L R. Analytical potential for multiple cause of death data. Am J Epidemiol 1986124161–179. [DOI] [PubMed] [Google Scholar]
- 2.Anderson R N, Minino A M, Hoyert D L.et al Comparability of cause of death between ICD‐9 and ICD‐10: preliminary estimates. Natl Vital Stat Rep 2001491–32. [PubMed] [Google Scholar]
- 3.Hetzel A M.History and organization of the vital statistics system. Hyattsville, Maryland: National Center for Health Statistics, 1997
- 4.Steenland K, Beaumont J, Spaeth S.et al New developments in the Life Table Analysis System of the National Institute for Occupational Safety and Health. Journal of Occupational Medicine 1990321091–1098. [DOI] [PubMed] [Google Scholar]
- 5.Marsh G M, Youk A O, Stone R A.et al OCMAP‐PLUS: a program for the comprehensive analysis of occupational cohort data. J Occup Environ Med 199840351–362. [DOI] [PubMed] [Google Scholar]
- 6.Steenland K, Nowlin S, Ryan B.et al Use of multiple‐cause mortality data in epidemiologic analyses: US rate and proportion files developed by the National Institute for Occupational Safety and Health and the National Cancer Institute. Am J Epidemiol 1992136855–862. [DOI] [PubMed] [Google Scholar]
Associated Data
This section collects any data citations, data availability statements, or supplementary materials included in this article.