

Abstract
Prior work by our group and others has implicated the basal ganglia as important in age-related differences in tasks involving motor response control. The present study used structural and functional MRI approaches to analyze this region of interest (ROI) toward better understanding the contributions of structural and functional MRI measures to understanding age-related and task performance-related cognitive differences. Eleven healthy elders were compared with 11 healthy younger adults while they completed the “go” portion of a complex Go/No-go task. Separate ROI’s in the bilateral caudate (C) and putamen/globus pallidus (PGp) were studied based upon previous findings of age-related functional MRI differences in basal ganglia for this portion of the task. Structural volumes and functional activation (in percent area under the curve during correct responses) were independently extracted for these ROI’s. Results showed that age correlated with ROI volume in bilateral PGp and C, while multiple task performance measures correlated with functional activation in the left PGp. The Go/No-go task measures were also significantly correlated with traditional attention and executive functioning measures. Importantly, fMRI activation and volumes from each ROI were not significantly inter-correlated. These findings suggest that structural and functional MRI make unique contributions to the study of performance changes in aging.
Keywords: Aging, fMRI, Imaging, Executive functioning, Attention Response execution, Motor skill
1. Introduction
Healthy aging is associated with some well characterized cognitive changes, but their etiology is not well understood. The development of in vivo neuroimaging techniques, such as functional magnetic resonance imaging (fMRI) and positron emission tomography (PET), and MRI techniques examining structural volumes (volumetric MRI—vMRI), are contributing to a better understanding of the physiological processes underlying cognitive tasks and the foundations of cognitive changes in both normal and abnormal aging. There are now various studies examining the structural integrity of the brain in aging, as well as studies examining its functional integrity. While age-related changes are evident using both approaches, few studies have concurrently examined both structural and functional integrity. Such studies are needed because some of these cognitive changes, which affect basic processes such as processing time (Salthouse, 1996), as well as more complex functions such as working memory and behavioral inhibition (Kramer et al., 1994; Langenecker et al., 2004; Park et al., 2002), might be better understood by the concurrent or differential use of these strategies.
Volume-behavior and volume-age relationships have been explored over the past two decades using vMRI. There is a body of literature indicating global volumetric decreases in elders (Mueller et al., 1998; Resnick et al., 2003); and more region-specific age-related volume reductions, most commonly involving fronto-striatal and hippocampal structures (Golomb et al., 1993; Head et al., 2002; Lupien et al., 1998; Raz et al., 1997, 2000; Tisserand et al., 2000; Van Petten, 2004). Volume reductions are related to severe general cognitive decline in pathological aging and are used diagnostically for Alzheimer’s disease (Kantarci and Jack, 2003). However, when evaluating the relationship between volumetric measurements and cognitive ability in healthy elders and across the age range, effect sizes have been weak to modest at best, with only weak relationships with subcortical, basal ganglia and hippocampal regions and weak to more moderate relationships with total volume and cortical regions, particularly dorsolateral prefrontal cortex (Andreasen et al., 1993; Egan et al., 1994, 1995; Flashman et al., 1997; MacLullich et al., 2002; Raz et al., 1993; Walhovd et al., 2005; Wickett et al., 1994; Yeo et al., 1987). Moreover, comparisons between basal ganglia volume and executive function and motor planning tasks (such as the Wisconsin Card Sorting Test) indicate only weak, yet significant relationships (Head et al., 2002). Thus, the volume-behavior literature overall suggests that other factors and more performance-specific techniques might be fruitfully pursued towards understanding the interface between brain and behavior in aging. One of these techniques might be functional brain activity, as measured by fMRI, because functional activity may be affected by different factors than is brain volume.
fMRI, developed in the 1990s, measures the hemodynamic changes within the brain areas supporting cognitive tasks. Functional neuroimaging research (i.e., fMRI and PET) with elders suggests that the specialized neural networks tend to be recruited differently with age (Cabeza, 2002). Specifically, older adults have been shown to recruit neural regions to a lesser extent than younger adults in some studies (Rypma and D’Esposito, 2000; Stebbins et al., 2002). Other studies report recruitment in some task-related regions to a comparable or lesser degree accompanied by increased activation of other regions (Cabeza et al., 2004; DiGirolamo et al., 2001; Langenecker et al., 2004; Madden et al., 2004). These areas of increased activation are frequently in homologous areas contralateral to the regions activated in younger adults, typically in the frontal lobes and basal ganglia (Nielson et al., 2002; Reuter-Lorenz, 2002; Rosen et al., 2002). Additionally, some evidence suggests that age-related increases in activation are related to better task performance (Nielson et al., 2002; Rosen et al., 2002), while other studies have found age-related activation increases related to poorer performance (Dickerson et al., 2004). Increased activation related to better performance supports a functional compensation view (see Cabeza, 2002), which is also consistent with a prominent view in the stroke literature (Cao et al., 1998, 1999; Cramer et al., 1997). Increased activation related to poor performance may suggest activation foci that interfere with optimal performance, or foci that are compensatory, but do not provide sufficient compensation to attain optimal performance levels (Langenecker and Nielson, 2003).
Only a few studies have employed functional and volumetric MRI concurrently to assess their distinct contributions to understanding cognitive performance, in aging, only one of which was in normal aging. The study that pursued vMRI and fMRI in normal aging indicated that elders had decreased activation relative to young adults in a left middle and inferior frontal gyrus cluster during a dichotic listening, working memory task and reduced volume in an overlapping anatomical area. This activation was interpreted as decreased interference resolution (e.g., decreased recruitment) between the prepotent right ear advantage and the desired left ear instruction (Thomsen et al., 2004). A second study combining functional and volumetric measurements of mild cognitive impairment demonstrated a significant difference in activation in the right parahippocampal gyrus between those who later did and did not decline in cognitive ability, but no volumetric differences between these groups (Dickerson et al., 2004). A third study comparing AD patients to healthy adults reported that AD patients had decreased activation in the left inferior frontal gyrus during semantic decision-making that was correlated with decreased volume in the region (Johnson et al., 2000). In these studies, although relationships between vMRI and fMRI were discussed, there was no exploration of the relationships between performance and volume or performance and activation. Explorations of this type may have clarified the nature of age-related differences in light of recruitment or interference interpretations.
The present study was designed to address functional and volumetric contributions to age- and performance-related differences in response control on a specific type of Go/No-go (GNG) task, focusing on the “Go” response execution activation. GNG tasks can vary greatly in the types of stimuli, the timing of stimuli, similarity of target and non-target stimuli, or proportion of “go” and “no-go” items. In fact, many use “static” or constant target and distractor stimuli throughout the task (e.g., green=go, red=stop) and these are virtually indistinguishable from continuous performance tasks. In contrast, “context-based” GNG tasks include a rule for changing or shifting the target and distractor stimuli during the test. Thus, the to-be-inhibited distracter is dependent upon the context, or previous performance and stimuli presented. Performance on context-based GNG tasks has been shown to correlate with performance on traditional executive functioning measures (e.g., Langenecker and Nielson, 2003; Nielson et al., 2002). Thus, these tasks have been purported to require attention, set-shifting, processing speed and inhibitory control (Langenecker and Nielson, 2003; Nielson et al., 2002; Langenecker et al., in press; Garavan et al., 1999).
For the present study, healthy older and younger adults performed a context-based GNG task in order to evaluate whether functional and volumetric MRI in the basal ganglia make unique contributions to understanding age- and performance-related task differences. The importance of the basal ganglia to response control (i.e., “go” responses) on GNG tasks is supported by our previous work (Langenecker and Nielson, 2003; Nielson et al., 2002; Langenecker et al., in press), and by the work of others in healthy aging (Hager et al., 1998), Parkinson’s disease (Atasoy et al., 2004; Owen, 2004), developmental disorders such as ADHD and Tourette’s syndrome (Adams et al., 2004; Casey et al., 1997; Castellanos et al., 1996; Channon et al., 2003), cerebrovascular incidents (Cao et al., 1998, 1999; Cramer et al., 1997), and vMRI studies in aging (Raz et al., 2003).
We expected poorer performance in elders relative to young adults, as well as increased basal ganglia activation in elders compared to young. Furthermore, we subdivided the basal ganglia into four vMRI regions of interest (ROI’s; left and right Caudate (C) and Putamen/Globus Pallidus (PGp)), expecting smaller structural volume in these ROIs in elders relative to younger adults. We also examined the relationships between functional activation for correct “Go” events and volume in these basal ganglia sub-regions, particularly as they relate to age and task performance, hypothesizing that functional activation would be better related to task performance than volume. The relationships between functional activation and volumes in the ROIs of interest were expected to be modest at best, supporting independent contributions of these regions to the understanding of age-related changes in cognitive functioning. Finally, relationships were explored between GNG performance and additional attention and executive functioning measures in elders toward better definition of the task and its place in the broader cognitive aging literature.
2. Results
2.1. Performance data
Older adults performed more poorly than younger adults in PCTT (Percent Correct Target Trials, F(1,20)=8.9, p=0.007, eta2=0.31), but did not differ from younger adults in PCIT (Percent Correct Inhibition Trials, F(1,20) = 0.20, p = 0.66, eta2=0.01) or RTT (Response Time to Targets, F(1,20)=0.94, p=0.34, eta2=0.05). As expected, the performance groups (defined by median split) differed in PCTT (F(1,20)=44.1, p=0.0001) and PCIT (F(1,20)=5.8, p=0.03), but not in RTT (F(1,20)=2.2, p=0.14, eta2=0.31), and with age as a covariate to control for age as a potential confound in the performance data. Fig. 1 illustrates the median split based upon PCTT performance. It should be noted that although older adults performed more poorly than young adults in PCTT, analyses of activation during these trials included only correctly performed trials, which serves to better equate the groups on performance-related activation.
Fig. 1.
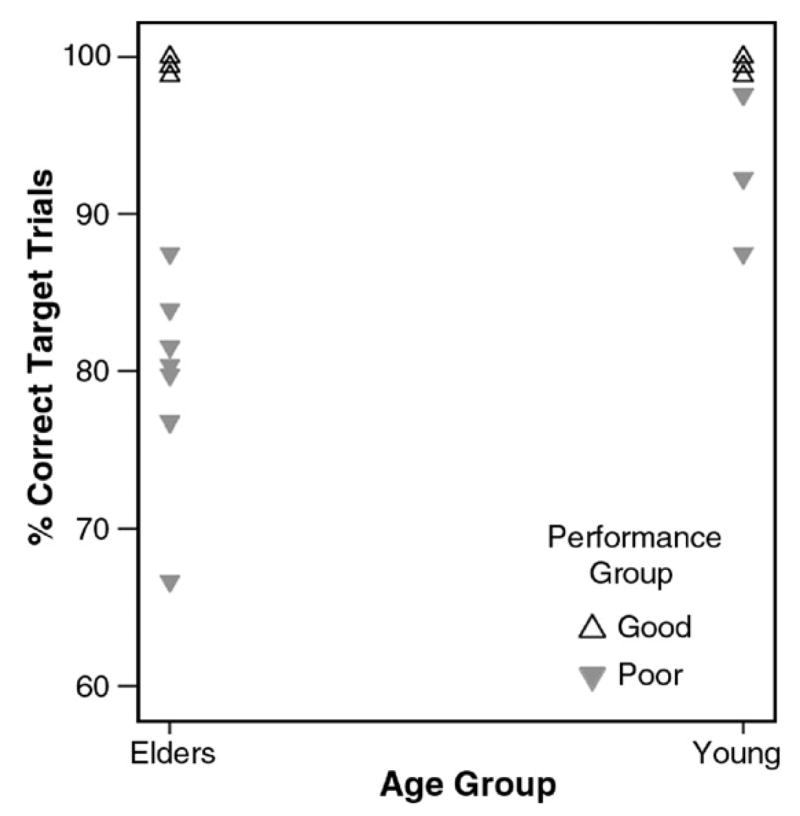
Median split by performance on the Percent Correct Target Trials (PCTT) Go/No-go task measure. The seven good young performers all had perfect performance and the four good elder performers all had performance at 99% or better.
2.2. fMRI analyses
Repeated-measures ANOVA was computed with age group and performance group as the independent variables and PAUC values for side (left hemisphere, right hemisphere) and structure (C, PGp) as the dependent variables. There was a significant interaction between age group and structure, (F(1,18)=9.58, p=0.005, eta2=0.33) indicating greater PGp and lesser C activation for elders relative to young participants. The main effect of age group was not significant (F(1,18)=0.06, p=0.80, eta2=0.03), while the effect of side (F(1,18)=4.11, p=0.06, eta2=0.19, greater activation on the left), and the interaction between age group, performance group and structure (F(1,18)=3.84, p=0.07, eta2=0.18) were marginal trends. All other main effects and interactions were non-significant (p’s>.17).
While the effect sizes of the significant effects were quite strong, supporting the validity of the analysis, the statistical power was quite limited due to the small sample in this study. Additionally, the literature indicates that age-related differences in functional activation often differ by hemisphere. Thus, we did a follow-up analysis by computing the RMA-NOVA results separately by each hemisphere to better understand the interaction and trend effects in the primary analysis. For the left hemisphere, there was a significant main effect of structure (F(1,18)=5.07, p=0.037, eta2=0.22; PGP>C), a trend toward a main effect of performance group (F(1,18)=3.83, p=0.066, eta2=0.18; poor>good), and a significant interaction of structure×age group (F(1,18)=6.60, p=0.019, eta2=0.27; old>young in PGp; young>old in C). Noting that the participants were right-handed, activation in these structures in the left hemisphere was expected. Fig. 2A shows the significant effects and the nearly significant trend of performance group. That is, it is apparent that in both age groups, poor performers activated both regions, particularly the PGp to a greater degree than did good performers. For the right hemisphere, there was a significant structure×age group interaction (F(1,18)=6.06, p=0.024, eta2=0.25; old>young in PGp; young>old in C) and a significant structure×age group×performance group interaction (F(1,18)=4.59, p=0.046, eta2=0.20). Fig. 2B demonstrates the significant interaction, showing generally greater activation for poor performers in both age groups in the PGp, but in C, only the poor young performers had elevated activation.
Fig. 2.

Depicted is putamen/globus pallidus (PGp) and caudate (C) activation by both age group and performance group, separately by hemisphere (A=left; B=right). Older participants had greater activation for PGp, while younger participants had greater C activation. In addition, poor performers had generally greater activation than good performers, although this was significant for both regions only in the left hemisphere. In the right hemisphere, only young poor performers had significantly greater C activation.
2.3. vMRI analyses
Repeated-measures ANOVA was also computed with age and performance groups as the independent variables and volume (mm3) values for side (left hemisphere, right hemisphere) and structure (C, PGp) as the dependent variables. There was a main effect of age (F(1,18)=24.5, p<0.0001, eta2=0.58; young> old). No other main effects or interactions were significant or at the trend level (p’s>0.16). There was no difference between elders and young in total intracranial brain volume estimate (t(20)=−0.75, p=0.46).
A follow-up analysis separately for each hemisphere was also computed to match the analysis done for fMRI. For both left and right hemispheres, there were two significant effects: age, where young had significantly greater volume in both structures than old (Left: F(1,18)=13.95, p=0.002, eta2=0.44; Right: F(1,18) =23.46, p <0.0001, eta2=0.57); and structure, where PGp had greater volume than C (Left: F(1,18)=37.66, p<0.0001, eta2=0.68; Right: F(1,18)=34.49, p<0.0001, eta2= 0.66). The structure main effect, however is not meaningful in this analysis because the area in voxels covered by the PGp is inherently larger than that measured for C.
2.4. Intercorrelations
Exploratory correlations were computed between vMRI and fMRI measurements and Go/No-go performance and age (see Table 1). Due to the small sample size, correction for multiple correlations was not feasible. Correlations between volume and activation were low for all the structures (all r’s<0.23). The correlations between regional activation indices and total brain volume in the AC–PC plane were more variable, but in the direction of increasing activation with decreasing volume (range r=−0.22 to r=−0.52). Indeed, only one of these correlations was significant, showing greater right PGp activation with lesser total brain volume (r=−0.52). Notably, vMRI measurements were generally strongly correlated with one another (range=r=0.55 to r=0.92), but were not well correlated with functional activation (all r’s smaller than ±0.23) or with whole brain volume (r’s<0.21). fMRI measurements were also moderately correlated with one another (range r=0.29 to r=0.62). Only one activation measure, the left PGp, was significantly correlated with GNG task performance measures (rs=−0.55, p<0.01). The relationship, and how it was distinguishable by PCTT performance but not by age group, is illustrated in Fig. 3.
Table 1.
Correlations between Go/No-go performance, age, and functional and volumetric MRI measurements for all participants
| FMRI and vMRI | 1. | 2. | 3. | 4. | 5. | 6. | 7. | 8. | 9. |
|---|---|---|---|---|---|---|---|---|---|
| 1. Lt. PGp fMRI | – | 0.62** | 0.45* | 0.29 | −0.01 | −0.14 | −0.17 | −0.23 | −0.25 |
| 2. Rt. PGp fMRI | – | 0.39 | 0.39 | −0.13 | −0.18 | −0.04 | −0.07 | −0.52** | |
| 3. Lt. C fMRI | – | 0.69** | 0.23 | 0.21 | −0.02 | −0.12 | −0.38 | ||
| 4. Rt. C fMRI | – | 0.04 | 0.08 | −0.05 | −0.05 | −0.22 | |||
| 5. Lt. PGp vMRI | – | 0.90** | 0.55** | 0.54** | 0.14 | ||||
| 6. Rt. PGp vMRI | – | 0.62 | 0.65** | 0.05 | |||||
| 7. Lt. C vMRI | – | 0.92** | 0.21 | ||||||
| 8. Rt. C vMRI | – | 0.21 | |||||||
| 9. BV vMRI | – | ||||||||
| GNG PCTT | −0.55* | −0.29 | 0.02 | 0.20 | 0.25 | 0.33 | 0.36 | 0.30 | 0.16 |
| GNG PCIT | −0.53* | −0.19 | −0.20 | −0.14 | 0.11 | 0.13 | 0.24 | 0.17 | 0.32 |
| GNG RTT | 0.61** | 0.28 | 0.25 | −0.03 | −0.01 | −0.08 | −0.20 | −0.31 | 0.04 |
| Age | 0.32 | 0.34 | −0.25 | −0.23 | −0.54* | −0.67** | −0.76** | −0.74** | −0.20 |
Lt.=Left, Rt.=Right. PGp=Putamen and Globus Pallidus. C=Caudate. BV=brain volume in the axial plane through the anterior commissure–posterior commissure and perpendicular to the longitudinal fissure.
p=0.05,
p=0.01, N=22 for all correlations.
Fig. 3.
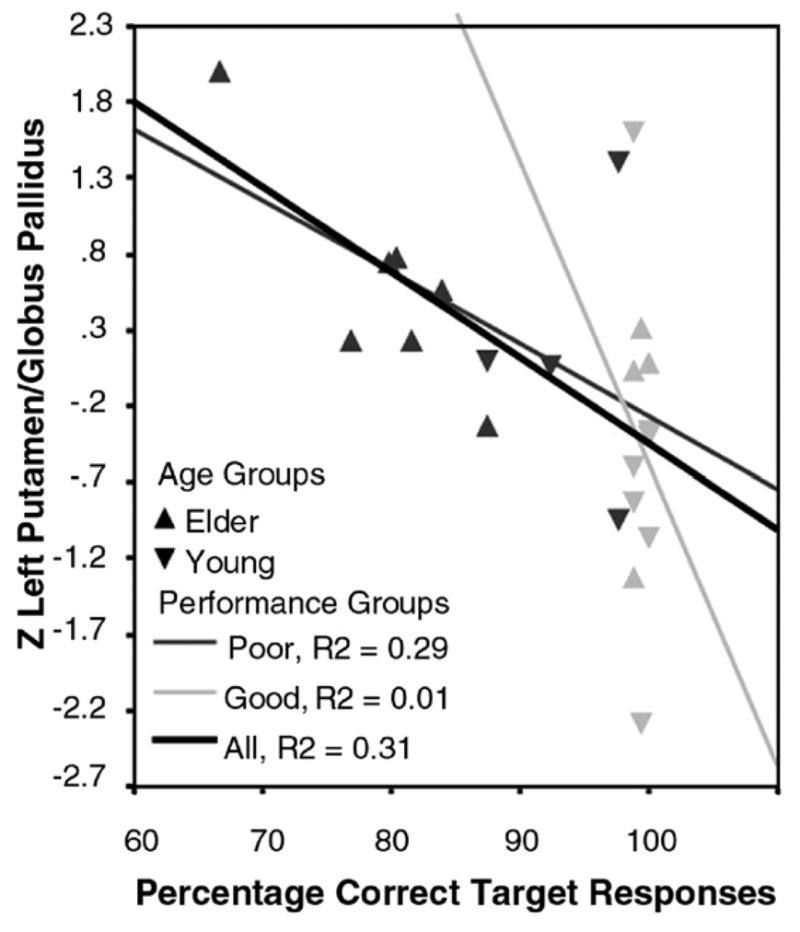
Z-transformed activation in to the left putamen/globus pallidus (PGp) correlated with Percent Correct Target Trials (PCTT) performance, denoted by age group (▲ for elders, ▼ for young adults) and performance group (good in pale gray, poor in dark gray). Increased activation with poorer performance is evident irrespective of age group.
Table 2 also depicts correlations in older adults between performance on the Go/No-go task with age, and performance on attention and executive functioning tasks. Due to the small number of subjects, correction for multiple correlations was not feasible. Importantly, the Go/No-go task performance measures were significantly correlated with each other and with measures of attention and executive functioning. In contrast, participant age did not correlate significantly with these measures or with any fMRI measures, but it was significantly correlated with each of the vMRI measures.
Table 2.
Correlations between neuropsychological test measures, Go/No-go performance, and vMRI and fMRI measurements for elder participants
| Variable | 1. | 2. | 3. | 4. | 5. | 6. | 7. | 8. | 9. | 10. |
|---|---|---|---|---|---|---|---|---|---|---|
| 1. Age | 0.45 | −0.54 | −0.07 | −0.03 | 0.17 | −0.01 | −0.30 | −0.18 | −0.09 | |
| 2. RTT | −0.64* | −0.53 | 0.48 | 0.66* | −0.01 | 0.34 | 0.28 | −0.76** | ||
| 3. PCI | 0.48 | −0.34 | −0.63* | 0.28 | −0.15 | −0.23 | 0.45 | |||
| 4. PCTT | −0.36 | −0.56^ | 0.52 | −0.63^^ | 0.18 | 0.64* | ||||
| 5. TMT A | −0.03 | 0.48 | −0.34 | −0.36 | 0.82** | −0.35 | 0.42 | 0.29 | −0.36 | |
| 6. TMT B | 0.17 | 0.66* | −0.63* | −0.56 ^ | 0.82** | −0.48 | 0.73** | 0.17 | −0.48 | |
| 7. WCST Cat. (10) | −0.01 | −0.01 | 0.28 | 0.52 | −0.35 | −0.48 | −0.67* | 0.20 | 0.61* | |
| 8. WCST Persev. (9) | −0.30 | 0.34 | −0.15 | −0.63 ^^ | 0.42 | 0.73** | −0.67* | −0.20 | −0.49 | |
| 9. COWA Raw | −0.18 | 0.28 | −0.23 | 0.18 | 0.29 | 0.17 | 0.20 | −0.20 | −0.06 | |
| 10. Digit Sym Raw | −0.36 | −0.76** | 0.45 | 0.64* | −0.36 | −0.48 | 0.61* | −0.49 | −0.06 | |
| Lt. PGp fMRI | 0.16 | 0.56 | −0.38 | −0.74** | 0.52 | 0.36 | −0.32 | 0.16 | −0.02 | −0.66* |
| Rt. PGp fMRI | 0.47 | 0.30 | 0.10 | −0.19 | −0.13 | −0.15 | −0.17 | −0.15 | −0.29 | −0.56 |
| Lt. C fMRI | 0.46 | 0.41 | −0.23 | −0.20 | −0.07 | 0.02 | 0.37 | −0.25 | −0.22 | −0.11 |
| Rt. C fMRI | 0.19 | −0.02 | 0.47 | 0.42 | −0.46 | −0.58 | 0.44 | −0.50 | 0.06 | 0.03 |
| Lt. PGp vMRI | −0.36 | 0.21 | 0.34 | −0.18 | 0.16 | 0.02 | 0.35 | 0.20 | −0.20 | −0.05 |
| Rt. PGp vMRI | −0.22 | 0.29 | 0.27 | −0.10 | −0.07 | −0.18 | 0.35 | 0.02 | −0.09 | −0.26 |
| Lt. C vMRI | −0.26 | −0.16 | 0.55 | −0.17 | 0.02 | −0.19 | −0.23 | 0.24 | −0.57 | −0.19 |
| Rt. C vMRI | −0.47 | −0.12 | 0.45 | −0.25 | −0.01 | −0.12 | −0.27 | 0.28 | −0.37 | −0.25 |
| BV vMRI | −0.57 | −0.14 | 0.25 | −0.02 | 0.45 | 0.30 | −0.05 | 0.50 | −0.03 | 0.19 |
GNG=Go/No-go; PCTT=percent correct target trials; PCIT=percent correct inhibition trials; RTT=reaction time to targets; WCST=Wisconsin Card Sorting Test; COWA=Controlled Oral Word Association test; Persev.=perseverative responses; Cat.=categories; Digit Sym Raw=Digit Symbol Raw Score; N=11 for all correlations except WCST categories (N=10) and WCST perseverative responses (N=9);
p=0.05 (r>0.595);
p=0.01.
Trend, p=0.073.
Trend, p=0.068.
3. Discussion
The purpose of the current study was to evaluate structural and functional MRI in the basal ganglia as they relate to age- and performance-related differences on a motor response control task. The task used involved response execution for complex, context-based “go” response execution for a go/no-go task. This task has been shown to involve some degree of executive control, including attention, set-shifting and motor control ability (Langenecker et al., in press; Langenecker and Nielson, 2003; Nielson et al., 2002; Garavan et al., 1999). These cognitive domains exhibit change in normal aging, and as expected, older adults made more errors on this aspect of the task than did young adults. Indeed, elders’ performance on the Go/No-go task also correlated well with their performance on traditional executive functioning tasks. With respect to functional activation, significant interactions in both hemispheres demonstrated that elders had greater overall activation in the bilateral putamen/globus pallidus and lesser activation in the caudate, relative to young adults. In a previous study that spanned the adult age spectrum, we also showed that older adults had less caudate activation during this aspect of the GNG task than did young adults (Nielson et al., 2002). Furthermore, a 3-way interaction of region, age group and performance group in the right hemisphere suggested that while poorer performers had generally greater activation than better performers in the putamen/globus pallidus, in the caudate this was true only for the young participants. The particularly strong right caudate activation in young poor performers suggests that this activation may be compensatory (i.e., recruitment) and that older adults may be less able to invoke this mechanism to support performance. Finally, poorer performers in both age groups had generally greater left hemisphere activation for both the PGp and C, and activation in the left PGp significantly correlated with each of the behavioral response measures on the task. Thus, the results suggest that in right-handed participants, the left putamen/globus pallidus may principally underlie performance on this task, while the right hemisphere PGp and the bilateral caudate, at least in young participants, may serve to support task performance. Moreover, functional MRI revealed differences between the age groups, but also within and between age groups based on task performance. In the left hemisphere, and particularly in the left PGp, performance group exclusively distinguished activation (see Fig. 3).
The present study also replicated prior studies showing a generalized volume reduction in elders as compared to young adults in the basal ganglia (Convit et al., 1995; Pruessner et al., 2001; Raz et al., 1993, 1997; Soininen et al., 1994; Tisserand et al., 2000). Some previous studies have also reported moderate correlations between structural atrophy and cognitive performance (Coffey et al., 2001; Raz, 2000; Tisserand et al., 2004). The current study found only weak to modest, non-significant correlations between task performance variables and basal ganglia regional volumes. The previous studies had larger samples, which could explain the lack of effect in the present study. However, most of the previous studies also used more general cognitive measures or more global volume measures than employed here (Coffey et al., 2001; Tisserand et al., 2000, 2004). Furthermore, some studies have shown that when age is taken into account, correlations between regional volume and task performance disappear (Tisserand et al., 2000). Indeed, participant age was significantly correlated with each of the regional volume measures. Thus, while vMRI was sensitive to age per se, functional activation in basal ganglia was more specifically related to performance- and age-related differences in response control than was regional brain volume.
The distinct findings for volumetric and functional MRI measures in this study suggest that vMRI and fMRI are sensitive to different aspects of aging, such as vMRI being more sensitive to age-related changes generally and fMRI being more sensitive to specific performance abilities. If so, vMRI and fMRI also should be only modestly correlated with one another. Indeed, structural volume and fMRI activation were generally not significantly correlated. Therefore, atrophy within a structure did not dictate the extent to which fMRI activation increased under task demand (i.e., the extent of compensation or recruitment). One exception to this was that activation in the right putamen/globus pallidus did significantly correlate with total brain volume, such that those with smaller brain volumes activated the right PGp to a greater extent. Given that the left PGp was most central to task performance (in right-handed participants), the right PGp may serve to support task performance when such support is needed. In contrast to the lack of regional volume correlations with task performance or activation, this correlation may therefore imply that more support from this recruitable region is needed in those with greater generalized brain atrophy. The current results also suggest that additional study of these relationships in the basal ganglia are warranted using additional tasks and regions to help elucidate whether structural and functional measures can distinctively contribute to better understanding and prediction of age- and disease-related cognitive change.
The main limitations of the present study is the small number of participants in each group and the distinct performance range of the two groups. Most aging and clinical studies have inherent difficulties in equating subject groups on performance. Indeed, such differences are typically the focus of study. As such, age and performance can be somewhat confounded. One advantage of event-related fMRI designs is that task activation can be analyzed exclusively for correctly performed trials. This approach was used in the present study, thereby allowing better exclusion of error contributions to functional maps, and better equating of performance in the groups. Furthermore, the robust findings within this small sample lend credibility to the interactions, between age, performance, and structure and suggest that investigations of this type can be particularly fruitful. The current study also focused exclusively on the basal ganglia. Similar structure–function studies that examine additional tasks and regions would now be very valuable to help delineate the roles of structural and functional measures in aging research. For example, the prefrontal cortex has been demonstrated to be susceptible to both structural atrophy and functional recruitment changes with age, and plays a significant role in executive functioning (Volkow et al., 2000). A similar analysis including this region could further delineate the age-related neurophysiological mechanisms of decline in executive functioning.
In conclusion, the present study provided a unique direct test of the sensitivity of structural and functional neuroimaging in detecting age- and performance-related cognitive differences. The findings support more indirect studies that concluded that cognitive aging is only weakly to modestly related to volumetric changes (Dickerson et al., 2004; Head et al., 2002; Johnson et al., 2000; Thomsen et al., 2004). Indeed, performance differences were similarly not detected by volumetric measures in either younger or older adults. In contrast, functional MRI detected both age-related and performance-related task differences, as well as their interactions. In addition, activation in the regions associated with the task correlated significantly with task performance. Thus, although brain volume decline occurs in the vast majority of elders, functional decline is not necessarily associated with it. Rather, functional changes may sensitively and specifically aid in predicting cognitive change in aging before volumetric change is evident.
4. Experimental procedures
4.1. Subjects
Eleven healthy younger (M=28.1 years, S.D.=4.1, range 25–32) and 11 healthy older (M=72.8 years, S.D.=3.5, range 67–77; t(20)=27.62, p=0.0001) participants with comparable years of education (t(19)=−1.16, p=0.26) participated in the current study. The younger group was composed of four males and seven females, and the older group was composed of three males and eight females. The participants were recruited through advertisements at a small Midwestern University and were paid $10 for participation. Signed informed consent was obtained from all participants in accordance with approval of the Institutional Review Boards of the Medical College of Wisconsin and Marquette University and consistent with the Declaration of Helsinki.
For the older adults, normal cognitive and emotional status was verified by prescreening using an extensive phone interview, by screening at the time of the evaluation using the Mini Mental State Exam (MMSE>27; Folstein et al., 1975) and the Geriatric Depression Scale (GDS long<9; Sheikh and Yesavage, 1986), and by a 3-h neuropsychological battery. Cognitive domains tested included memory (Logical Memory, Visual Reproduction (Wechsler, 1997) ); executive functioning (Trail-Making Test, Lezak, 1995; Wisconsin Card Sorting Test, Grant and Berg, 1948; Digit Symbol, Wechsler, 1997; and Digit Span, Wechsler, 1997); verbal fluency (Controlled Oral Word Association, Benton et al., 1978), and verbal/abstract reasoning (Similarities, Wechsler, 1997). Using the criteria of Petersen and colleagues (Petersen et al., 1999), all older participants performed within the normal range for their age. The means and standard deviations for demographic and selected neuropsychological tests are reported in Table 3. Young adult participants were also screened using an extensive phone interview to rule out any psychiatric, neurological, or other medical factors that might influence cognitive performance. They were also given the MMSE and GDS to assure scores within normal range and uniformity across groups; all young participants had MMSE scores>28 and GDS scores<9 (see Table 3).
Table 3.
Demographic and neuropsychological data for older adults (11) and young adults (11)
| Variable/test | Elders
|
Young
|
||
|---|---|---|---|---|
| Mean | S.D. | Mean | S.D. | |
| Age | 72.8 | 3.5 | 28.1 | 4.1 |
| Education | 18.0 | 2.3 | 17.0 | 1.7 |
| MMSE (all>27) | 29.4 | 0.8 | 29.3 | 0.7 |
| GDS | 3.0 | 2.9 | 3.6 | 3.0 |
| Similarities (SS)* | 15.5 | 3.0 | ||
| LMI (SS) | 12.1 | 2.0 | ||
| (raw) | 41.3 | 6.9 | ||
| VRI (SS) | 13.8 | 3.1 | ||
| (raw) | 84.6 | 12.8 | ||
| WCST categories | 4.9 | 1.7 | ||
| Trails B (seconds) | 67.9 | 19.2 | ||
| Digit symbol (raw) | 59.3 | 9.5 | ||
| COWA (total words) | 53.6 | 2.9 | ||
MMSE=Mini Mental State Exam; GDS=Geriatric Depression Scale; *from the Wechsler Adult Intelligence Scale-III; SS=Scaled Score (M=10, S.D.=3); LMI=Logical Memory I (Wechsler Memory Scale-III; VRI=Visual Reproduction I; WCST=Wisconsin Card Sorting Test (N=9 valid scores); COWA=Controlled Oral Word Association Test.
4.2. Go/No-go task
The Go/No-go task (Langenecker and Nielson, 2003; Nielson et al., 2002) was administered with Superlab Pro 2.0. In this task, participants were required to press a button on a keypad in order to respond to the presentation of alternating target letters (e.g., x, y, x), such that they were required to inhibit a response to a letter the second time it was presented without an intervening other target letter. The letters are presented centrally in a serial stream, with a presentation time of 500 ms. The task was administered in two blocks of trials. Single, lowercase letters printed in black were presented serially every 500 ms on a white screen, with an interstimulus interval of 0 ms and a mean inter-lure interval of 14 s. Non-target letters are included in the inter-target and inter-lure intervals. Only activation for responses to correct targets was used in the present event-related study. Note that the working memory sets for “target” and “lure” change after each target such that a response to “x”, which was the previous target, changes the working memory set from x=target, y=lure to the working memory set of y=target and x=lure. Fig. 4 depicts the Go/No-go task. Functional data were collected in identical manners in all sessions. Dependent variables included Percent Correct Target Trials (PCTT; attention and set-shifting), and Percent Correct Inhibition Trials (PCIT; inhibitory control), and Response Time to Targets (RTT; processing speed).
Fig. 4.
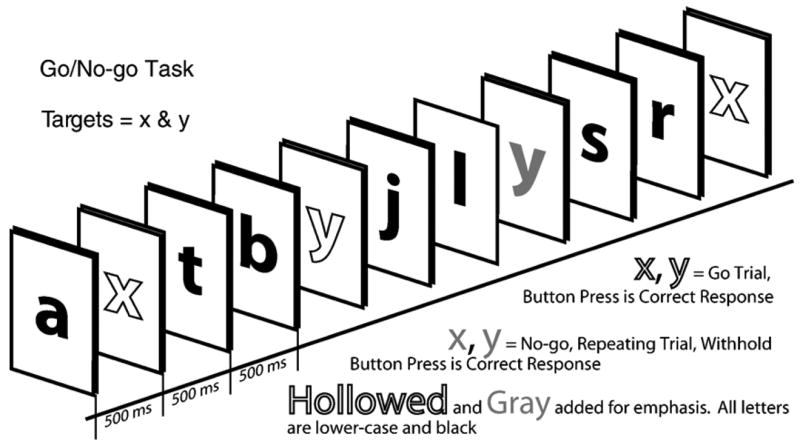
Depiction of the Go/No-go task.
4.3. fMRI and volumetric MRI acquisition
A 1.5T GE Signa scanner equipped with a 30.5 cm i.d. 3-axis local gradient coil and an endcapped quadrature birdcage radio-frequency head-coil was used for brain imaging. Soft foam padding was used to limit head movements, and earplugs were used for hearing protection. Prism glasses (with correction, as necessary) were used to view the task, which was back-projected on a screen at the subject’s feet. For vMRI data, 124 high-resolution T1-weighted spoiled GRASS anatomic images were collected (TE=5 ms, TR=24 ms, flip angle 45°, FOV 24 cm, thickness 1.1 to 1.3 mm with no gap, matrix size 256*256). For fMRI data, 19 contiguous sagittal slices 7 mm thick were acquired using a blipped gradient echo-planar pulse sequence (TE=40 ms, TR=2000, FOV=24 cm, 64×64 matrix, 3.75×3.75 in plane resolution).
4.4. Volumetric MRI data measurements and analysis
All images were copied so that there were duplicates of each subject and all identifying information was removed. Volumetric images were transformed to Talairach coordinates in 3 dimensional orientation within AFNI (Cox, 1996) prior to volumetric analyses to assure veracity of fMRI vs vMRI comparisons. Images were compared visually before and after Talairach transformation to detect any structural size distortion; no major distortions were evident in gray or white matter measurements, while ventricle size increased after the transformation.
Structure boundaries were cross-referenced between several well-known brain atlases and software programs to assure accuracy of tracing (Haines, 1983; Hendelman, 2000; Talairach and Tournoux, 1988; Warner, 2001). Structural landmarks were used to separate the caudate from the globus pallidus and putamen (anterior limb of the internal capsule). As the differentiation between putamen and globus pallidus was difficult to make, all gray matter between the internal capsule and external capsule was included as one structure (putamen and globus pallidus: PGp). A substantial proportion of the PGp extended below the AC–PC axial plane. Due to difficulties differentiating the anterior aspect of the PGp below this plane, only volume above the AC–PC axial plane was included in PGp volumes. Likewise, the caudate (head, body and tail; C) were defined by the gray matter rostral to the anterior limb of the internal capsule and the lateral ventricle and superior to the AC–PC axial plane. Finally, brain volume (BV) was computed in the axial plane through the AC–PC line and perpendicular to the longitudinal fissure. Fig. 5 illustrates C, PGp, and BV measurements in the AC–PC plane for one sample brain. Total mm3 was computed for each of these structures.
Fig. 5.
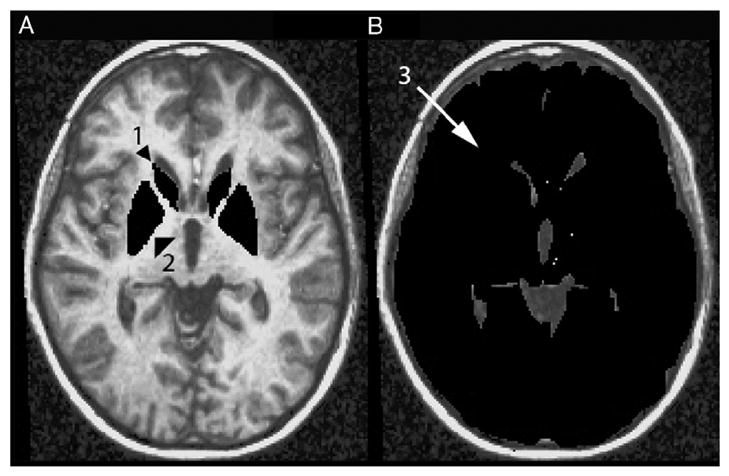
Regions of Interest (ROI) for the fMRI and vMRI analyses including the caudate (1), putamen/globus pallidus (2), and brain volume in the horizontal AC–PC plane (3).
The figures were traced in the axial plane from a line parallel with the anterior–posterior commissure line as an inferior border and through each image until the caudate body was no longer visible. Images were traced principally by one author (NMH, >90%), blind to group memberships. After initial tracing was completed, reliability coefficients were computed, ranging from 0.72 to 0.91. To enhance reliability, NMH retraced all 44 anatomies, again blind to group status and to initial difference between anatomy 1 and anatomy 2 of each participant. Retracing (or correcting) was done in axial, sagittal, and coronal planes within the 3D AFNI viewers (Cox, 1996). After completion, correlations between 1st and 2nd volumetric measurements were greater than .93 for all structures.
4.5. fMRI data analysis
All data processing was conducted with the software package AFNI v2.2 (Cox, 1996). Algorithms used to detect and correct for three-dimensional motion and edge detection were applied to the functional echo-planar images after transformation from Fourier space. Subjects’ functional images were viewed cinematically to detect uncorrected head movements. Regression canonicals were used separately for targets, rejections (correct inhibitory trials), commission errors, omission errors, and missed opportunities, so that activation related to these wanted (target) and unwanted (all other cognitive/behavioral) events would not confound response-based activation or contribute to measurement error. The results from the inhibitory-correct lure trials, or rejections are reported elsewhere (Langenecker and Nielson, 2003). Activation changes for valid, correct target trials were averaged together to obtain a mean signal response for each voxel using a deconvolution procedure and an impulse response function was generated for target events. A non-linear regression (NLR) optimization procedure, which is effective in separating signal that can be attributed to neuronal action from noise in functional images in both the healthy young and healthy elders, was used to model the averaged functional datasets with a gamma-variate function. Area under the curve for each voxel was expressed as a percentage of area under the hemodynamic response (PAUC) corrected by baseline activation (Garavan et al., 1999; Langenecker and Nielson, 2003; Nielson et al., 2002). Individual functional maps were converted to the standard stereotaxic coordinate system (Talairach and Tournoux, 1988) after which a 4.2 mm full-width-at-half-maximum isotropic Gaussian filter was applied.
4.6. Extraction of functional activation from ROIs
Once anatomies were defined, average (non-zero) functional activation was extracted for each structure in each participant. As the scale of functional activation (10−2) is different from the magnitude of structure volumes, each value was converted to a Z score based upon the mean and standard deviation for each structure across groups for each metric used (e.g., vMRI vs fMRI). Behavioral measures (RTT, PCTT, and PCIT) were also converted to Z scores for ready performance-vMRI-fMRI comparisons.
Acknowledgments
We are grateful for the technical assistance of Thomas J. Ross, and the assistance with data collection by Benjamin Bock, Kirk I. Erickson, Douglas Yee, and Ted Bryant. This work was supported in part by a Dissertation Research Award from the American Psychological Association (to SAL) and by the Foley Center for Aging and Development, Medical College of Wisconsin, WI, USA (to KAN).
Abbreviations
- C
Caudate
- PGp
Putamen/Globus Pallidus
- PCTT
Percent Correct Target Trials
- PCIT
Percent Correct Inhibition Trials
- RTT
Response Time to Targets
- BV
Brain Volume in the Anterior–Posterior Commissure Plane
References
- Adams JR, Troiano AR, Calne DB. Functional imaging in Tourette’s syndrome. J Neural Transm. 2004;111:1495–1506. doi: 10.1007/s00702-004-0173-4. [DOI] [PubMed] [Google Scholar]
- Andreasen NC, Flaum M, Swayze V, O’Leary DS, Alliger R, Cohen G, Ehrhardt J, Yuh WT. Intelligence and brain structure in normal individuals. Am J Psychiatry. 1993;150:130–134. doi: 10.1176/ajp.150.1.130. [DOI] [PubMed] [Google Scholar]
- Atasoy HT, Nuyan O, Tunc T, Yorubulut M, Unal AE, Inan LE. T2-weighted MRI in Parkinson’s disease; substantia-nigra pars compacta hypointensity correlates with the clinical scores. Neurol India. 2004;52:332–337. [PubMed] [Google Scholar]
- Benton A, Hamsher K, Varney N, Spreen O. Contributions to Neuropsychological Assessment: A Clinical Manual. Oxford Univ. Press; New York: 1978. [Google Scholar]
- Cabeza R. Hemispheric asymmetry reduction in older adults: the HAROLD model. Psychol Aging. 2002;17:85–100. doi: 10.1037//0882-7974.17.1.85. [DOI] [PubMed] [Google Scholar]
- Cabeza R, Daselaar SM, Dolcos F, Prince SE, Budde M, Nyberg L. Task-independent and task-specific age effects on brain activity during working memory, visual attention and episodic retrieval. Cereb Cortex. 2004;14:364–375. doi: 10.1093/cercor/bhg133. [DOI] [PubMed] [Google Scholar]
- Cao Y, D’Olhaberriague L, Vikingstad EM, Levine SR, Welch KMA. Pilot study of functional MRI to assess cerebral activation of motor function after poststroke hemiparesis. Stroke. 1998;29:112–122. doi: 10.1161/01.str.29.1.112. [DOI] [PubMed] [Google Scholar]
- Cao Y, Vikingstad EM, George KP, Johnson AF, Welch KMA. Cortical language activation in stroke patients recovering from aphasia with functional MRI. Stroke. 1999;30:2331–2340. doi: 10.1161/01.str.30.11.2331. [DOI] [PubMed] [Google Scholar]
- Casey BJ, Castellanos FX, Giedd JN, Marsh WL, Hamburger SD, Schubert AB, Vauss YC, Vaituzis AC, Dickstein DP, Sarfatti SE, Rapoport JL. Implication of right frontostriatal circuitry in response inhibition and attention-deficit/hyperactivity disorder. J Am Acad Child Adolesc Psych. 1997;36:374–383. doi: 10.1097/00004583-199703000-00016. [DOI] [PubMed] [Google Scholar]
- Castellanos FX, Giedd JN, Marsh WL, Hamburger SD, Vaituzis AC, Dickstein DP, Sarfatti SE, Vauss YC, Snell JW, Lange N, Kaysen D, Krain AL, Ritchie GF, Rajapakse JC, Rapoport JL. Quantitative brain magnetic resonance imaging in attention-deficit hyperactivity disorder. Arch Gen Psychiatry. 1996;53:607–616. doi: 10.1001/archpsyc.1996.01830070053009. [DOI] [PubMed] [Google Scholar]
- Channon S, Pratt P, Robertson MM. Executive function, memory, and learning in Tourette’s syndrome. Neuropsychology. 2003;17:247–254. doi: 10.1037/0894-4105.17.2.247. [DOI] [PubMed] [Google Scholar]
- Coffey CE, Ratcliff G, Saxton JA, Bryan RN, Fried LP, Lucke JE. Cognitive correlates of human brain aging: a quantitative magnetic resonance imaging investigation. J Neuropsychiatry Clin Neurosci. 2001;13:471–485. doi: 10.1176/jnp.13.4.471. [DOI] [PubMed] [Google Scholar]
- Convit A, De Leon MJ, Hoptman MJ, Tarshish C, de Santi S, Rusinek H. Age-related changes in brain: I. Magnetic resonance imaging measures of temporal lobe volumes in normal subjects. Psychiatr Q. 1995;66:343–355. doi: 10.1007/BF02238754. [DOI] [PubMed] [Google Scholar]
- Cox R. AFNI: software for analysis and visualization of functional magnetic resonance neuroimages. Comput Biomed Res. 1996;29:162–173. doi: 10.1006/cbmr.1996.0014. [DOI] [PubMed] [Google Scholar]
- Cramer SC, Nelles G, Benson RR, Kaplan JD, Parker RA, Kwong KK, Kennedy DN, Finklestein SP, Rosen BR. A functional MRI study of subjects recovered from hemiparetic stroke. Stroke. 1997;28:2518–2527. doi: 10.1161/01.str.28.12.2518. [DOI] [PubMed] [Google Scholar]
- Dickerson BC, Salat DH, Bates JF, Atiya M, Killiany RJ, Greve DN, Dale AM, Stern CE, Blacker D, Albert MS, Sperling RA. Medial temporal lobe function and structure in mild cognitive impairment. Ann Neurol. 2004;56:27–35. doi: 10.1002/ana.20163. [DOI] [PMC free article] [PubMed] [Google Scholar]
- DiGirolamo GJ, Kramer AF, Barad V, Cepeda NJ, Weissman DH, Milham MP, Wszalek TM, Cohen NJ, Banich MT, Webb A, Belopolsky AV, McAuley E. General and task-specific frontal lobe recruitment in older adults during executive processes: a fMRI investigation of task-switching. NeuroReport. 2001;12:2065–2071. doi: 10.1097/00001756-200107030-00054. [DOI] [PubMed] [Google Scholar]
- Egan V, Chiswick A, Santosh C, Naidu K, Rimmington JE, Best JJK. Size isn’t everything—A study of brain volume, intelligence and auditory-evoked potentials. Pers Individ Differ. 1994;17:357–367. [Google Scholar]
- Egan V, Wickett JC, Vernon PA. Brain size and intelligence—Erratum, addendum, and correction. Pers Individ Differ. 1995;19:113–115. [Google Scholar]
- Flashman LA, Andreasen NC, Flaum M, Swayze VW. Intelligence and regional brain volumes in normal controls. Intelligence. 1997;25:149–160. [Google Scholar]
- Folstein M, Folstein S, McHugh P. “Mini-mental state”. A practical method for grading the cognitive state of patients for the clinician. J Psychiatr Res. 1975;12:189–198. doi: 10.1016/0022-3956(75)90026-6. [DOI] [PubMed] [Google Scholar]
- Garavan H, Ross T, Stein E. Right hemispheric dominance of inhibitory control: an event-related functional MRI study. Proc Natl Acad Sci U S A. 1999;96:8301–8306. doi: 10.1073/pnas.96.14.8301. [DOI] [PMC free article] [PubMed] [Google Scholar]
- Golomb J, deLeon MJ, Kluger A, George AE, Tarshish C, Ferris SH. Hippocampal atrophy in normal aging: an association with recent memory impairment. Arch Neurol. 1993;50:967–973. doi: 10.1001/archneur.1993.00540090066012. [DOI] [PubMed] [Google Scholar]
- Grant DA, Berg EA. A behavioral analysis of the degree of reinforcement and ease of shifting to new responses in a Weigl-type card sorting problem. J Exp Psychol. 1948;38:404–411. doi: 10.1037/h0059831. [DOI] [PubMed] [Google Scholar]
- Hager F, Volz HP, Gaser C, Mentzel HJ, Kaiser WA, Sauer H. Challenging the anterior attentional system with a continuous performance task: a functional magnetic resonance imaging approach. Eur Arch Psychiatry Clin Neurosci. 1998;248:161–170. doi: 10.1007/s004060050034. [DOI] [PubMed] [Google Scholar]
- Haines DE. Neuroanatomy: An Atlas of Structures, Sections, and Systems. Urban and Schwarzenberg; Baltimore: 1983. [Google Scholar]
- Head D, Raz N, Gunning-Dixon F, Williamson A, Acker JD. Age-related differences in the course of cognitive skill acquisition: the role of regional cortical shrinkage and cognitive resources. Psychol Aging. 2002;17:72–84. doi: 10.1037//0882-7974.17.1.72. [DOI] [PubMed] [Google Scholar]
- Hendelman WJ. Atlas of Functional Neuroanatomy. CRC Press; Boca Raton: 2000. [Google Scholar]
- Johnson SC, Saykin AJ, Baxter LC, Flashman LA, Santulli RB, McAllister TW, Mamourian AC. The relationship between fMRI activation and cerebral atrophy: comparison of normal aging and Alzheimer disease. NeuroImage. 2000;11:179–187. doi: 10.1006/nimg.1999.0530. [DOI] [PubMed] [Google Scholar]
- Kantarci K, Jack CR. Neuroimaging in Alzheimer disease: an evidence-based review. Neuroimaging Clin N Am. 2003;13:197–209. doi: 10.1016/s1052-5149(03)00025-x. [DOI] [PubMed] [Google Scholar]
- Kramer A, Humphrey D, Latish J, Logan G, Strayer D. Aging and inhibition: beyond a unitary view of inhibitory processing in attention. Psychol Aging. 1994;9:491–512. [PubMed] [Google Scholar]
- Langenecker SA, Nielson KA. Frontal recruitment during response inhibition in older adults replicated with fMRI. NeuroImage. 2003;20:1384–1392. doi: 10.1016/S1053-8119(03)00372-0. [DOI] [PubMed] [Google Scholar]
- Langenecker SA, Nielson KA, Rao SM. fMRI of healthy older adults during Stroop interference. NeuroImage. 2004;21:192–200. doi: 10.1016/j.neuroimage.2003.08.027. [DOI] [PubMed] [Google Scholar]
- Langenecker SA, Zubieta JK, Young EA, Akil H, Nielson KA. A task to manipulate attentional load, set-shifting, and inhibitory control: Convergent validity and test–retest reliability of the Parametric Go/No-go test. Journal of Clinical and Experimental Neuropsychology. doi: 10.1080/13803390601147611. in press. [DOI] [PubMed] [Google Scholar]
- Lezak M. Neuropsychological Assessment. Oxford Univ. Press; New York: 1995. [Google Scholar]
- Lupien SJ, DeLeon M, DeSanti S, Convit A, Tarshish C, Nair N, McEwen BS, Hauger RL, Meaney MJ. Longitudinal increase in cortisol during human aging predicts hippocampal atrophy and memory deficits. Nat Neurosci. 1998;1:69–73. doi: 10.1038/271. [DOI] [PubMed] [Google Scholar]
- MacLullich AMJ, Ferguson KJ, Deary IJ, Seckl JR, Starr JM, Wardlaw JM. Intracranial capacity and brain volumes are associated with cognition in healthy elderly men. Neurology. 2002;59:169–174. doi: 10.1212/wnl.59.2.169. [DOI] [PubMed] [Google Scholar]
- Madden DJ, Whiting WL, Provenzale JM, Huettel SA. Age-related changes in neural activity during visual target detection measured by fMRI. Cereb Cortex. 2004;14:143–155. doi: 10.1093/cercor/bhg113. [DOI] [PubMed] [Google Scholar]
- Mueller EA, Moore MM, Kerr DCR, Sexton G, Camicioli RM, Howieson DB, Quinn JF, Kaye JA. Brain volume preserved in healthy elderly through the eleventh decade. Neurology. 1998;51:1555–1562. doi: 10.1212/wnl.51.6.1555. [DOI] [PubMed] [Google Scholar]
- Nielson KA, Langenecker SA, Garavan H. Differences in the functional neuroanatomy of inhibitory control across the adult lifespan. Psychol Aging. 2002;17:56–71. doi: 10.1037//0882-7974.17.1.56. [DOI] [PubMed] [Google Scholar]
- Owen AM. Cognitive dysfunction in Parkinson disease: the role of frontostriatal circuitry. Neuroscientist. 2004;10:525–537. doi: 10.1177/1073858404266776. [DOI] [PubMed] [Google Scholar]
- Park DC, Lautenschlager G, Hedden T, Davidson NS, Smith AD, Smith PK. Models of visuospatial and verbal memory across the adult life span. Psychol Aging. 2002;17:299–320. [PubMed] [Google Scholar]
- Petersen RC, Smith GE, Waring SC, Ivnik RJ, Tangalos EG, Kokmen E. Mild cognitive impairment—Clinical characterization and outcome. Arch Neurol. 1999;56:303–308. doi: 10.1001/archneur.56.3.303. [DOI] [PubMed] [Google Scholar]
- Pruessner JC, Collins DL, Pruessner M, Evans AC. Age and gender predict volume decline in the anterior and posterior hippocampus in early adulthood. J Neurosci. 2001;21:194–200. doi: 10.1523/JNEUROSCI.21-01-00194.2001. [DOI] [PMC free article] [PubMed] [Google Scholar]
- Raz N. Aging of the brain and its impact on cognitive performance: integration of structural and functional findings. In: Craik FIM, Salthouse TA, editors. Handbook of Aging and Cognition II. Erlbaum; Mahwah, N.J.: 2000. [Google Scholar]
- Raz N, Torres IJ, Spencer WD, Millman D, Baertschi JC, Sarpel G. Neuroanatomical correlates of age-sensitive and age-invariant cognitive-abilities—An in-vivo MRI investigation. Intelligence. 1993;17:407–422. [Google Scholar]
- Raz N, Gunning FM, Head D, Dupuis JH, McQuain J, Briggs SD, Loken WJ, Thornton AE, Acker JD. Selective aging of the human cerebral cortex observed in vivo: differential vulnerability of the prefrontal gray matter. Cereb Cortex. 1997;7:268–282. doi: 10.1093/cercor/7.3.268. [DOI] [PubMed] [Google Scholar]
- Raz N, Williamson A, Gunning-Dixon F, Head D, Acker JD. Neuroanatomical and cognitive correlates of adult age differences in acquisition of a perceptual-motor skill. Microsc Res Tech. 2000;51:85–93. doi: 10.1002/1097-0029(20001001)51:1<85::AID-JEMT9>3.0.CO;2-0. [DOI] [PubMed] [Google Scholar]
- Raz N, Rodrigue KM, Kennedy KM, Head D, Gunning-Dixon F, Acker JD. Differential aging of the human striatum: longitudinal evidence. Am J Neuroradiol. 2003;24:1849–1856. [PMC free article] [PubMed] [Google Scholar]
- Resnick SM, Pham DL, Kraut MA, Zonderman AB, Davatzikos C. Longitudinal magnetic resonance imaging studies of older adults: a shrinking brain. J Neurosci. 2003;23:3295–3301. doi: 10.1523/JNEUROSCI.23-08-03295.2003. [DOI] [PMC free article] [PubMed] [Google Scholar]
- Reuter-Lorenz PA. New visions of the aging mind and brain. Trends Cogn Sci. 2002;6:394–400. doi: 10.1016/s1364-6613(02)01957-5. [DOI] [PubMed] [Google Scholar]
- Rosen AC, Prull MW, O’Hara R, Race EA, Desmond JE, Glover GH, Yesavage JA, Gabrieli JDE. Variable effects of aging on frontal lobe contributions to memory. NeuroReport. 2002;13:2425–2428. doi: 10.1097/00001756-200212200-00010. [DOI] [PubMed] [Google Scholar]
- Rypma B, D’Esposito M. Isolating the neural mechanisms of age-related changes in human working memory. Nat Neurosci. 2000;3:509–515. doi: 10.1038/74889. [DOI] [PubMed] [Google Scholar]
- Salthouse T. The processing speed theory of adult age differences in cognition. Psychol Rev. 1996;103:403–428. doi: 10.1037/0033-295x.103.3.403. [DOI] [PubMed] [Google Scholar]
- Sheikh JI, Yesavage JA. Geriatric Depression Scale (GDS): recent evidence and development of a shorter version. Clin Gerontol. 1986;15:165–173. [Google Scholar]
- Soininen HS, Partanen K, Pitkanen A, Vaino P, Hanninen T, Hallikainen M, Koivisto K, Riekkinen PJ. Volumetric MRI analysis of the amygdala and the hippocampus in subjects with age-associated memory impairment—Correlation to visual and verbal memory. Neurology. 1994;44:1660–1668. doi: 10.1212/wnl.44.9.1660. [DOI] [PubMed] [Google Scholar]
- Stebbins GT, Carrillo MC, Dorfman J, Dirksen C, Desmond JE, Turner DA, Bennett DA, Wilson RS, Glover G, Gabrieli JDE. Aging effects on memory encoding in the frontal lobes. Psychol Aging. 2002;17:44–55. doi: 10.1037//0882-7974.17.1.44. [DOI] [PubMed] [Google Scholar]
- Talairach J, Tournoux P. Co-Planar Stereotaxic Atlas of the Human Brain. Thieme Press; New York, NY: 1988. [Google Scholar]
- Thomsen T, Specht K, Hammar A, Nyttingnes J, Ersland L, Hugdahl K. Brain localization of attentional control in different age groups by combining functional and structural MRI. NeuroImage. 2004;22:912–919. doi: 10.1016/j.neuroimage.2004.02.015. [DOI] [PubMed] [Google Scholar]
- Tisserand DJ, Visser PJ, van Boxtel MPJ, Jolles J. The relation between global and limbic brain volumes on MRI and cognitive performance in healthy individuals across the age range. Neurobiol Aging. 2000;21:569–576. doi: 10.1016/s0197-4580(00)00133-0. [DOI] [PubMed] [Google Scholar]
- Tisserand DJ, van Boxtel MPJ, Pruessner JC, Hofman P, Evans AC, Jolles J. A voxel-based morphometric study to determine individual differences in gray matter density associated with age and cognitive change over time. Cereb Cortex. 2004;14:966–973. doi: 10.1093/cercor/bhh057. [DOI] [PubMed] [Google Scholar]
- Van Petten C. Relationship between hippocampal volume and memory ability in healthy individuals across the lifespan: review and meta-analysis. Neuropsychologia. 2004;42:1394–1413. doi: 10.1016/j.neuropsychologia.2004.04.006. [DOI] [PubMed] [Google Scholar]
- Volkow N, Logan J, Fowler J, Wang G, Gur R, Wong C, Felder C, Gatley S, Ding Y, Hitzemann R, Pappas N. Association between age-related decline in brain dopamine activity and impairment in frontal and cingulate metabolism. Am J Psychiatry. 2000;157:75–80. doi: 10.1176/ajp.157.1.75. [DOI] [PubMed] [Google Scholar]
- Walhovd KB, Fjell AM, Reinvang I, Lundervold A, Fischl B, Salat D, Quinn BT, Makris N, Dale AM. Cortical volume and speed-of-processing are complementary in prediction of performance intelligence. Neuropsychologia. 2005;43:704–713. doi: 10.1016/j.neuropsychologia.2004.08.006. [DOI] [PubMed] [Google Scholar]
- Warner JJ. Atlas of Neuroanatomy. Butterworth-Heinmann; Boston: 2001. [Google Scholar]
- Wechsler D. Wechsler Memory Scale—Third Edition: Administration and Scoring Manual. The Psychological Corporation; San Antonio: 1997. [Google Scholar]
- Wickett JC, Vernon PA, Lee DH. In-vivo brain size, head perimeter, and intelligence in a sample of healthy adult females. Pers Individ Differ. 1994;16:831–838. [Google Scholar]
- Yeo RA, Turkheimer E, Raz N, Bigler ED. Volumetric asymmetries of the human-brain—Intellectual correlates. Brain Cogn. 1987;6:15–23. doi: 10.1016/0278-2626(87)90043-1. [DOI] [PubMed] [Google Scholar]