

Abstract
African Americans (AAs) have the highest incidence rates of colorectal cancer (CRC) among all races in the US. These disparities may be attributed to lower participation in CRC prevention and control activities [e.g., flexible sigmoidoscopy (FS), fecal occult blood testing (FOBT)]. This is a current issue in East Harlem where less than half the residents in this area participate in CRC screening and mortality rates due to CRC are higher than the national average. We examined correlates of FS and FOBT screening among AAs based on the transtheoretical model (TTM) of behavior change. One hundred and eleven AA men and women, 50 years and older (51–92), low-income, and at average risk for CRC were recruited at an ambulatory care center in East Harlem. Assessments focused on sociodemographic, medical, psychosocial and TTM variables. The first logistic regression model showed that higher levels of education (p < 0.05), greater knowledge of FS (p < 0.05), and greater endorsements of Thinking Beyond Oneself (p < 0.05) were associated with adherence to FS screening guidelines. The second model showed that only greater knowledge of FOBT (p < 0.05) and receiving a physician’s recommendation (p < 0.01) were significant correlates of adherence to FOBT screening guidelines. This study supported the application of components of the TTM for FS and FOBT screening among low-income AAs receiving care in an urban medical center and illustrated the need for interventions targeting both patients and their providers.
Keywords: Colorectal cancer, Low-income, African Americans, Adherence, Transtheoretical model, Cancer screening
Introduction
Colorectal cancer (CRC) is the second most common cause of cancer death in the US.1 It is estimated that 145,290 new cases of colorectal cancer will be diagnosed this year (NIH Cancer Facts & Figures, 2005). Optimistically, CRC incidence rates declined by 2.2% between 1998 and 2002.2 This decline has been attributed to increases in CRC screening and polyp removal. Unfortunately, African Americans (AAs) experience the highest incidence rates of CRC across all races in the US,3 precisely 15% higher than Whites. Among AA males 72.9 per 100,000 are diagnosed with CRC compared to 61.4 per 100,000 in their White male counterparts. AA women experience similar disparities such that 56.1 per 100,000 women are diagnosed with CRC compared to 44.7 among Whites.
Up to 60% of the deaths due to CRC could be prevented by early detection and polyp removal.4 For individuals over the age of 50 and at average risk of CRC, the American Cancer Society (ACS) recommendations include fecal occult blood test (FOBT) every year, and/or flexible sigmoidoscopy (FS) testing every 5 years, double contrast barium enema every 5 years, or colonoscopy every 10 years.1 Despite recent efforts to promote screening, national CRC screening rates among the general population remain at less than 50%.5
Unfortunately, mortality rates due to CRC are also not equal across ethnicities, such that AAs face much higher fatality rates compared to their White counterparts.6 This disparity has been attributed to AAs: lower participation in CRC screening procedures compared to Whites,7,8 later detection of CRC at more lethal and harder to treat stages,9 and factors associated with post-diagnosis treatment.7 Although nationally, FOBT screening rates are comparable between AAs and Whites (16.4% and 16.3% respectively), AAs participate in endoscopy, which includes FS, less often compared to their White counterparts1 and few studies have explored why this occurs.10 According to the SEER program, only 34.8% of AAs were diagnosed with CRC in the local stages while 38.1% of Whites were diagnosed earlier on. Moreover, 23.3% of AAs were diagnosed when CRC reached distant, more severe stages, compared to only 19% among Whites.9 Lastly, even after controlling for stage of disease and age at diagnosis, AAs demonstrate lower survival rates after being diagnosed with CRC (males = 56.1%, females = 57.0%) compared to their White counterparts (males = 64.0%, females = 63.4%)11 suggesting that factors post-diagnosis (e.g., access to treatment) also influence disparities in mortality rates. Together these findings support the need for increased preventive CRC screening among this population8 and additional understanding of the barriers to participation in CRC screening among AAs.
The problem of recruiting low-income AAs to CRC screening is an immediate issue in East Harlem, the location of the present study, where less than half the residents in this area currently participate in CRC screening.12,13 Although incidence rates of CRC in East Harlem (males = 56.8%, females = 55.4%) differ from national rates (males = 67.1%, females = 48.7%),14 once diagnosed with CRC East Harlem residents experience higher mortality rates compared to the national average (31.3 males and 18.5 females per 100,000 compared to 25.3 and 17.1 respectively). As mentioned above, many of these deaths could have been prevented by increased participation in CRC screening. However, despite these disparities, no prior research has examined factors contributing to the lack of participation in CRC screening among AAs living in this urban community.
Previous research primarily focusing on the general population has shown that age, gender, education, income, and health insurance are associated with CRC screening.5 Physician recommendation and knowledge of CRC screening have been found to be strong correlates of CRC screening.5,15,16 Cancer fatalism is a psychological construct characterized by perceptions of “hopelessness, worthlessness, meaninglessness, powerlessness, and social despair”17 that has been found to be associated with cancer screening among AAs.18 For example, individuals who endorse fatalistic beliefs may believe that cancer is a death sentence. Greiner et al.19 also found that fatalism was associated with completion of FOBT among a group of low-income, predominantly AA individuals. However, among a group of AA and Hispanic women, Dettenborn et al.20 did not find fatalism to be a significant correlate of gynecological cancer screening. The current study seeks to further clarify these inconsistencies among low-income AAs regarding the relation of fatalism and CRC screening.
Furthermore, there are few theoretically based studies to understand non-adherence to CRC screening procedures among low-income or AA populations. The health belief model21 (HBM) and transtheoretical model22 (TTM) are among the primary theories that have been applied to prevention research. Guided by the HBM, Green and Kelly23 found that greater perceived barriers and risk were associated with lower participation in CRC screening. Using the TTM, Brenes and Paskett24 explored the predictors of stage of adoption for CRC screening among low-income AA women. They found that most of their participants were in the precontemplation stage of adoption, meaning that women had not had a FS in the last 5 years and had no intention to do so within the next year. More recently, Trauth et al.25 also found the TTM to be an effective model to understand FS and FOBT screening among low-income populations. Manne et al.26 integrated factors from the HBM and TTM to identify factors associated to CRC screening among individuals with a sibling with CRC. They found that perceived pros and cons, perceived risk, Commitment to Screening and Avoidance of the Health Care System (both indices of processes of change) were significantly associated with screening compliance and stage of adoption.
Although previous studies have demonstrated support for the application of health prevention theory to CRC screening, they primarily used convenient samples that did not focus specifically on underserved low-income, AA, urban populations, and did not include both men and women. In addition, despite the fact that approximately 75% of CRC occurs in individuals at average risk, (e.g., individuals with no first-degree relative with a history of CRC),27,28 most of the prior studies conducted did not verify whether participants were at average risk for CRC. Lastly, some of the previous research in this area has not included the concept of fatalism, which has been suggested to be particularly important for AAs.
This study aims to enhance the understanding of factors associated with adherence to CRC screening recommendations and stage of adoption for CRC screening among a sample of low-income AAs at average risk for CRC in a primary care setting in East Harlem using measures guided by the TTM as well as the construct of fatalism. Based on previous findings, we hypothesize that sociodemographic factors (gender, age, income) will be significantly associated with CRC screening. We also expect a significant relationship among knowledge of CRC screening, physician’s recommendation for screening, and perceived risk of CRC and CRC screening. Among the TTM factors, we anticipate that more pros than cons to screening, as well as participation in behavioral change strategies (e.g., Commitment to Screening), will be positively associated to CRC screening. Lastly, we hypothesize that fatalistic beliefs will be negatively associated with CRC screening.
Materials and Methods
Procedures
Participant recruitment and data collection for this study were conducted from 1999 to 2001, prior to HIPAA regulations. The study was approved by the Mount Sinai School of Medicine Institutional Review Board. All study participants provided written or verbal consent. Eligibility requirements included (a) AA by self-report, (b) over the age of 51 (allowing for 12 months to comply with CRC screening guidelines), (c) accessible by residential telephone, (d) English speaking and (e) at average risk for CRC.
Potential participants were identified from an ambulatory care center located in an urban hospital center. Patients’ records were reviewed to identify those who met eligibility requirements. Eligible participants were sent letters describing the study. Interested participants were interviewed over the telephone or in person at a time of their convenience. Participants were provided minimal incentives for study participation.
Measures
Socio-demographic Information These variables included gender, age, income level, education level, and marital status.
Medical History We assessed cancer history and use of the medical system using three items. One item asked patients about their history of cancer. In two separate items, we assessed the frequency of health care visits and whether participants visited their primary care physician regularly (once a year or more).
Knowledge of CRC Screening Knowledge of CRC screening was assessed using two items that asked participants, “Have you ever heard of flexible sigmoidoscopy?” and “Have you heard of fecal occult blood tests?” After assessing knowledge of CRC screening, all participants were provided education regarding both FS and FOBT to facilitate their responses to future questions concerning their intention to participate in CRC screening.
Physician Recommendation and Influence Physician recommendation was measured by a single item that asked, “Has your doctor ever asked you to get a colorectal cancer screening?” Physician influence was indexed using 15 items consisting of two scales, which were calculated separately for FS (α = 0.80) and FOBT (α = 0.81).29–31 Two additional single items assessed perceived physician support for FS and FOBT respectively. A summary score of the 17 items was calculated for physician’s influence of FS and FOBT such that higher scores were associated with stronger physician influence and support.
Perceived Risk of CRC Perceived risk was assessed with one item measuring belief in the likelihood of having CRC. Participants’ responses were on a five point Likert-type scale and then dichotomized into less than average risk (scores ≤ 3) and higher than average risk (scores ≥ 3).
Fatalism The Powe fatalism inventory18 was used to assess fatalism about cancer. This 15-item scale consisted of dichotomous items that assess characteristics of cancer fatalism including: fear, pessimism, inevitability of death, and predetermination (α = 0.85).
Process of Change Four Process of Change indices specific to CRC were used to assess behaviors associated with screening. These indices were adapted by Manne et al.26 from Rakowski et al.’s32 measure including: Commitment to Screening (six items, α = 0.83), Information Sharing and Communication (six items, α = 0.49), Thinking Beyond Oneself (five items, α = 0.58), and Avoidance of the Health Care System (four items, α = 0.64). The internal consistency for three of the four indices of Process of Change were moderately low; however, considering the exploratory nature of this study these measures were retained in the analysis.
Pros and Cons of Colorectal Cancer Screening This 28-item scale26 assessed attitudes regarding the advantages/pros (nine questions, α = 0.70), and disadvantages/cons (19 questions, α = 0.83) of CRC screening. In addition to total scores of pros and cons, an index score of decisional balance was computed (pros minus cons).
Adherence to CRC Screening Guidelines Adherence was based on the 2005 ACS screening guidelines1 since these have not changed since the time the study was conducted between 1999 and 2001. We assessed adherence by asking individuals whether they had ever undergone FS or FOBT testing, and if so, the dates of their last two tests. Based on ACS screening guidelines,1 participants were considered adherent to FS screening guidelines if they participated in FS within 5 years prior to their interview, and adherent to FOBT if they participated in testing within the last year.
Stage of Adoption In addition to considering adherence to screening guidelines, stage of adoption was assessed to also consider an individual’s intent to participate in CRC screening in the future. Previous studies have grouped participants into six stages of adoption for cancer screening26 (i.e., Never Heard, Precontemplation, Relapse/Risk for Relapse, Contemplation, Action, and Maintenance). Considering the distribution of scores across these six stages (e.g., few members were grouped in Precontemplation [defined as having heard of FS or FOBT, but has not had screening and has no plan for any in the next year (N = 0)] and Contemplation [defined as having never had the procedure before, but considering in the next year (N = 2 for FS, N = 2 for FOBT)]), participants were grouped into three stages of adoption of CRC screening: 1) Never Heard; 2) Relapse/Risk for Relapse; 3) Action/Maintenance. Figure 1 provides the definitions and distributions of stages of adoption for FS and FOBT.
Figure 1.
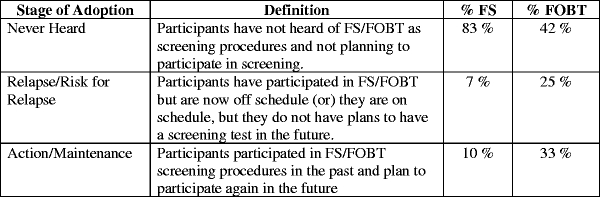
Definitions and distributions of stage of adoption for FS and FOBT
Analytic Plan Two participants did not complete all of the items of the fatalism questionnaire (one participant missed 2 items and the other missed 6 of the 15 items), and these items were replaced by the average of the participants’ scores within that same measure. Single item variables were left as missing and the number of participants included in each analysis are noted in the tables. Analyses were conducted in two steps. First, univariate analyses were conducted between the sociodemographic, medical, psychosocial (knowledge of CRC screening, physician recommendation and influence regarding CRC screening, perceived risk of CRC, cancer, and heart disease, fatalism), TTM (processes of change, pros and cons to CRC screening, decisional balance) factors and the four outcome variables: adherence to FS screening guidelines, adherence to FOBT screening guidelines, stage of adoption of FS, and stage of adoption of FOBT. Chi-square and Fisher exact tests were used for categorical data. Student unpaired independent t tests were used for continuous data. Next, two logistic regressions examined significant factors associated with 1) adherence to FS screening guidelines and 2) adherence to FOBT screening guidelines. The SAS LOGISTIC procedure was used (SAS 9.1).
Results
Of 207 eligible individuals who were initially recruited to participate in the study, 83 (40%) refused participation, 9 (4%) were unable to be scheduled within the recruitment period, and 4 (2%) did not complete the interview, leaving 111 (54%) participants. Of those who gave a reason for refusal, the most common were disinterest (N = 16) and having other pressing issues (N = 9).
Sample characteristics are provided in Table 1. Sixty-three females and 48 males were included in the analyses. Participants ranged between 51 and 92 years of age (mean 63) and were from lower socioeconomic backgrounds (60% earned < $10,000 per year, 51% completed less than 12 years of education). The majority of the participants were not currently married (82%).
Table 1.
Sociodemographic, medical, psychosocial characteristics of respondents overall and adherence to FS screening guidelines
| Predictor | Overall | Adherent | Non-adherent | p value |
|---|---|---|---|---|
| 111 | 12 (10%) | 99 (90%) | ||
| Sociodemographic factors | ||||
| Age | ||||
| 50–59 | 43 (39%) | 8 | 35 | 0.100 |
| 60–69 | 43 (39%) | 2 | 41 | |
| 70+ | 25 (39%) | 2 | 23 | |
| Gender | ||||
| Male | 48 (43%) | 5 | 43 | 0.580 |
| Female | 63 (57%) | 7 | 56 | |
| Education | ||||
| Less than HS | 56 (51%) | 2 | 54 | 0.012* |
| More than HS | 54 (49%) | 10 | 44 | |
| Married | ||||
| Married | 20 (18%) | 11 | 80 | 0.320 |
| Not married | 91 (82%) | 1 | 19 | |
| Income | ||||
| Less than $10,000 | 66 (60%) | 5 | 61 | 0.135 |
| More than $10,000 | 43 (39%) | 7 | 36 | |
| Medical factors | ||||
| History of cancer | ||||
| Yes | 15 (14%) | 2 | 13 | 0.506 |
| No | 96 (86%) | 10 | 86 | |
| Number of doctor visits annually | 9.31 (±12.3) | 8.88 (±9) | 9.37 (±13) | 0.961 |
| Visits physician regularly | ||||
| Yes | 105 (95%) | 12 | 93 | 0.065 |
| No | 6 (5%) | 0 | 6 | 0.495 |
| Psychosocial factors | ||||
| Perceived risk of CRC | ||||
| More than average | 70 (63%) | 6 | 64 | 0.622 |
| Less than average | 37 (27%) | 3 | 34 | |
| Knowledge of FS | ||||
| Has not heard of FS | 80 (72%) | 4 | 76 | 0.001** |
| Heard of FS | 27 (24%) | 8 | 19 | |
| Not sure if heard | 4 (4%) | 0 | 4 | |
| Doctor recommended screening | 76 (69%) | 12 | 64 | 0.008** |
| Doctor did not recommend screening | 32 (29%) | 0 | 35 | |
| Physician influence for FS | 47.71 (±12.9) | 55.83 (±8) | 46.72 (±13) | 0.020* |
| Fatalism | 6.0 (±4) | 5.41 (±4) | 6.07 (±4) | 0.581 |
| TTM factors | ||||
| Commitment to regular screening | 20.9 (±7) | 25.25 (±5) | 20.36 (±7) | 0.024* |
| Information sharing and communication | 25.7 (±4) | 27.08 (±4) | 25.48 (±3) | 0.178 |
| Thinking beyond oneself | 12.9 (±4.7) | 17.08 (±4) | 12.43 (±4) | 0.001* |
| Avoidance of the health care system | 7.0 (±3) | 6.17 (±3) | 7.14 (±3) | 0.303 |
| Total pros | 38.5 (±5) | 40.25 (±7) | 38.25 (±5) | 0.22 |
| Total cons | 40.9 (±12) | 34.67 (±10) | 41.64 (±12) | 0.061 |
| Decisional balance | 2.4 (±15) | 3.35 (±14) | −5.58 (±16) | 0.048* |
*p < 0.05
**p < 0.001
Factors Associated with Adherence to FS Screening Guidelines
Participants were considered adherent to FS screening guidelines if they participated in FS screening within the last 5 years. As shown in Table 1, only 10% of the sample was adherent to FS screening guidelines. Education (p < 0.01) was the only sociodemographic factor significantly associated to adherence. Among the psychosocial factors, knowledge of FS (p < 0.01), physician’s recommendation to participate in screening (p < 0.01), and greater physician’s influence (p < 0.05) demonstrated significant relationships to adherence. Perceived risk and fatalism were not found to be significantly associated to adherence to FS screening guidelines. Among the TTM factors, two processes of change indices, Commitment to Screening (p < 0.05) and Thinking Beyond Oneself (p < 0.01) were significantly associated to adherence. Lastly, decisional balance (p < 0.05) was also found to be a significant predictor of adherence such that endorsements of more pros than cons to CRC screening were associated to adherence to FS screening guidelines.
Next, the significant factors in the univariate analysis were entered into a logistic regression. Only level of education (Wald chi-square = 4.56; p = 0.03; O.R. 0.162; C.I. 0.030–0.861), knowledge of FS (Wald chi-square = 3.86; p = 0.05; O.R. 3.19; C.I. 1.003–10.16), and Thinking Beyond Oneself (Wald chi-square = 6.68; p = 0.01; O.R. 1.23; C.I. 1.051–1.433) remained significant correlates of adherence to FS screening guidelines. Individuals who received higher education or who had knowledge of FS were more likely to adhere to FS screening guidelines. In addition, individuals who participated in CRC screening for the sake of others or to be healthy for their loved ones were more likely to adhere to FS screening guidelines.
Factors Associated to Adherence with FOBT Screening Guidelines
Participants were considered adherent to FOBT screening guidelines if they participated in FOBT within the last year. Approximately one-third of the participants were adherent to FOBT screening guidelines (Table 2). None of the sociodemographic or medical factors were associated to adherence with FOBT screening guidelines. Again, perceived risk and fatalism were not related to adherence to FOBT screening guidelines. Knowledge of CRC screening (p < 0.01) and physician recommendation (p < 0.01) were associated with adherence to FOBT screening guidelines. Among the TTM processes of change, higher scores on the Commitment to Regular Screening (p < 0.05) and the Information Sharing and Communication (p < 0.01) indices were associated with FOBT screening adherence. Fewer cons of CRC screening was associated to adherence (p < 0.05) and this was also reflected in the significance of decisional balance (pros minus cons, p < 0.05).
Table 2.
Sociodemographic, medical, psychosocial characteristics of adherence to FOBT screening guidelines
| Predictor | Adherent | Non-adherent | p value |
|---|---|---|---|
| 37 (33%) | 74 (67%) | ||
| Sociodemographic factors | |||
| Age | 0.274 | ||
| 50–59 | 11 | 32 | |
| 60–69 | 18 | 25 | |
| 70+ | 8 | 17 | |
| Gender | 0.410 | ||
| Male | 15 | 33 | |
| Female | 22 | 41 | |
| Education | 0.189 | ||
| Less than HS | 21 | 35 | |
| More than HS | 15 | 39 | |
| Married | 0.421 | ||
| Married | 8 | 21 | |
| Not married | 29 | 62 | |
| Income | 0.449 | ||
| Less than $10,000 | 21 | 45 | |
| More than $10,000 | 15 | 28 | |
| Medical factors | |||
| History of cancer | 0.624 | ||
| Yes | 5 | 10 | |
| No | 32 | 64 | |
| Number of Dr. visits annually | 10.19 (±16) | 8.89 (±10) | 0.602 |
| Visits physician regularly | 0.345 | ||
| Yes | 36 | 69 | |
| No | 1 | 5 | |
| Psychosocial factors | |||
| Perceived risk of CRC | 0.101 | ||
| More than average | 27 | 28 | |
| Less than average | 9 | 43 | |
| Knowledge of FOBT | 0.004** | ||
| Has not heard of FOBT | 6 | 35 | |
| Heard of FOBT | 31 | 38 | |
| Not sure if heard of FOBT | 0 | 1 | |
| Doctor recommended screening | 33 | 43 | 0.001** |
| Doctor did not recommend screening | 4 | 31 | |
| Fatalism | 5.92 (±3) | 6.04 (±4) | 0.876 |
| TTM Factors | |||
| Commitment to regular screening | 23.24 (±6) | 19.71 (±7) | 0.013* |
| Information sharing and communication | 26.97 (±2) | 25.0 (±4) | 0.003** |
| Thinking beyond oneself | 13.27 (±5) | 12.77 (±4) | 0.600 |
| Avoidance of the health care system | 6.24 (±3) | 7.43 (±3) | 0.055 |
| Total pros | 39.16 (±6) | 38.12 (±5) | 0.334 |
| Total cons | 37.03 (±11) | 42.81 (±12) | 0.018* |
| Decisional balance | 4.69 (±14) | −2.14 (±15) | 0.022* |
*p < 0.05
**p < 0.001
All the significant variables from the univariate analysis for adherence to FOBT screening guidelines were entered into a second logistic regression. The model revealed that only knowledge of FOBT (Wald chi-square = 8.66; p < 0.01; O.R. 4.59; C.I. 1.66–12.64) and physician recommendation (Wald chi-square = 8.89; p < 0.01; O.R. 0.17; C.I. 0.05–0.54) remained significant correlates to adherence to FOBT screening guidelines. Again, individuals who had heard of FOBT or received a physician’s recommendation to participate in CRC screening were more likely to adhere to FOBT screening guidelines.
Factors Associated with Stage of Adoption of FS
We conducted univariate analyses to examine factors associated with stage of adoption. Most participants had not heard of FS (N = 92), while a few individuals were in the Relapse/Risk for Relapse (N = 8) and Action/Maintenance (N = 11) stages of adoption of FS (Figure 1). None of the sociodemographic or medical factors were significantly correlated with stage of adoption of FS. Perceived risk of CRC (p = 0.61) and fatalism (p = 0.70) were also not associated with stage of adoption of FS. Individuals in the Never Heard stage were less likely to have received a physician’s recommendation (p < 0.03) to participate in CRC screening and endorsed fewer items of physician influence (p < 0.05) compared to those in the Relapse/Risk for Relapse and Action/Maintenance stages. Individuals who endorsed more items on the Thinking Beyond Oneself index were more likely to be in higher stages of adoption of FS (p < 0.01). Considering the few variables found to be significantly associated with stage of adoption, additional regression analyses were not conducted for this outcome variable.
Factors Associated with Stage of Adoption of FOBT
The majority of participants were in the Never Heard stage of adoption of FOBT screening (N = 47), while the second largest group fell in the Action/Maintenance stage (N = 36), followed by the Relapse/Risk for Relapse (N = 28) stage of adoption to CRC screening (Figure 1). Univariate analyses showed that no sociodemographic, medical or TTM factors were significantly associated with stage of adoption of FOBT. Perceived risk (p = 0.21) and fatalism (p = 0.93) were not significant correlates of stage of adoption of FOBT. Similar to findings regarding adherence, individuals who had heard of FOBT (p < 0.05) or received a physician’s recommendation to participate in CRC screening (p < 0.05) were more likely to be in higher stages of adoption of FOBT.
Discussion
This study examined barriers and facilitators to FS and FOBT screening in a low-income AA sample at average risk for CRC receiving primary care at a medical center in East Harlem. Consistent with regional data on CRC screening, adherence to CRC screening guidelines was low among this sample. Moreover, results showed that participants were less adherent with FS compared to FOBT screening guidelines. This may be attributed to the increased invasiveness of FS compared to FOBT, eliciting an additional individual barrier. This finding is similar to previous studies25 and highlights the need to tailor educational materials to each specific screening procedure.
Considering the low levels of adherence to CRC screening guidelines among this sample, exploring stage of adoption serves as an additional attempt to understanding the different levels of motivation to screen among low-income AAs. Results of this study complement as well as contradict previous reports. Similar to prior reports26 Information Sharing and Communication was associated with stage of adoption of FOBT. However, contrary to previous reports, none of the processes of change remained significantly associated with stage of adoption of FS in multivariate analysis.32,26 These discrepancies may be due to the modest sample size. In addition, there may have been less heterogeneity regarding participation in FS between groups in this study, as most participants had never heard of FS, making it more difficult to demonstrate associations.
Contrary to previous findings, fatalism did not present as a significant correlate of CRC screening among this AA population. Fatalism’s non-significance in this current study may be associated with the non-significance of participants’ perceived risk of CRC. Considering individuals may have a limited ability to assess their personal risk of CRC,33 perhaps having strong fatalistic beliefs exacerbates misconceptions regarding the risk of CRC. Future research should examine the relationship between fatalism and perceived risk and their interactive effect on CRC screening.
Results from this study highlight the importance of the physician’s role in referring patients for CRC screening and educating them about the procedures to encourage adherence to CRC screening guidelines. Moreover, results remind us of the interdependence between patients and providers. While more attention has turned towards patient directed initiatives, physicians are primarily responsible for the management of patients.34 Considering the significance of physician influence and support on screening, targeting physicians as well as patients may improve participation in CRC screening, particularly among ethnic minorities.
This study also showed that behavioral change strategies such as Commitment to Screening, Thinking Beyond Oneself, and Information Sharing and Communication are significant factors to CRC screening among low-income AAs. Considering that these factors have been shown to be amenable to change, interventions should target these strategies to promote CRC screening.
Study Strengths and Limitations
This study examined adherence and stage of adoption of FS and FOBT among a low-income, urban African American population at average risk for CRC. A strength of this study is that participants were recruited from a primary care clinic in East Harlem where they routinely receive their care. Participants were for the most part actively engaged in the medical system (reported mean 9.31 S.D ± 12 visits to their physician annually) suggesting that access to medical care is not a likely barrier to CRC screening for this sample. Despite active participation in the health care system among this sample, results illustrated barriers to specific CRC screening procedures as opposed to participating in health care in general. Additional efforts tailored to specific screening procedures and targeting behavioral changes strategies are warranted.
A limitation of this study is that it is difficult to discern whether patients are participating in CRC screening as a regular preventive measure or for diagnostic purposes. Health promotion efforts encourage CRC testing typically as a preventive measure, hence it is important to specify whether individuals experience barriers to CRC screening or CRC diagnostic procedures. Our review of the literature has not found prior studies that discriminate between the rationales behind CRC testing; however, future studies may benefit from making this discrimination to enhance health promotion efforts. The findings of this study are also limited by its modest sample size and the low reliability among the processes of change measures. Unfortunately, the sample size is not adequate to conduct a component factor analysis to verify that the four processes of change were indeed distinct factors among this sample. The results of this study should be replicated and expanded using a larger sample. Another limitation of this study is that it only assessed FS and FOBT screening methods and excluded colonoscopy as the study was conducted prior to reimbursement for screening colonoscopy by Medicaid and Medicare. Considering the current trend towards recommendation of colonoscopy over FS and FOBT,35 as well as recent reforms to provide Medicaid and Medicare coverage of colonoscopy, future studies should include colonoscopy as a screening method when examining CRC screening among all ethnic groups.
Findings of this study support the application of components of the TTM to FS and FOBT screening in low-income AAs living in an urban area. Future studies with larger sample sizes are needed to assess patients, providers, and their inter-relationship in association with CRC screening among low-income AAs. In addition, promotion of CRC screening will likely benefit from building upon the results of this study to develop stage-matched interventions targeting both patients and their providers.
Acknowledgments
This project was funded by Grant No. NIH-CA84809 from the National Institutes of Health. The writing of this paper was supported by Grant No. NCI-CA81137-05 from the National Cancer Institute. The authors would like to extend thanks to Gary Winkel, Ph.D. for his statistical guidance throughout this study and Justin Michener, M.A. for his assistance with data management.
Footnotes
Lawsin, DuHamel, and Jandorf are with the Department of Oncological Sciences, Mount Sinai School of Medicine, New York, NY, USA; Weiss is with the Department of Medicine, Mount Sinai School of Medicine, New York, NY, USA; Rakowski is with the Department of Community Health, Brown University, Providence, RI, USA.
References
- 1.American Cancer Society. Cancer Facts and Figures for African Americans 2005–2006. Atlanta, Georgia: American Cancer Society; 2005.
- 2.Ries LAG, Eisner MP, Kosary CL, Hankey BF, Miller BA. SEER Cancer Statistics Review, 1975–2000. Bethesda, Maryland: NCI. Accessed on November 2005. Available at http://seer.cancer.gov/csr/1975_200.
- 3.Ries L, Eisner M, Kosary C. SEER Cancer Statistics Review, 1973–1999. Bethesda, Maryland: National Cancer Institute; 2002.
- 4.CDC. Trends in screening for colorectal cancer—United States, 1997 and 1999. MMWR. 2001;50:162–166. [PubMed]
- 5.Seeff LC, Nadel MR, Klabunde C, et al. Patterns and predictors of colorectal cancer test use in the adult U.S. population. Cancer. 2004;100(10):2093–2103. [DOI] [PubMed]
- 6.Cooper GS, Yuan Z, Rimm AA. Racial disparity in the incidence and case-fatality of colorectal cancer: analysis of 329 United States counties. Cancer Epidemiol Biomark Prev. 1997;6(4):283–285. [PubMed]
- 7.Center for Disease Control and Prevention. National Health Interview Survey Public Data Use File 2000. National Center for Health Statistics.
- 8.Polite BN, Dignam JJ, Olopade OI. Colorectal cancer model of health disparities: understanding mortality differences in minority populations. J Clin Oncol. 2006;24(14):2179–2187, May 10. [DOI] [PubMed]
- 9.Ries LAG, Eisner MP, Kosary CL, et al. SEER Cancer Statistics Review, 1975–2002. Bethesda, Maryland: National Cancer Institute; 2005.
- 10.James AS, Campbell MK, Hudson MA. Perceived barriers and benefits to colon cancer screening among African Americans in North Carolina: how does perception relate to screening behavior? Cancer Epidemiol Biomark Prev. 2002;11(6):529–534, June. [PubMed]
- 11.American Cancer Society. Colorectal Cancer Facts and Figures Special Edition, 2005. Atlanta: American Cancer Society, Inc.; 2005.
- 12.Cancer Incidence and Mortality by Race and Region, 1999–2003. New York State. Department of Health, New York State Cancer Registry. Available at: http://www.health.state.ny.us/statistics/cancer/registry/table4/tb4whitenys.htm. Accessed February 13, 2006.
- 13.Cancer Incidence and Mortality by NYC Neighborhood, 1999–2003. New York State. Department of Health, New York State Cancer Registry. Available at http://www.health.state.ny.us/statistics/cancer/registry/vol1/v1neastharlem.htm. Accessed February 13, 2003.
- 14.American Cancer Society. Colorectal Cancer Facts and Figures Special Edition 2005. Atlanta, Georgia: American Cancer Society; 2005.
- 15.Friedman L, Webb J, Everett T. Psychosocial and medical predictors of colorectal cancer screening among low-income medical outpatients. J Cancer Educ. 2004;19(3):180–186. [DOI] [PubMed]
- 16.Gilbert A, Kanarek N. Colorectal cancer screening: physician recommendation is influential advice to Marylanders. Prev Med. 2005;41(2):367–379. [DOI] [PubMed]
- 17.West C. Race Matters. Boston, Massachusetts: Beacon; 1993.
- 18.Powe BD. Cancer fatalism among elderly African Americans: effects on colorectal cancer screening. Cancer Nurs. 1995;18:385–392. [DOI] [PubMed]
- 19.Greiner KA, Born W, Nollen N, Ahluwalia JS. Knowledge and perceptions of colorectal cancer screening among urban African Americans. J Gen Intern Med. 2005;20(11):977–983. [DOI] [PMC free article] [PubMed]
- 20.Dettenborn L, DuHamel K, Butts G, Thompson H, Jandorf L. Cancer fatalism and its demographic correlates among African American and Hispanic women: effects on adherence to cancer screening. J Psychosoc Oncol. 2004;22(4):47–60. [DOI]
- 21.Janz NK, Becker MH. The health belief model: a decade later. Health Educ Q. 1984;11:1–47. [DOI] [PubMed]
- 22.Prochaska JO, DiClemente CC. Stages and processes of self-change in smoking: toward an integrative model of change. J Consult Clin Psychol. 1983;5:390–395. [DOI] [PubMed]
- 23.Green PM, Kelly BA. Colorectal cancer knowledge, perceptions, and behaviors in African Americans. Cancer Nurs. 2004;27(3):206–215. [DOI] [PubMed]
- 24.Brenes GS, Paskett ED. Predictors of stage of adoption for colorectal cancer screening. Prev Med. 2000;31(4):410–416. [DOI] [PubMed]
- 25.Trauth JM, Ling BS, Weissfeld JL, Schoen RE, Hayran M. Using the transtheoretical model to stage screening behavior for colorectal cancer screening. Health Educ Behav. 2003;30(3):322–336. [DOI] [PubMed]
- 26.Manne S, Markowitz A, Winawer S, et al. Correlates of colorectal cancer screening compliance and stage of adoption among siblings of individuals with early onset colorectal cancer. Health Psychol. 2002;21(1):3–15. [DOI] [PubMed]
- 27.Walsh JM, Terdiman JP. Colorectal cancer screening: clinical applications. JAMA. 2003;289:1297–1302. [DOI] [PubMed]
- 28.Winawer SJ, Schottenfeld D, Flehinger BJ. Colorectal cancer screening. J Natl Cancer Inst. 1991;83:243–253. [DOI] [PubMed]
- 29.Myers RE, Ross E, Jepson C, et al. Modeling adherence to colorectal cancer screening. Prev Med. 1994;23:142–151. [DOI] [PubMed]
- 30.Myers RE, Trock BJ, Lerman C, Wolf R, Ross E, Engstrom PF. Adherence to colorectal cancer screening in an HMO population. Prev Med. 1990;19:502–514. [DOI] [PubMed]
- 31.Myers RE, Wolf TA, McKee L, et al. Factors associated with intention to undergo annual prostrate cancer screening among African American men in Philadelphia. Cancer. 1996;78:471–479. [DOI] [PubMed]
- 32.Rakowski W, Ehrich B, Dube CE. Screening mammography and constructs from the transtheoretical model: associations using two definitions of stage of adoption. Annals Behav Med. 1996;18(2):91–100. [DOI] [PubMed]
- 33.Robb KA, Miles A, Wardle J. Subjective and objective risk of colorectal cancer (UK). Cancer Causes Control. 2004;15:21–25. [DOI] [PubMed]
- 34.Horner RD, Salazar W, Geiger HJ, et al. Changing healthcare professionals’ behaviors to eliminate disparities in healthcare: what do we know? How might we proceed? Am J Manag Care. 2004;SP12–SP19, September. [PubMed]
- 35.Iuannou GN, Chapko MK, Dominitz JA. Predictors of colorectal cancer screening participation in the United States. Am J Gastroenterol. 2003;98:2082–2090. [DOI] [PubMed]