Abstract
Scoliosis is thought to progress during growth because spinal deformity produces asymmetrical spinal loading, generating asymmetrical growth, etc. in a ‘vicious cycle.’ The aim of this study was to test quantitatively whether calculated loading asymmetry of a spine with scoliosis, together with measured bone growth sensitivity to altered compression, can explain the observed rate of scoliosis progression in the coronal plane during adolescent growth. The simulated spinal geometry represented a lumbar scoliosis of different initial magnitudes, averaged and scaled from measurements of 15 patients’ radiographs. Level-specific stresses acting on the vertebrae were estimated for each of 11 external loading directions (‘efforts’) from published values of spinal loading asymmetry. These calculations assumed a physiologically plausible muscle activation strategy. The rate of vertebral growth was obtained from published reports of growth of the spine. The distribution of growth across vertebrae was modulated according to published values of growth sensitivity to stress. Mechanically modulated growth of a spine having an initial 13° Cobb scoliosis at age 11 with the spine subjected to an unweighted combination of eleven loading conditions (different effort direction and magnitude) was predicted to progress during growth. The overall shape of the curve was retained. The averaged final lumbar spinal curve magnitude was 32° Cobb at age 16 years for the lower magnitude of effort (that produced compressive stress averaging 0.48 MPa at the curve apex) and it was 38° Cobb when the higher magnitudes of efforts (that produced compressive stress averaging 0.81 MPa at the apex). An initial curve of 26° progressed to 46° and 56°, respectively. The calculated stresses on growth plates were within the range of those measured by intradiscal pressures in typical daily activities. These analyses predicted that a substantial component of scoliosis progression during growth is biomechanically mediated. The rationale for conservative management of scoliosis during skeletal growth assumes a biomechanical mode of deformity progression (Hueter-Volkmann principle). The present study provides a quantitative basis for this previously qualitative hypothesis. The findings suggest that an important difference between progressive and non-progressive scoliosis might lie in the differing muscle activation strategies adopted by individuals, leading to the possibility of improved prognosis and conservative or less invasive interventions.
Keywords: Scoliosis, Progression, Simulation, Growth, Biomechanics
Introduction
The scoliosis deformity of the spine presents considerable challenges in its prognosis and prevention of progression during adolescent growth. This is true whether the scoliosis is congenital, neuromuscular, or idiopathic. Adolescent idiopathic scoliosis (AIS) is the most prevalent, and current thinking emphasizes school screening, early intervention with bracing, and surgical treatment with increasingly sophisticated internal fixation in the event of unsuccessful conservative management [3]. The etiology of AIS is unknown, the efficacy of bracing is being questioned [13], and eventual surgical treatment by multi-level arthrodesis of the spine is not a desirable outcome. Biomechanical factors are thought to be involved in scoliosis progression.
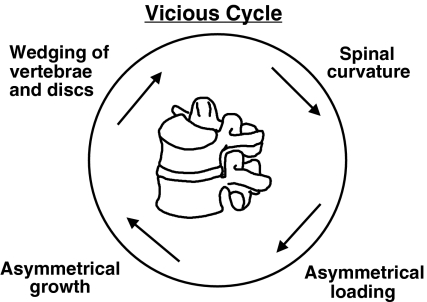
Progressive postnatal skeletal growth deformity such as scoliosis is often attributed to the ‘Hueter-Volkmann Law’ of mechanically modulated endochondral growth. Scoliosis progresses most rapidly during adolescent growth [8]. It is commonly assumed that a spine with scoliosis experiences greater loading on the concave side and that this asymmetrical loading causes asymmetrical growth and progression of deformity in a ‘vicious cycle’ (Fig. 1) [19, 20]. However, this is a qualitative explanation of the presumed mechanism of progression. This paper reports a quantitative analysis of the rate of scoliosis progression associated with asymmetrical spinal loading.
Fig. 1.
The vicious cycle that represents the widely accepted qualitative explanation for the mechanism of scoliosis progression by mechanical modulation of growth (Hueter-Volkmann ‘law’)
Although scoliosis curvature of the spine results from a combination of disc and vertebral wedging, the relative contributions of these two structures is not well defined [22]. In a radiographic study, Stokes and Aronsson [22] found that the relative amounts of vertebral and discal wedging was relatively constant in idiopathic scoliosis and in scoliosis secondary to cerebral palsy, and for different stages of development of the curve, with somewhat greater wedging of the discs relative to the vertebrae in the lumbar spine, and the opposite in the thoracic region. The vertebrae have been shown to be responsible for almost all of the growth of the spine in adolescent years [27]. Therefore, the present study focused on the mechanism of curve progression due to asymmetrical vertebral growth, while also recognizing the contribution of the discs.
Human vertebrae grow by distinct mechanisms, similar to long bones (but human vertebrae lack ossified epiphyseal plates). Vertebral growth plates adjacent to the discs generate longitudinal growth, while the vertebrae increase in diameter by appositional growth [5]. The endochondral growth can be modulated by sustained loading [20, 23]. Biomechanical influences on the postnatal modeling and remodeling of intervertebral discs have not been described, but the underlying mechanisms are probably quite different from those in the vertebrae.
Vertebral wedging has been produced by asymmetrical growth in asymmetrically loaded vertebral growth plates in a rat tail model (without evidence of diaphyseal remodeling) by Mente et al. [11]. After 4 weeks, the intervertebral discs were observed to develop a ‘structural’ deformity (i.e., with disc asymmetry), with approximately equal wedging of both vertebrae and discs. In an analytical simulation, Villemure et al. [30] modeled spinal growth and deformity progression using estimated spinal asymmetrical loading based on gravity (bodyweight) forces in the standing posture and heuristic estimates growth sensitivity to load. The predicted amount of curve progression supported the ‘vicious cycle’ hypothesis, but the vicious cycle remains a qualitative explanation for the mechanism of progressive deformity.
The objective of this study was to test quantitatively whether calculated loading asymmetry of a spine with scoliosis, together with measured bone growth sensitivity to altered compression, could explain the observed rate of spinal curvature progression in the coronal plane during adolescent growth, according to the ‘vicious cycle’ hypothesis.
Methods
The analyses of the mechanically mediated progression of scoliosis deformity were based on the ‘vicious cycle’ theory (Fig. 1). Quantitative analysis of this process required: (1) calculating compressive stress distribution acting on vertebrae in a curve of varying scoliosis magnitude. These stress analyses employed previously published data on forces acting on a spine with scoliosis; (2) incorporation of published data on vertebral and discal growth during the adolescent years; (3) use of published values of the sensitivity of growth plate activity to sustained compressive stress (mechanical modulation of growth); and (4) analyses of the geometrical changes in spinal shape as a result of mechanically modulated vertebral growth and simulations of the evolution of the scoliosis deformity.
Compressive stress distribution acting on vertebrae
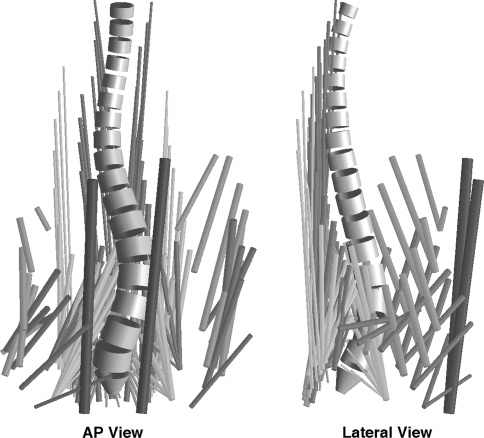
The spinal loading asymmetry in a lumbar spine with different magnitudes of scoliosis deformity was obtained from values reported for a biomechanical model [21] that assumes a physiologically plausible muscle activation strategy. These data were used because they were specific to a spine with scoliosis. The spinal shape represented varying scoliosis magnitude (Cobb angle from 0° to 51°), differing external loading directions (efforts) at two different magnitudes of effort, and different neuromuscular activation strategies were investigated. The model represented a spine having rigid vertebrae (L1 through L5) along with rigid bodies representing the thorax and the sacrum. There were flexible articulations between adjacent rigid elements. The lines of action and cross sectional area (hence maximum forces) of 180 muscles that cross the lumbar spine were obtained from published data [21, 24] (Fig. 2). Because the number of spinal muscles exceeds the number of degrees of freedom that they must control, estimation of the forces acting on a spine requires assumptions about the muscle activation strategy. In the published analyses, a cost function (the sum of cubed muscle stresses) was minimized to resolve the indeterminacy associated with the number of muscles crossing the spine exceeding the number of unknown intervertebral forces. The cubed-stress muscle cost function was used since it represents an activation strategy that minimizes muscular energy consumption and provides a close match to empirical EMG data [6, 26]. In these analyses, each muscle force was constrained to lie between zero and the physiological maximum, and limits were imposed on intervertebral motions. Each rigid body was in static equilibrium (force equilibrium constraint). The calculations were performed for positive and negative values of each force and moment (‘efforts’) applied at the top of the spine model (at T12) and for each of two magnitudes of effort. Since these forces and moments were applied at the top of the curve (T12), vertebral levels below T12 would experience both forces and moments. The loading directions (efforts) were for positive and negative values of generated forces and moments referred to each of the three principal global axis directions and for two different magnitudes of each effort. Subsequently, stress analysis for the loading direction attempted left axial rotation was omitted since the model predicted a large reduction in maximum effort for this direction [21].
Fig. 2.
Geometry (vertebrae and lines of action of muscles) for the model [21] used to calculate the forces (and symmetry of loading) at each of the lumbar vertebrae for differing curve magnitudes. The spinal geometry shown here represents the lumbar scoliosis of magnitude 38 degrees Cobb, apex at L1-2, obtained by averaging the 3-D stereo radiographic reconstructions of 15 patients with lumbar scoliosis. The muscles that cross the lumbar spine are shown as cylindrical structures. Each muscle has an attachment to a lumbar vertebra or to the thorax that is omitted for clarity
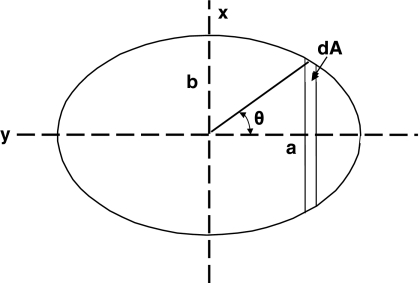
In the stress analyses, the vertebral transverse plane cross-section was assumed to have an elliptical shape, with major and minor radii a and b in the lateral and AP directions, respectively (Fig. 3). The level-specific values of a and b were obtained from Panjabi et al. [16]. The mean stress σm acting on each growth plate was σm = Fz/A, where A is the area of the growth plate πab and Fz was the axial force magnitude.
Fig. 3.
Geometry used in the stress analysis of a vertebra assumed to have an elliptical shape and subjected to a stress that varies linearly from one side to the other
The intervertebral lateral bending moment Mx was used to calculate the stress distribution across each growth plate by considerations of force equilibrium. The stress distribution was assumed to vary linearly from the convex to the concave side [10]:
 |
1 |
where Δσ = difference in stress between medial and lateral sides of the growth plate representing a linear gradient of stress from left to right (convex to concave side).
The moment Mx that acts on a vertebra as a consequence of stress asymmetry is equal to the integral of stress multiplied by area, multiplied by the distance y of the area increment from the center of the vertebral growth plate:
 |
2 |
It can be shown (Appendix 1) that Eqs. 1 and 2 provide the solution

This provides the means to calculate the stress distribution across the vertebral growth plates, given the model estimates of the forces and moments acting on each vertebra.
Vertebral and discal growth during the adolescent years
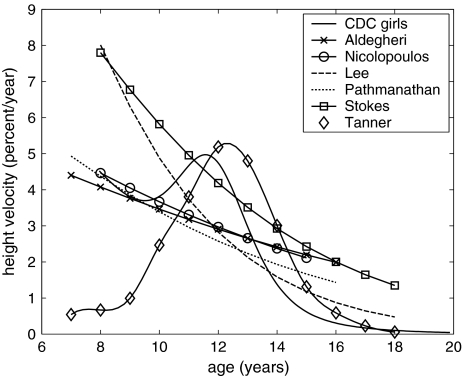
Available data on human adolescent growth of stature [4], sitting height [1, 7, 14, 17, 28], and spinal growth [27] were reviewed, and growth was expressed as percentage elongation per year (Fig. 4). Stokes and Windisch [27] reported that spinal growth occurs almost exclusively in the vertebrae (not in the discs) during adolescence, and so the present analysis considered that all growth occurred in the vertebrae, with remodeling only of the discs. The data of Stokes and Windisch [27] for vertebral growth were used in this analysis.
Fig. 4.
Data on human adolescent growth of stature [4], sitting height [1, 6, 14, 17, 28], and spinal growth [27]
Modulation of growth plate activity by sustained compressive stress
The modulation of growth in growth plates by sustained altered stress was obtained from a published report [23]. These data show the proportional alteration in growth rate of vertebral and proximal tibial growth plates of three different species (rat, rabbit, and calf), in response to differing magnitudes of stress. The relationship was apparently linear and a value of growth sensitivity (percent change per unit stress) was reported for both vertebrae and tibiae (1.5 and 1.86 per MPa, respectively). Therefore, the relationship between growth alteration and compressive stress acting on the growth plates was expressed as:
 |
where: G = actual growth; Gm = unmodified growth rate (uniform stress); σ = stress on growth plate; σm = mean prevailing stress on the growth plate. The reported value 1.5 MPa−1 for vertebral growth plates was used for the constant β [23].
Analytical simulation of the ‘vicious cycle’
The monthly growth of the spine over each year from age 11 to 16 years was simulated, assuming that the trunk was loaded in each of six pure forces or five pure moments in turn, applied at T12. The six forces were push forward, push left, push up, pull back, push right, and push down, and the five moments were right lateral bending, flexion, right axial rotation, left lateral bending, and extension. The left axial rotation effort was omitted since it had been associated with very low values of the calculated effort and minimal muscle activation for large (55°) scoliosis in the model that estimated spinal loading [21].
The initial spinal deformed shape was set to two different values (13° and 26° Cobb) by linear scaling of the geometry derived from stereo-radiographic studies (scale factor applied to the lateral direction only). The initial geometry was of 15 patients with a primary lumbar scoliosis, mean Cobb angle 38° (range 27°–43°) [21].
For each loading direction and magnitude, the vertebral growth in the concave and convex sides of each vertebra was calculated and this growth generated a new spinal geometry in the frontal plane. For each vertebra, the new shape was calculated as a quadrilateral whose sides on the convex and the concave sides of the scoliosis curve were defined by the annual growth increment. The new geometrical shape of the spine (after each growth increment) was calculated by starting at the lowest vertebra (L-5) and working upwards. The part of the spine above this level (including the discs, whose shape did not change in these analyses) was then translated and rotated according to the displacements of the upper endplate.
In the absence of information about how discal wedging responds to mechanical loading, this was not specifically modeled, but was assumed to increase in proportion to the vertebral wedging. The apical wedging of discs in 20 patients with thoraco-lumbar scoliosis has been reported as 14.6° of the Cobb angle compared to 13.0° for the vertebrae [22]. Therefore, the Cobb angles computed from disc wedging alone were increased in the proportion (14.6 + 13)/13 = 2.12 to account for this factor.
The spine was considered to be subjected to growth altering stresses for 16 of each 24 h. It was assumed that growth modulation is proportional to the duration of exposure to altered loading during each 24-h period since diurnal compression of rat growth plates [25] was observed to have half the growth suppression of full-time loading.
Results
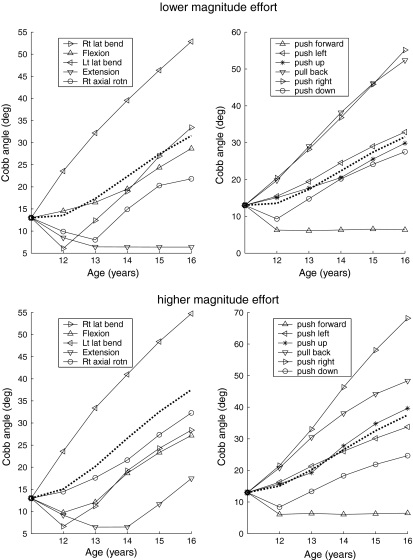
The simulations of mechanically modulated growth of the spine predicted curve progression for most loading conditions and initial geometries. These final lumbar spinal curve shapes were averaged over the eleven loading directions (efforts) (Fig. 5). At the lower magnitudes of effort (producing spinal compressive stress averaging 0.48 MPa at the curve apex), an initial curve of 13° Cobb at age 11 years progressed to a final curve magnitude of 34° Cobb at age 16. At the higher magnitudes of effort (producing spinal compressive stress averaging 0.81 MPa at the curve apex), the final curve magnitude was 38° Cobb.
Fig. 5.
Simulated progression of lumbar scoliosis (quantified by Cobb angle), plotted against age for a spine loaded by each of 11 different effort types. Upper panels: the effort magnitude at the lower effort magnitudes; lower panels: the higher effort magnitudes. Left panels: for each of five pure moment efforts generated about the thorax; Right panels: for each of six pure force efforts generated at T-12. In each case, the dotted line shows the average of the 11 solid lines
The average stress values were obtained from calculated spinal loading that averaged 442 N at the level T12-L1 and 627 N at the L5-S1 level for the lower effort magnitudes (742 and 1,084 N at higher effort magnitudes). Dividing by the corresponding vertebral endplate areas gave average compressive stress in the range 0.42–0.57 MPa (lower effort magnitude) and 0.7–1.0 MPa (higher effort magnitude).
In these analytical simulations, differing external effort directions caused differing amounts of curve progression, and some produced lessening of the curve. At the lower magnitude of effort, all but 2 of 11 loading directions (the push forward and extension efforts) generated forces incompatible with curve progression, but at the higher effort magnitude only the push forward effort did not cause curve progression (Fig. 5). If the initial curve was 26° Cobb, then the final averaged curve was 46° for lower effort magnitude and 56° for higher effort magnitude.
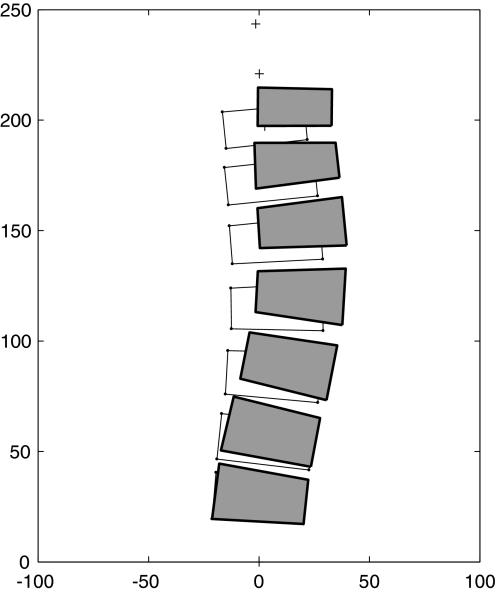
The calculated offset of the load acting on the growth plates was toward the concavity of the curve at the apex and toward the convexity at the limits of the curve. Therefore, the pattern of the resulting asymmetrical growth produced a reciprocal pattern of vertebral wedging when the final geometry averaged over the eleven effort directions was calculated (Fig. 6), compatible with maintaining the shape of the scoliosis curvature.
Fig. 6.
Simulated evolution of the lumbar scoliosis as a result of mechanically modulated asymmetrical growth. The initial geometry (unfilled shapes) is the starting geometry at age 11 (13° Cobb lumbar scoliosis). The final geometry (filled shapes) is averaged from the predicted final shapes for all 11 analyzed loading directions at age 16, for the higher magnitude of effort loading conditions. Axis units are mm
Discussion
These analytical simulations supported the ‘vicious cycle’ theory of scoliosis progression that proposes that scoliosis causes asymmetrical spinal loading and consequentially asymmetrical spinal growth. In these simulations, a lumbar scoliosis curve was predicted to increase from 13° to 32° Cobb during adolescent growth occurring from age 11 to age 16 years, assuming a sustained average level of muscular activity and spinal loading corresponding to the lower effort magnitudes (Fig. 5). This was an average value, assuming equal time spent with each loading direction—for certain loading directions the curve progression was greater (Fig. 5). For the higher magnitudes of sustained effort, the final curve magnitude averaged 38° Cobb (i.e., the analytically predicted curve evolution was comparable to observed natural history). Also, if the initial curve was greater, then the simulations predicted larger final curve magnitudes, as expected.
The present study was motivated by the need to understand the mechanism of progression of scoliosis during growth rather than its etiology. It was assumed that biomechanical modulation of growth predominates during adolescent growth as a cause of curve progression relative to the initiating causes of the scoliosis. There is evidence to support this contention, notably the similar pattern of curve progression during growth in scoliosis resulting from different causes (congenital, neuromuscular, and idiopathic).
The calculated loading asymmetry produced increased loading of the concave side near the curve apex and of the convex side at the limits of the curve, thereby causing a wedging pattern that was consistent with a progressive scoliosis. The analysis considered deformity in the coronal plane only. The axial rotation that is associated with scoliosis may also be produced by abnormal forces acting on the vertebral growth plates. However, there is no quantitative information available on the growth plates’ response to torsional (shear) forces.
The exact level of habitual spinal loading is not known, and it varies between individuals based on activity levels and other factors. In these simulations, the compressive loads acting on the endplates were calculated to be between 500 and 800 N for the simulations of lower effort magnitudes, and about 50% greater again at the higher effort magnitudes. The corresponding stresses acting on the growth plates were in the range 0.8–0.9 MPa. These values are compatible with estimates of spinal loading derived from intradiscal pressure measurements [2, 12, 31] during non-demanding workplace situations. According to Nachemson [12], the discs are loaded by stresses varying from about 0.5 MPa (lying) to 6 MPa (extension effort in seated position). Andersson [2] reported spinal loads of 300–500 N for office work, corresponding to stresses in the range 0.3–0.5 MPa. Wilke [31] reported stresses in the range 0.3 MPa (relaxed sitting) to 2.3 MPa (lifting 20 kg).
The concave to convex differences in compressive stress associated with the scoliosis curvature were on the order of ±10% of the average stress, i.e., about 0.1 MPa. This was the magnitude of sustained stress used in the animal studies from which the value for growth sensitivity to stress was obtained, indicating that the animal study data were in the appropriate range for use in the analytical simulations of the human spinal growth response to altered loading. In the animal studies, the growth rate varied from 30 μm/day for rat vertebrae to 366 μm/day for rabbit proximal tibia and the growth sensitivity to stress was slightly less in the vertebrae. The growth rate of 2–8% per year in the simulations of the human adolescent corresponds to about 6–32 mm per year or up to 3 μm per day per spinal growth plate. While the analyses included effects of sustained loading on growth, it was assumed that endochondral growth is insensitive to rapid fluctuations in loading since this would imply different growth and stature depending on activity levels of the individual.
An adjustment was made in the analyses to compensate for diurnal variations in spinal loading and for the wedging of the intervertebral discs. These are also factors that are not well defined, and probably vary substantially between individuals. It has been suggested that intervertebral discs degenerate and lose height in a scoliosis curve because of impaired transport of metabolites through the endplate [29]. It has been shown that the discs develop asymmetrical structure with nucleus migration in a scoliosis deformity [18], and the posterior elements become asymmetrical. Thus, the causes of disc wedging are evidently very different from the mechanisms modulating growth plate activity that were directly considered in the present studies.
For any individual, there is generally a more distinct peak of growth rate than is evident in growth averaged for individuals of the same age, since the peak occurs at different chronological age. Correction for this factor in the data of Tanner et al. [28] and from the CDC [4] is evident in Fig. 4. The simulations in this study suggest that differing timing of the growth spurt could influence the progression of a scoliosis curve. The analyses were of a lumbar scoliosis only since the biomechanics of the thoracic region is complicated by unknown rib cage interactions. Bodyweight was not specifically included in the analyses, but its action on the lumbar spine was implicitly included in the forces and moments that were analyzed.
The findings from the calculations of muscle forces [21] suggest that individuals with scoliosis can adopt different muscle activation strategies and that these strategies may determine whether or not the spinal loading causes scoliosis progression during growth. It is also theoretically possible to activate muscles to equalize or reverse the forces tending to make the deformity progress, as previously suggested by Wynarsky and Schultz [32]. However, it was found [21] that the muscle activation patterns required to generate a spinal loading pattern that prevents or reverses curve progression during growth have greater physiological cost, implying that patients would be less likely to adopt these strategies. The analyses did not consider any adaptive changes in muscle strength or any acquired asymmetrical structural behavior of the motion segments. Muscle function [15] and fiber-type [9] are found to be altered in idiopathic scoliosis, but the exact effects of these changes on force generation are not known.
The rationale for many approaches to conservative management of scoliosis during skeletal growth assumes a biomechanical mode of deformity progression (Hueter-Volkmann principle). The present studies provide a quantitative basis for this previously qualitative hypothesis. The magnitude of skeletal loading and of growth sensitivity to load were considered to be physiologically correct as they were the ‘best estimates’ available from the literature. With these values, it was predicted that a substantial component of the scoliosis progression that occurs during growth is biomechanically mediated, subsequent to the curve reaching a magnitude at which the loading asymmetry is of sufficient magnitude to cause asymmetrical loading and to modulate vertebral growth. This analysis assumed that there was an initial curvature of the spine, producing asymmetrical loading, but that all other aspects of the spine and its neuromuscular control were unaltered by the scoliosis condition.
The findings of this study might be translated into clinical practice by the design of better braces, muscle and postural ‘re-education’ programs, or selective (unilateral) growth arrest or acceleration. Also, they may help to identify individual spinal shapes and muscle activation patterns that predispose to scoliosis progression. This would address the challenge of accurate and early identification of patients at risk for progressive scoliosis curves who might then benefit from early therapeutic intervention. Improved treatments of scoliosis require early interventions that are less destructive than multi-level spinal arthrodesis, and so the ability to improve prognosis of progressive curves is key to their introduction to avoid treating non-progressive curves.
Acknowledgments
Supported by NIH R01 AR 44119 and NIH R01 AR 46543.
Appendix 1
In Eq. 2:
 |
(See Fig. 3)
Substituting in Eq. 2:
 |
Evaluating this definite integral:
 |
3 |
References
- 1.Aldegheri R, Agostini S. A chart of anthropometric values. J Bone Joint Surg Br. 1993;75(1):86–88. doi: 10.1302/0301-620X.75B1.8421044. [DOI] [PubMed] [Google Scholar]
- 2.Andersson GBJ, Chaffin DB, Pope MH. Occupational biomechanics of the lumbar spine. In: Pope MH, Frymoyer JW, Andersson G, editors. Occupational low back pain. New York: Praeger Scientific; 1984. p. 45. [Google Scholar]
- 3.Cassella MC, Hall JE. Current treatment approaches in the nonoperative and operative management of adolescent idiopathic scoliosis. Phys Ther. 1991;71:897–909. doi: 10.1093/ptj/71.12.897. [DOI] [PubMed] [Google Scholar]
- 4.CDC Growth Charts: United States. STATAGE.XLS: Stature-for-age charts, 2 to 20 years. http://www.cdc.gov/nchs/about/major/nhanes/growthcharts/datafiles.htm. Accessed 12 Apr 2007
- 5.Dickson RA, Deacon P. Annotation: spinal growth. J Bone Joint Surg Br. 1987;69:690–692. doi: 10.1302/0301-620X.69B5.3680325. [DOI] [PubMed] [Google Scholar]
- 6.Hughes RE, Chaffin DB, Lavender SA, Andersson GB. Evaluation of muscle force prediction models of the lumbar trunk using surface electromyography. J Orthop Res. 1994;12(5):689–698. doi: 10.1002/jor.1100120512. [DOI] [PubMed] [Google Scholar]
- 7.Lee TS, Chao T, Tang RB, Hsieh CC, Chen SJ, Ho LT. A longitudinal study of growth patterns in schoolchildren in one Taipei District II: sitting height, arm span, body mass index and skinfold thickness. J Chin Med Assoc. 2005;68(1):16–20. doi: 10.1016/S1726-4901(09)70126-1. [DOI] [PubMed] [Google Scholar]
- 8.Little DG, Song KM, Katz D, Herring JA. Relationship of peak height velocity to other maturity indicators in idiopathic scoliosis in girls. J Bone Joint Surg Am. 2000;82(5):685–693. doi: 10.2106/00004623-200005000-00009. [DOI] [PubMed] [Google Scholar]
- 9.Mannion AF, Meier M, Grob D, Muntener M. Paraspinal muscle fibre type alterations associated with scoliosis: an old problem revisited with new evidence. Eur Spine J. 1998;7(4):289–293. doi: 10.1007/s005860050077. [DOI] [PMC free article] [PubMed] [Google Scholar]
- 10.McNally DS, Adams MA. Internal intervertebral disc mechanics as revealed by stress profilometry. Spine. 1992;17(1):66–73. doi: 10.1097/00007632-199201000-00011. [DOI] [PubMed] [Google Scholar]
- 11.Mente PL, Aronsson DD, Stokes IAF, Iatridis JC. Mechanical modulation of growth for the correction of vertebral wedge deformities. J Orthop. 1999;Res17:518–524. doi: 10.1002/jor.1100170409. [DOI] [PubMed] [Google Scholar]
- 12.Nachemson A. The load on lumbar disks in different positions of the body. Clin Orthop Relat Res. 1966;45:107–122. doi: 10.1097/00003086-196600450-00014. [DOI] [PubMed] [Google Scholar]
- 13.Nachemson AL, Peterson LE. Effectiveness of treatment with a brace in girls who have adolescent idiopathic scoliosis. A prospective, controlled study based on data from the Brace Study of the Scoliosis Research Society. J Bone Joint Surg Am. 1995;77(6):815–822. doi: 10.2106/00004623-199506000-00001. [DOI] [PubMed] [Google Scholar]
- 14.Nicolopoulos KS, Burwell RG, Webb JK. Stature and its components in healthy children, sexual dimorphism and age related changes. J Anat. 1985;141:105–114. [PMC free article] [PubMed] [Google Scholar]
- 15.Odermatt D, Mathieu PA, Beausejour M, Labelle H, Aubin CE. Electromyography of scoliotic patients treated with a brace. J Orthop Res. 2003;21(5):931–936. doi: 10.1016/S0736-0266(03)00038-X. [DOI] [PubMed] [Google Scholar]
- 16.Panjabi MM, Takata K, Goel V, Federico D, Oxland T, Duranceau J, Krag M. Thoracic human vertebrae. Quantitative three-dimensional anatomy. Spine. 1991;16(8):888–901. doi: 10.1097/00007632-199108000-00006. [DOI] [PubMed] [Google Scholar]
- 17.Pathmanathan G, Prakash S. Growth of sitting height, subischial leg length and weight in well-off northwestern Indian children. Ann Hum Biol. 1994;21(4):325–334. doi: 10.1080/03014469400003332. [DOI] [PubMed] [Google Scholar]
- 18.Perié D, Sales Gauzy J, Curnier D, Hobatho MC. Intervertebral disc modeling using a MRI method: migration of the nucleus zone within scoliotic intervertebral discs. Magn Reson Imaging. 2001;19(9):1245–1248. doi: 10.1016/S0730-725X(01)00452-0. [DOI] [PubMed] [Google Scholar]
- 19.Roaf R. Vertebral growth and its mechanical control. J Bone Joint Surg Br. 1960;42:40–59. doi: 10.1302/0301-620X.42B1.40. [DOI] [PubMed] [Google Scholar]
- 20.Stokes IAF, Spence H, Aronsson DD, Kilmer N. Mechanical modulation of vertebral body growth: implications for scoliosis progression. Spine. 1996;21(10):1162–1167. doi: 10.1097/00007632-199605150-00007. [DOI] [PubMed] [Google Scholar]
- 21.Stokes IAF, Gardner-Morse M. Muscle activation strategies and symmetry of spinal loading in the lumbar spine with scoliosis. Spine. 2004;29(19):2103–2107. doi: 10.1097/01.brs.0000141182.42544.1f. [DOI] [PubMed] [Google Scholar]
- 22.Stokes IAF, Aronsson DD. Disc and vertebral wedging in patients with progressive scoliosis. J Spinal Dis. 2001;14:317–322. doi: 10.1097/00002517-200108000-00006. [DOI] [PubMed] [Google Scholar]
- 23.Stokes IA, Aronsson DD, Dimock AN, Cortright V, Beck S. Endochondral growth in growth plates of three species at two anatomical locations modulated by mechanical compression and tension. J Orthop Res. 2006;24(6):1327–1334. doi: 10.1002/jor.20189. [DOI] [PMC free article] [PubMed] [Google Scholar]
- 24.Stokes IAF, Gardner-Morse M. Quantitative anatomy of the lumbar musculature. J Biomech. 1999;32:311–316. doi: 10.1016/S0021-9290(98)00164-X. [DOI] [PubMed] [Google Scholar]
- 25.Stokes IA, Gwadera J, Dimock A, Farnum CE, Aronsson DD. Modulation of vertebral and tibial growth by compression loading: diurnal versus full-time loading. J Orthop Res. 2005;23:188–195. doi: 10.1016/j.orthres.2004.06.012. [DOI] [PubMed] [Google Scholar]
- 26.Stokes IA, Gardner-Morse M. Lumbar spinal muscle activation synergies predicted by multi-criteria cost function. J Biomech. 2001;34:733–740. doi: 10.1016/S0021-9290(01)00034-3. [DOI] [PubMed] [Google Scholar]
- 27.Stokes IAF, Windisch L. Vertebral height growth predominates over intervertebral disc height growth in the adolescent spine. Spine. 2006;31(14):1600–1604. doi: 10.1097/01.brs.0000222008.15750.1f. [DOI] [PMC free article] [PubMed] [Google Scholar]
- 28.Tanner JM, Whitehouse RH, Marubini E, Resele LF. The adolescent growth spurt of boys and girls of the Harpenden growth study. Ann Hum Biol. 1976;3(2):109–126. doi: 10.1080/03014467600001231. [DOI] [PubMed] [Google Scholar]
- 29.Urban MR, Fairbank JCT, Etherington PJ, Loh L, Winlove CP, Urban JPG. Electrochemical measurement of transport into scoliotic intervertebral discs in vivo using nitrous oxide as a tracer. Spine. 2001;26(8):984–990. doi: 10.1097/00007632-200104150-00028. [DOI] [PubMed] [Google Scholar]
- 30.Villemure I, Aubin CE, Dansereau J, Labelle H. Biomechanical simulations of the spine deformation process in adolescent idiopathic scoliosis from different pathogenesis hypotheses. Eur Spine J. 2004;13(1):83–90. doi: 10.1007/s00586-003-0565-4. [DOI] [PMC free article] [PubMed] [Google Scholar]
- 31.Wilke HJ, Neef P, Caimi M, et al. New in vivo measurements of pressures in the intervertebral disc in daily life. Spine. 1999;24(8):755–762. doi: 10.1097/00007632-199904150-00005. [DOI] [PubMed] [Google Scholar]
- 32.Wynarsky GT, Schultz AB. Optimization of skeletal configuration: studies of scoliosis correction biomechanics. J Biomech. 1991;24(8):721–732. doi: 10.1016/0021-9290(91)90336-L. [DOI] [PubMed] [Google Scholar]


