Abstract
Extensive anatomical differences suggest that cervical and lumbar discs may have functional differences also. We investigated human cervical discs using “stress profilometry”. Forty-six cadaveric cervical motion segments aged 48-90 years were subjected to a compressive load of 200 N for 20 s, while compressive ‘stress’ was recorded along the posterior-anterior midline of the disc using a pressure transducer, side-mounted in a 0.9 mm diameter needle. Stress profiles were repeated with the transducer orientated horizontally and vertically, and with the specimen in neutral, flexed and extended postures. Profiles were repeated again following creep loading (150 N, 2 h) which simulated diurnal water loss in vivo. Stress profiles were reproducible, and measured “stress” at each location was proportional to applied load. Stress profiles usually showed a hydrostatic nucleus with regions of higher compressive stress concentrated anteriorly in flexion, and posteriorly in extension. Stress concentrations increased in degenerated discs and following creep. Some features were unique to cervical discs: many showed a stress gradient across their central regions, even though vertical and horizontal stresses were equal to each other, and stress concentrations in the posterior annulus were generally small. Central regions of many cervical discs show the characteristics of a “tethered fluid” which can equalise stress over small distances, but not large. This may be attributable to their fibrous texture. The small radial diameter of the cervical posterior annulus may facilitate buckling and thereby prevent it from sustaining high compressive stresses.
Keywords: Intervertebral disc, Cervical, Mechanics, Degeneration
Introduction
Cervical and lumbar intervertebral discs both allow considerable spinal mobility, and both are commonly the underlying causes of pain and nerve root entrapment syndromes. In the case of lumbar discs, great efforts have been made to understand how mechanical and biological factors combine to create pathology and pain [10, 27]. This understanding has been aided by ‘stress profilometry’, in which a miniature pressure transducer is pulled through a loaded cadaveric disc in order to measure the distribution of compressive loading along its antero-posterior diameter [21]. This technique has shown how the internal mechanical environment of lumbar discs varies with age and degeneration [9], how this can predispose some discs to prolapse [22], and how damage to the annulus or endplate can lead to disc decompression [32], internal disruption [4, 32], and back pain [23]. It is sometimes assumed that this information applies to cervical discs also.
However, there are reasons to suspect that results should not be extrapolated from lumbar to cervical discs. Mercer and Bogduk [24, 25] showed that human cervical discs have a fibrous nucleus pulposus surrounded by a non-concentric annulus fibrosus which does not cover the disc’s postero-lateral aspect, and which is very thin posteriorly. Furthermore, the endplates of most cervical vertebrae are curved in the sagittal plane, and the lateral aspects of the discs are supported by the oblique surfaces of the uncovertebral joints.
There have been few attempts to investigate how these anatomical differences might lead to functional differences. Pospiech et al. showed that pressure in the centre of cadaveric cervical discs increases when the motion segment is subjected to bending or torsion [31] and Cripton et al. showed that pressure in the cervical disc nucleus increases in proportion to applied load [13]. Wigfield et al. [35] found that internal stress distributions in cervical discs depend on posture, and demonstrated some differences from lumbar discs, although the multisegment specimens tested made it difficult to control the precise loading on any particular disc.
In the present experiment we use a modified stress profilometry technique to investigate systematically the internal mechanical functioning of cadaveric cervical intervertebral discs. Among the questions we aimed to answer are: does the cervical nucleus pulposus exhibit true hydrostatic properties, and if so, over how extensive a region? Is the cervical posterior annulus substantial enough to sustain high compressive stresses without buckling?
Materials and methods
Cadaveric material
Twenty five human cervical spines aged 48–90 years were collected within 72 h of death, and stored in sealed plastic bags at −20°C. Subsequently, spines were defrosted and dissected into 46 “motion segments” (two vertebrae and the intervening disc and ligaments). All spinal levels between C2–3 and C7-T1 were represented. Lateral radiographs were taken, and intervertebral disc height measured. Selection of 46 motion segments from 25 cervical spines aimed to avoid extremely narrowed discs, bridging osteophytes, and fractured vertebrae. Death and freeze-thawing have only minor effects on the materials properties of cadaveric spines [1, 2].
Mechanical testing
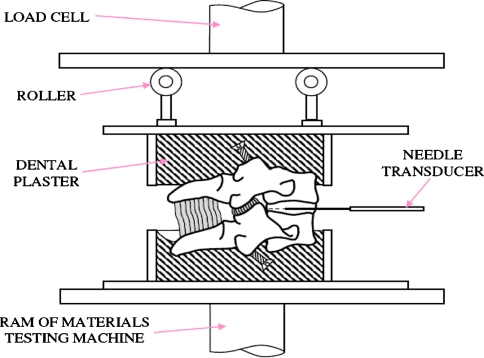
Specimens were mounted in aluminium cups containing dental plaster. Forces were applied via two low-friction rollers (Fig. 1) which allowed compression to be applied without prohibiting small horizontal settling movements. Roller height could be adjusted to hold the specimen at some constant angle of flexion or extension, while a compressive force was applied by a computer-controlled hydraulic materials testing machine (Zwick-Roell, Leominster, UK). Advantages of using motion segments [36] and this apparatus [33] have been considered previously. All specimens were subjected to a preliminary period of creep loading (20 N for 15 min) to expel water from the disc and minimize the effects of post-mortem swelling [19].
Fig. 1.
Apparatus used to compress cervical motion segments. The heights of the rollers could be adjusted so that the specimen was compressed while positioned in pre-determined angles of flexion or extension. The pressure transducer, side-mounted in a 0.9 mm-diameter needle, was pulled through the mid-sagittal diameter of the loaded disc
Stress profilometry
The distribution of compressive stress inside the disc was examined by pulling a miniature pressure transducer, 1.5 mm long and side-mounted in a 0.9 mm-diameter needle, along the sagittal midline diameter of the disc. The transducer was similar to those used in 1.3 mm-diameter needles to investigate thoracolumbar discs [9], and which have been shown to have an output approximately equal to the average compressive stress acting perpendicular to the transducer membrane [20]. Initially, a channel was made at mid-disc height, using a sharp 0.9 mm-diameter needle. This enabled the transducer needle to be pushed through the disc until the transducer emerged from the opposite (posterior) side. In some early tests, another radiograph was taken in the sagital plane at this point to check on needle height, but this was later considered unnecessary. A compressive force of 200 N was then applied to represent the combined effects of head weight, and muscle tension [15]. During the loading period of 20 s, the transducer was pulled back through the disc. A new channel was made in the disc if the profiles showed signs of bending of the needle, revealed by differences between successive profiles made with the needle pointing up and down. Bending could also be minimized by adjusting the height of the clamp that gripped the base of the transducer needle.
Stress profiles were repeated with the transducer orientated horizontally and then vertically, using the same channel. Profiles were also repeated with the specimens positioned to simulate three specific postures: neutral, 2–5° flexion, and 2–5° extension. Angles of flexion and extension were chosen to represent a range of common neck/head postures rather than the full physiological range, and they were varied to suit the mobility of each specimen. Each pair of horizontal and vertical stress profiles was analysed digitally, and the “functional nucleus” identified as that central region in which the horizontal and vertical “stresses” differed by less than 5% from each other, and varied linearly (or not at all) with distance. If a small non-hydrostatic region appeared within an extensive hydrostatic region, it was all considered to be “nucleus”. Adjacent regions were designated as posterior and anterior annulus. The width of each region was expressed as a percentage of the disc’s antero-posterior diameter, and the pressure in the nucleus was averaged from vertical and horizontal profiles. The maximum vertically acting compressive stress was calculated in the anterior and posterior annulus.
Creep loading
After stress profilometry, specimens were subjected to sustained “creep” compressive loading for 2 h to expel water from the disc. The creep compressive force was 150 N to minimize the risk of damage. Although the amount of height lost by cervical discs in-vivo is unknown, this creep loading regime was a reasonable if conservative way of simulating diurnal changes in life. In the lumbar spine, discs lose and regain approximately 20% of their water every day [11], with most of the loss taking place during the first hour of the morning [14]. This can be simulated in vitro by 3–6 h creep loading at 1,500 N [19].
Validation experiments
In eight discs, stress profiles were repeated five times, at two-minute intervals, with the compressive load increasing in steps from 50 to 250 N. It has been shown previously that stresses measured at each location in a lumbar disc increase in direct proportion to the applied compressive load [30], but this important result may not apply to the thinner cervical discs if the presence of the inserted needle creates a large artifact. Some “stress” profiles were repeated immediately, at the same applied load, to check if they were reproducible, and to check for signs of bending (see above). Validation tests were performed before and after creep loading.
Morphology
After testing, each motion segment was dissected and disc morphology assessed. Grade of disc degeneration was assigned on a scale of 1 (non-degenerated) to 4 (severely degenerated) as described previously for lumbar discs [3]. The fifth point on this scale (fissured) was not used because it required fluid to be injected into the intact disc for positive identification. Inspection of the radiographs showed that these four grades are equivalent to grades 0–3 on the scale proposed for radiographic assessment of cervical discs [18]. Disc area was estimated from the antero-posterior and lateral diameters of the lower endplate of the upper vertebra in each motion segment, using the formula for the area of an ellispse (π × a × b/4) where the diameters a and b were measured from radiographs.
Statistics
Age-dependence was examined using linear regression. Interacting influences on features of the stress profiles (such as nucleus pressure, and width) were assessed using mixed ANOVA’s, with posture and creep as within-subject factors, and disc degeneration and spinal level as between-subject factors.
Results
Typical stress distributions in cervical discs
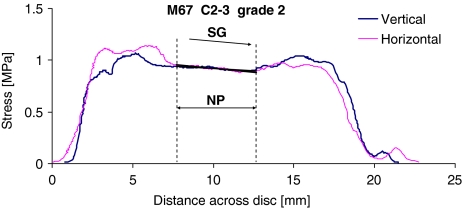
These showed a central region in which the horizontal and vertical compressive “stresses” differed by less than 5% from each other, and regions corresponding to the anterior and posterior annulus in which they differed from each other, and changed markedly with location (Fig. 2). One feature seen in many cervical discs was a region of nucleus in which both horizontal and vertical stresses were approximately equal to each other, and yet increased or decreased linearly with distance (Fig. 2). This “stress gradient” (SG) was measured.
Fig. 2.
Stress profiles obtained from the mid-sagittal diameter of a C2–3 grade 2 disc (posterior on left). Measurements were repeated with the transducer orientated vertically and horizontally. In the functional nucleus pulposus (NP) these two components were equal, suggesting hydrostatic fluid conditions, and yet a distinct stress gradient (SG) was apparent. Stress concentrations can be seen in disc regions corresponding to the posterior and anterior annulus
Before creep loading, and in the neutral posture, all grade 1 and 2 discs showed evidence of a hydrostatic nucleus. The average width of the nucleus, anterior annulus and posterior annulus for the 24 non-degenerated (grade 1 and 2) discs are shown in Table 1. On average the nucleus occupied 38% of the diameter, with the anterior and posterior annulus contributing 35 and 27%, respectively.
Table 1.
The width of the posterior annulus (PA) nucleus (N) and anterior annulus (AA) were expressed as a percentage of the full antero-posterior diameter of each disc. Mean values (STD) refer to the neutral posture before creep. Some spinal levels have been grouped, but only when results were similar for the two levels
| Spinal level (n) | Width of region (%) | Disc width (mm) | ||
|---|---|---|---|---|
| PA | N | AA | ||
| C2–3 (6) | 29 (7) | 38 (11) | 32 (4) | 19 (3) |
| C3–4/C4–5 (5) | 27 (3) | 37 (13) | 36 (12) | 20 (1) |
| C5–6/C6–7 (7) | 31 (6) | 34 (11) | 35 (9) | 20 (1) |
| C7-T1 (6) | 22 (6) | 42 (16) | 36 (10) | 19 (3) |
| All discs (24) | 27 (7) | 38 (12) | 35 (9) | 20 (2) |
Validation experiments
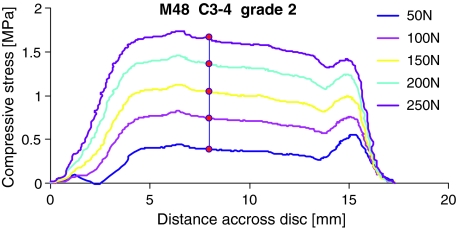
When pressure profiles were obtained at different compressive forces, they showed the same features (Fig. 3). Pressure in the nucleus was proportional to applied load: averaged results for eight discs showed that linearity was excellent (r2 = 0.999, P < 0.001) and that nucleus pressure was 0.18 MPa when the disc was compressed only by the weight of the upper cup. Similar results were obtained when this validation test was performed before and after creep loading of each specimen. Stress profiles repeated immediately at the same load were reproducible (Fig. 4) indicating that repeated insertion of the transducer needle does not lead to progressive disruption of the tissue.
Fig. 3.
Profiles of vertical compressive stress recorded at a range of applied compressive forces (posterior on left). All profiles refer to the neutral posture, after creep loading. Black circles indicate the location at which nucleus pressure was sampled for comparison with applied load. The regression equation (measured pressure (MPa) = 0.0059 × applied force (N) + 0.18) indicated a nucleus pressure of 0.18 MPa at zero applied load for this specimen
Fig. 4.
Repeated profiles of vertical compressive stress showed good reproducibility
Influence of age and disc degeneration
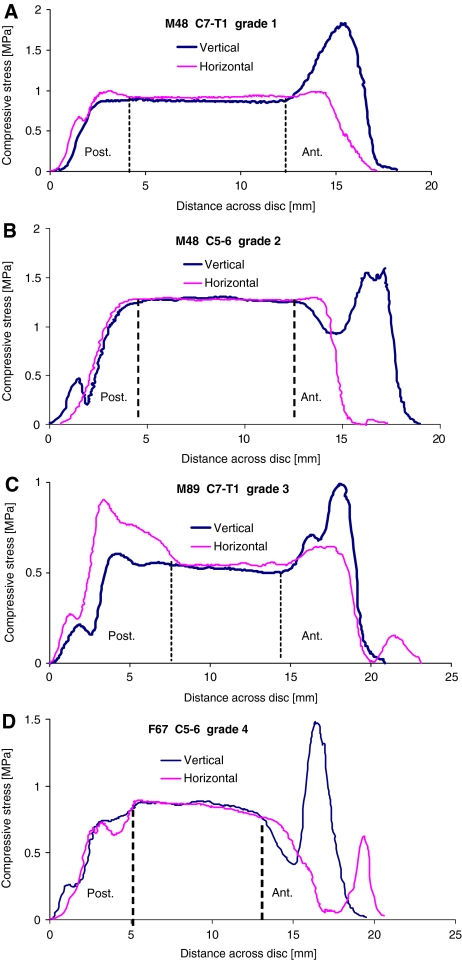
Considering all 46 discs, in the neutral posture before creep loading, the width of the hydrostatic region decreased with age (r2 = 0.21, P = 0.026), and the average pressure within it fell (r2 = 0.14, P = 0.01). The width of the anterior annulus showed a corresponding increase with age (r2 = 0.32, P = 0.004) but the width of the posterior annulus was unaffected. Disc degeneration and age were correlated (r = 0.60) with the former having more influence on annulus stresses. Typical stress profiles from grade 1 to 4 discs are shown in Fig. 5. In grade 1 discs, maximum stress in the posterior annulus was similar to nucleus pressure, although higher stresses occurred in the anterior annulus (Fig. 5a; Table 2). With increasing degeneration, the average width of the hydrostatic nucleus shrank, from 10.4 mm for grade 1 discs, to 5.9 mm for grade 3. Many grade 4 discs had no hydrostatic region and “width” results were unreliable. According to a mixed ANOVA, disc degeneration increased maximum stress in the posterior annulus (P = 0.035) and decreased pressure in the nucleus (P = 0.044), although in the most severely degenerated discs, measured stresses were low in all regions, suggesting that much of the applied loading was resisted by adjacent structures. Stress concentrations (relative to nucleus pressure) were rarely as high in the posterior annulus as in the anterior annulus (Table 2).
Fig. 5.
Typical stress profiles for all grades of disc degeneration (neutral posture, before creep). Increasing degeneration was generally associated with reduced nucleus pressure, and increased stress concentrations in the annulus, although spinal level also affected results
Table 2.
Summary of results for various groups of discs subjected to 200 N compression. Mean values are presented of pressure in the nucleus (N) and maximum (vertical) stress in the posterior (PA) and anterior annulus (AA). All units are MPa. Results refer to before creep conditions, except where stated otherwise. The standard deviation (STD) is included for some groups to indicate variability of results
| n | Neutral posture | Flexed posture | Extended posture | |||||||
|---|---|---|---|---|---|---|---|---|---|---|
| PA | N | AA | PA | N | AA | PA | N | AA | ||
| All -before creep | 46 | 1.27 | 1.09 | 1.50 | 1.41 | 1.34 | 1.95 | 1.67 | 1.10 | 1.37 |
| (STD) | 0.49 | 0.42 | 0.68 | 0.64 | 0.60 | 0.76 | 0.68 | 0.69 | 0.79 | |
| All -after creep | 45 | 1.11 | 0.91 | 1.26 | 1.13 | 1.05 | 1.85 | 1.18 | 0.69 | 1.03 |
| (STD) | 0.40 | 0.35 | 0.58 | 0.48 | 0.45 | 0.85 | 0.64 | 0.56 | 0.79 | |
| Degeneration 1 | 3 | 0.98 | 0.95 | 1.62 | 1.04 | 1.01 | 1.85 | 1.55 | 1.26 | 1.79 |
| Degeneration 2 | 22 | 1.32 | 1.19 | 1.64 | 1.50 | 1.43 | 2.09 | 1.87 | 1.38 | 1.66 |
| Degeneration 3 | 17 | 1.35 | 1.06 | 1.44 | 1.49 | 1.42 | 1.97 | 1.63 | 0.86 | 1.08 |
| Degeneration 4 | 4 | 0.87 | 0.72 | 0.89 | 0.91 | 0.86 | 1.15 | 0.80 | 0.29 | 0.46 |
| C2–3 | 11 | 1.80 | 1.56 | 1.79 | 2.07 | 1.96 | 2.30 | 2.27 | 1.75 | 1.83 |
| C3–4 | 2 | 1.13 | 0.96 | 0.91 | 1.15 | 1.05 | 1.40 | 0.95 | 0.88 | 0.93 |
| C4–5 | 9 | 1.18 | 1.01 | 1.14 | 1.22 | 1.14 | 1.42 | 1.58 | 0.94 | 1.03 |
| C5–6 | 4 | 1.24 | 1.10 | 1.41 | 1.33 | 1.32 | 1.50 | 1.54 | 0.96 | 1.14 |
| C6–7 | 7 | 1.14 | 0.94 | 1.72 | 1.08 | 1.04 | 1.92 | 1.51 | 0.91 | 1.52 |
| C7-T1 | 13 | 0.97 | 0.84 | 1.52 | 1.19 | 1.14 | 2.27 | 1.43 | 0.80 | 1.28 |
Influence of spinal level
Spinal level had little effect on the width of disc regions (Table 1) although there was a tendency for the nucleus to be particularly wide, and the posterior annulus narrow, at C7-T1. A distinct stress gradient across the posterior-anterior diameter of the nucleus (Fig. 2) was seen more often in upper cervical discs, especially grade 3 discs. Stress profiles from cervical levels C5-T1 showed more conventional hydrostatic behaviour in the nucleus: vertical and horizontal stress components were equal and did not vary with location (Fig. 5a, b). According to mixed ANOVA’s, spinal level influenced maximum stress in the posterior annulus (P = 0.023) and pressure in the nucleus (P = 0.041), as shown in Table 2. This influence is largely attributable to disc size because nucleus pressure (neutral posture, before creep) was inversely proportional to endplate area (r2 = 0.60, P < 0.001). Particularly high concentrations of compressive stress were seen in the anterior annulus at C6–7 and C7-T1 in all postures.
Influence of posture
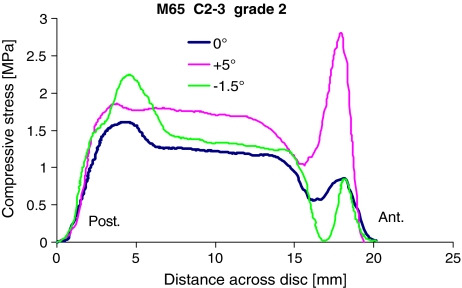
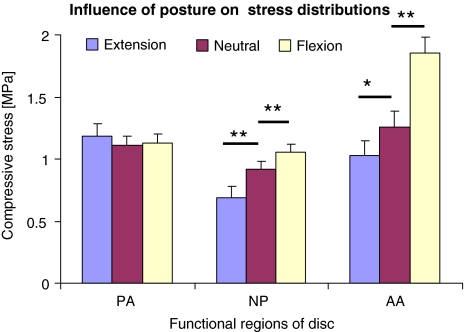
Repeated measures ANOVA’s involving all discs showed that posture affected maximum stress in all three regions of the disc (P < 0.001). However, when corrected for the influences of disc degeneration and spinal level in mixed ANOVA’s, posture influenced stresses only in the nucleus (P = 0.038) and anterior annulus (P < 0.001). Typical effects are shown in Fig. 6 and summarised in Fig. 7. Flexion increased maximum stresses in all regions of the disc, especially in the anterior annulus where the average increase was 30% (Table 2). Extension reduced stress in the anterior annulus, and increased it in the posterior annulus, although large stress peaks (relative to nucleus pressure) were rarely seen in the posterior annulus. In the nucleus of grade 3 discs loaded in extension, the average stress gradient was 0.050 MPa/mm, and values as high as 0.32 MPa/mm were observed. Postural effects tended to be greater in degenerated discs, and following creep loading (Table 2).
Fig. 6.
Flexed posture (+5°) concentrated stress anteriorly, and extended posture (−1.5°) concentrated it posteriorly. Data for a non-degenerated (grade 2) disc before creep loading
Fig. 7.
Average results, after creep loading, showing how posture affected pressure in the nucleus (NP), and maximum vertical compressive stress in the posterior annulus (PA) and anterior annulus (AA). Error bars indicate the SEM. Differences in the means (two-tailed t tests) are denoted: *P < 0.05, **P < 0.01 (n = 41)
Influence of creep loading
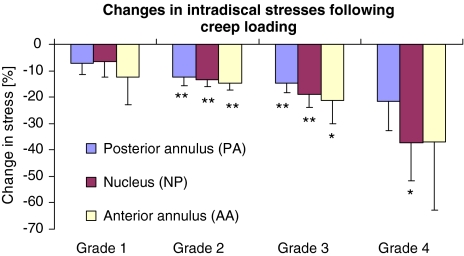
Creep reduced motion segment height by an average 0.50 mm (STD 0.13) which is equivalent to 10% loss of disc height. Graphs of creep height loss against time (not shown) did not approach equilibrium during the 2 h period, so greater creep may occur diurnally in life. Repeated measures ANOVA’s involving all discs showed that creep affected stress in all three regions of the disc (P < 0.001). However, when corrected for the influences of disc degeneration and spinal level in mixed ANOVA’s, creep influenced stresses only in the nucleus (P < 0.001) and posterior annulus (P = 0.003). Calculations based on average data in Table 2 show that creep reduced nucleus pressure by 17, 22 and 37% in the neutral, flexed and extended postures, respectively. Creep similarly reduced maximum stresses in the posterior annulus, by 13, 20 and 29%. Maximum stresses in the annulus (relative to nucleus pressure) tended to increase following creep. Creep exaggerated the effects of posture, and changes following creep were more pronounced in degenerated discs (Fig. 8).
Fig. 8.
Average results for the neutral posture showing how creep loading reduced maximum stresses in each region of the disc, presumably by transferring load-bearing to adjacent structures. The effect was greater in degenerated (grade 3 and 4) discs. Error bars indicate the SEM. Mean changes greater than zero (1-tailed t test) are denoted: *P < 0.05, **P < 0.001
Discussion
Summary of findings
Validation tests showed that stress profiles were reproducible and increased in proportion to applied load. They showed several similarities with lumbar discs: there was usually a hydrostatic nucleus, with regions of high compressive stress in the annulus which were concentrated anteriorly in flexion, and posteriorly in extension. Stresses were inversely proportional to disc size, and tended to be reduced in degenerated discs, and following creep. Other features were unique to cervical discs: several of them exhibited a stress gradient across their central regions, even though vertical and horizontal ‘stresses’ were equal to each other. Also, stress concentrations in the posterior annulus were generally much smaller than in the anterior annulus, especially at C6–7 and C7-T1.
Strengths and weaknesses of the study
The main strength of the study is that a substantial number of human cervical discs were examined, so that stress distributions could be characterised according to age, disc degeneration and spinal level. Furthermore, the large number of repeated tests on each specimen, coupled with demonstrated reproducibility of measurement (Fig. 4), made it possible to compare stress distributions in different postures, and before and after creep. The output of a pressure transducer which is calibrated in a fluid can not simply be equated with compressive stress, but validation studies have shown that transducer output within annulus fibrosus tissue is approximately equal to the average axial compressive stress acting perpendicular to the transducer membrane [20], even in degenerated discs [12] and in articular cartilage [5]. Evidently, low tissue rigidity allows tissue to deform into the recess of the needle and press on the transducer membrane without generating substantial restoring forces within the tissue. No spines younger than 48 years could be obtained, and this limited the age-dependency of results.
Relationship to other studies
Investigations of lumbar [9] and thoracic [29] discs have shown that they have a hydrostatic “functional nucleus” in which measured stresses do not vary with direction (transducer orientation) or location. Only when lumbar discs are severely degenerated is this hydrostatic region lost entirely [9, 26]. Similar properties were observed here in most cervical discs (Fig. 5). Exact comparisons between stresses and pressures in cervical and lumbar discs are not meaningful, because they depend on applied load relative to disc area, and area varies with spinal level. However, the general pattern of stress concentrations varying with age and degeneration, posture and creep (Table 2) are all similar to what has been reported for lumbar discs [6–9, 17, 21]. Nucleus pressure in cervical discs exhibited high linearity with applied load (Fig. 3), which is consistent with previous work on cervical [13] and lumbar [30, 34] discs. The unique features of cervical stress profiles reported here are consistent with trends shown in our preliminary study [35].
Explanation of results
Most results can be explained by mechanisms that have been demonstrated previously for the lumbar spine. Creep loading reduces the height of intervertebral discs, and transfers loading to the neural arch [16]. This reduces intradiscal stresses (Fig. 8) and in cervical discs the effect may be increased by load-bearing by the uncovertebral joints. Extension posture has a similar effect, whereas flexed postures increase intradiscal stresses by increasing tension in intervertebral ligaments [8]. Within the disc, stresses are concentrated in the anterior annulus in flexion, and in the posterior annulus in extension, because this is where the annulus compressive strain is greatest [28]. Effects are exaggerated in degenerated discs because their reduced height leads to greater vertical annulus strains for the same angular rotation of vertebrae.
Differences between stress distributions in cervical and lumbar discs are probably attributable to cervical discs having a more fibrous nucleus and thinner posterior annulus. The phenomenon of a stress gradient in the central region of a disc that otherwise behaves like a fluid (Fig. 2) can be explained in terms of the fibrous network of the cervical nucleus interacting with the hydrated proteoglycan gel. Small deformations of the matrix are little resisted by the soft proteoglycan gel, and the collagen fibres do not become stretched sufficiently to generate much tension within them. The matrix is therefore able to equalize stress over a small region, so the pressure transducer measures the same “stress” in that small region, and also when the transducer is orientated in different directions. However, larger deformations of the matrix cause the prominent fibres of the cervical nucleus to become straight, and then stretched, and tension in the collagen network then explains the observed stress gradient. In this way the fibrous nucleus of some cervical discs functions in the manner of a “tethered fluid” which resists large but not small deformations. The small radial diameter of the cervical posterior annulus probably explains the lack of high stress concentrations (relative to nucleus pressure) in this region of disc, even when the disc is loaded in extension. (Fig. 8) This relatively thin band of annulus may bulge or buckle radially rather than sustain high compressive stresses. Uncovertebral joints may also act to limit stress concentrations in the posterior annulus.
Conclusion
This first comprehensive investigation of stress distributions within cervical intervertebral discs suggests important functional differences with lumbar discs. In cervical discs, the nucleus is less able to equalise stress over large distances, and the posterior annulus does not sustain high compressive stresses.
Acknowledgments
This study was funded in the UK by the BBSRC. Patricia Dolan was a Research Fellow of the Arthritis Research Campaign. Conflict of interest statement: all authors have no conflict of interest.
Contributor Information
Daniel M. Skrzypiec, Email: skrzypiec@tu-harburg.de
Phillip Pollintine, Email: Phill.Pollintine@bris.ac.uk.
Andrzej Przybyla, Email: asp14@psu.edu.
Patricia Dolan, Email: Trish.Dolan@bris.ac.uk.
Michael A. Adams, Phone: +44-117-9288363, FAX: +44-117-9254794, Email: M.A.Adams@bris.ac.uk
References
- 1.Adams MA. Mechanical testing of the spine. An appraisal of methodology, results, and conclusions. Spine. 1995;20:2151–2156. doi: 10.1097/00007632-199510000-00015. [DOI] [PubMed] [Google Scholar]
- 2.Adams MA, Bogduk N, Burton K, Dolan P. The biomechanics of back pain. 2. Edinburgh: Churchill Livingstone; 2006. [Google Scholar]
- 3.Adams MA, Dolan Hutton P WC. The stages of disc degeneration as revealed by discograms, J Bone Joint Surg [Br] 1986;68:36–41. doi: 10.1302/0301-620X.68B1.3941139. [DOI] [PubMed] [Google Scholar]
- 4.Adams MA, Freeman BJ, Morrison HP, et al. Mechanical initiation of intervertebral disc degeneration. Spine. 2000;25:1625–1636. doi: 10.1097/00007632-200007010-00005. [DOI] [PubMed] [Google Scholar]
- 5.Adams MA, Kerin AJ, Bhatia LS, et al. Experimental determination of stress distributions in articular cartilage before and after sustained loading. Clin Biomech. 1999;14:88–96. doi: 10.1016/S0268-0033(98)00060-6. [DOI] [PubMed] [Google Scholar]
- 6.Adams MA, May S, Freeman BJ, et al. Effects of backward bending on lumbar intervertebral discs. Relevance to physical therapy treatments for low back pain. Spine. 2000;25:431–437. doi: 10.1097/00007632-200002150-00007. [DOI] [PubMed] [Google Scholar]
- 7.Adams MA, McMillan DW, Green TP, et al. Sustained loading generates stress concentrations in lumbar intervertebral discs. Spine. 1996;21:434–438. doi: 10.1097/00007632-199602150-00006. [DOI] [PubMed] [Google Scholar]
- 8.Adams MA, McNally DS, Chinn H, et al. Posture and the compressive strength of the lumbar spine. Clin Biomech. 1994;9(5):5–14. doi: 10.1016/0268-0033(94)90052-3. [DOI] [PubMed] [Google Scholar]
- 9.Adams MA, McNally DS, Dolan P. ‘Stress’ distributions inside intervertebral discs. The effects of age and degeneration. J Bone Joint Surg Br. 1996;78:965–972. doi: 10.1302/0301-620X78B6.1287. [DOI] [PubMed] [Google Scholar]
- 10.Adams MA, Roughley PJ. What is intervertebral disc degeneration, and what causes it? Spine. 2006;31:2151–2161. doi: 10.1097/01.brs.0000231761.73859.2c. [DOI] [PubMed] [Google Scholar]
- 11.Botsford DJ, Esses SI, Ogilvie-Harris DJ. In vivo diurnal variation in intervertebral disc volume and morphology. Spine. 1994;19:935–940. doi: 10.1097/00007632-199404150-00012. [DOI] [PubMed] [Google Scholar]
- 12.Chu JYY, Skrzypiec D, Pollintine P et al (2007) Can compressive stress be measured experimentallywithin the annulus fibrosus of degenerated intervertebral discs? Proc Inst Mech Eng [H] (in press) [DOI] [PubMed]
- 13.Cripton PA, Dumas GA, Nolte L. A minimally disruptive technique for measuring intervertebral disc pressure in vitro: application to the cervical spine. J Biomech. 2001;34:545–549. doi: 10.1016/S0021-9290(00)00205-0. [DOI] [PubMed] [Google Scholar]
- 14.Dolan P, Adams MA. Recent advances in lumbar spinal mechanics and their significance for modelling. Clin Biomech. 2001;16:S8–S16. doi: 10.1016/S0268-0033(00)00096-6. [DOI] [PubMed] [Google Scholar]
- 15.Dolan P, Earley M, Adams MA. Bending and compressive stresses acting on the lumbar spine during lifting activities. J Biomech. 1994;27:1237–1248. doi: 10.1016/0021-9290(94)90277-1. [DOI] [PubMed] [Google Scholar]
- 16.Dunlop RB, Adams MA, Hutton WC. Disc space narrowing and the lumbar facet joints. J Bone Joint Surg [Br] 1984;66:706–710. doi: 10.1302/0301-620X.66B5.6501365. [DOI] [PubMed] [Google Scholar]
- 17.Edwards WT, Ordway NR, Zheng Y, et al. Peak stresses observed in the posterior lateral anulus. Spine. 2001;26:1753–1759. doi: 10.1097/00007632-200108150-00005. [DOI] [PubMed] [Google Scholar]
- 18.Kettler A, Rohlmann F, Neidlinger-Wilke C et al (2006) Validity and interobserver agreement of a new radiographic grading system for intervertebral disc degeneration: part II. Cervical spine. Eur Spine J 15:732–41 [DOI] [PMC free article] [PubMed]
- 19.McMillan DW, Garbutt G, Adams MA. Effect of sustained loading on the water content of intervertebral discs: implications for disc metabolism. Ann Rheum Dis. 1996;55:880–887. doi: 10.1136/ard.55.12.880. [DOI] [PMC free article] [PubMed] [Google Scholar]
- 20.McMillan DW, McNally DS, Garbutt G, et al. Stress distributions inside intervertebral discs: the validity of experimental ‘stress profilometry’. Proc Inst Mech Eng [H] 1996;210:81–87. doi: 10.1243/PIME_PROC_1996_210_396_02. [DOI] [PubMed] [Google Scholar]
- 21.McNally DS, Adams MA. Internal intervertebral disc mechanics as revealed by stress profilometry. Spine. 1992;17:66–73. doi: 10.1097/00007632-199201000-00011. [DOI] [PubMed] [Google Scholar]
- 22.McNally DS, Adams MA, Goodship AE. Can intervertebral disc prolapse be predicted by disc mechanics? Spine. 1993;18:1525–1530. doi: 10.1097/00007632-199318110-00018. [DOI] [PubMed] [Google Scholar]
- 23.McNally DS, Shackleford IM, Goodship AE, et al. In vivo stress measurement can predict pain on discography. Spine. 1996;21:2580–2587. doi: 10.1097/00007632-199611150-00007. [DOI] [PubMed] [Google Scholar]
- 24.Mercer S, Bogduk N. The ligaments and anulus fibrosus of human adult cervical intervertebral discs. Spine. 1999;24:619–626. doi: 10.1097/00007632-199904010-00002. [DOI] [PubMed] [Google Scholar]
- 25.Mercer SR, Jull GA. Review: morphology of the cervical intervertebral disc: implications for McKenzie’s model of the disc derangement syndrome. Manual Therapy. 1996;2:76–81. doi: 10.1054/math.1996.0253. [DOI] [PubMed] [Google Scholar]
- 26.Nachemson A. In vivo discometry in lumbar discs with irregular nucleograms. Some differences in stress distribution between normal and moderately degenerated discs. Acta Orthop Scand. 1965;36:418–434. doi: 10.3109/17453676508988651. [DOI] [PubMed] [Google Scholar]
- 27.Olmarker K, Nutu M, Storkson R. Changes in spontaneous behavior in rats exposed to experimental disc herniation are blocked by selective TNF-alpha inhibition. Spine. 2003;28:1635–1641. doi: 10.1097/00007632-200308010-00002. [DOI] [PubMed] [Google Scholar]
- 28.Pearcy MJ, Tibrewal SB. Lumbar intervertebral disc and ligament deformations measured in vivo. Clin Orthop. 1984;191:281–286. [PubMed] [Google Scholar]
- 29.Polga DJ, Beaubien BP, Kallemeier PM, et al. Measurement of in vivo intradiscal pressure in healthy thoracic intervertebral discs. Spine. 2004;29:1320–1324. doi: 10.1097/01.BRS.0000127179.13271.78. [DOI] [PubMed] [Google Scholar]
- 30.Pollintine P, Przybyla AS, Dolan P, et al. Neural arch load-bearing in old and degenerated spines. J Biomech. 2004;37:197–204. doi: 10.1016/S0021-9290(03)00308-7. [DOI] [PubMed] [Google Scholar]
- 31.Pospiech J, Stolke D, Wilke HJ, et al. Intradiscal pressure recordings in the cervical spine. Neurosurgery. 1999;44:379–384. doi: 10.1097/00006123-199902000-00078. [DOI] [PubMed] [Google Scholar]
- 32.Przybyla A, Pollintine P, Bedzinski R, et al. Outer annulus tears have less effect than endplate fracture on stress distributions inside intervertebral discs: relevance to disc degeneration. Clin Biomech. 2006;21:1013–1019. doi: 10.1016/j.clinbiomech.2006.07.003. [DOI] [PubMed] [Google Scholar]
- 33.Przybyla A, Skrzypiec D, Pollintine P et al (2007) Strength of the cervical spine in compression and bending. Spine (in press) [DOI] [PubMed]
- 34.Ranu HS (1990) Measurement of pressures in the nucleus and within the annulus of the human spinal disc: due to extreme loading [published erratum appears in Proc Inst Mech Eng 1991;205(1):following 53], Proc Inst Mech Eng [H], 204:141–6 [DOI] [PubMed]
- 35.Wigfield CC, Skrzypiec D, Jackowski A, et al. Internal stress distribution in cervical intervertebral discs: the influence of an artificial cervical joint and simulated anterior interbody fusion. J Spinal Disord Tech. 2003;16:441–449. doi: 10.1097/00024720-200310000-00002. [DOI] [PubMed] [Google Scholar]
- 36.Zhao F, Pollintine P, Hole BD. Discogenic origins of spinal instability. Spine. 2005;30:2621–2630. doi: 10.1097/01.brs.0000188203.71182.c0. [DOI] [PubMed] [Google Scholar]


