Abstract
We have investigated the role of DNA methylation in the regulation of the expression of the human tissue transglutaminase gene. Studies on the methylation of the transglutaminase promoter in normal and neoplastic human cells demonstrated that the promoter is methylated in vivo and hypomethylation of the promoter is correlated with constitutive gene expression. Demethylation of the promoter in vivo by treatment of the cells with 5-azacytidine increased transglutaminase expression and hypermethylation of the promoter in vitro suppressed its activity. These studies suggest that alternations in DNA methylation may be one of the mechanisms regulating the tissue-specific expression of the tissue transglutaminase gene.
Transglutaminases are a family of calcium-dependent enzymes that catalyze the covalent cross-linking of proteins by forming isopeptide bonds between peptide-bound glutamine and lysine residues (1–3). Members of this multigene family are expressed in diverse physiological compartments. Both keratinocyte transglutaminase and seminal plasma transglutaminase are expressed in highly specialized tissues, the former prominently in differentiating keratinocytes (4) and the latter is synthesized and secreted by prostatic epithelial cells (5). Other transglutaminases are more ubiquitous in their distribution. Plasma factor XIII is found in blood and extracellular matrix; studies have suggested that the enzyme can be made in several types of cells and tissues such as monocytes and macrophages (6), platelets (7), and the placenta (8). Tissue transglutaminase is expressed in many cells and tissues (1); it is abundant in tissues such as smooth muscle, endothelial cells (9), macrophages (10), and chondrocytes (11) but is present at very low levels in other cells, such as neurons and skeletal muscle cells (12–14).
We have been interested in the factors that control the expression of tissue transglutaminase in both normal and pathological cells and tissues. Previous studies from our laboratory have implicated retinoids as important regulators of the expression of the tissue transglutaminase gene (15–17). In vitamin A-deficient rats, depletion of endogenous retinoid stores resulted in a general suppression of the level of transglutaminase activity in the lungs, the liver, and the trachea (18). These findings suggest that retinoids play a role in physiologically regulating the expression of the enzyme.
Studies of the core promoters of the tissue transglutaminase gene from several species have suggested that they have high constitutive transcriptional activity (19–21). This suggests that negative regulatory mechanisms may contribute to the control of the expression of this enzyme and these mechanisms may underlie the pattern of tissue-specific transglutaminase gene expression. The studies reported in this paper were undertaken to determine the role of a generalized negative regulatory mechanism, DNA methylation (22), in controlling the transcriptional activity of the human tissue transglutaminase promoter. Our results suggest that the methylation of CpG-rich segments of this promoter is correlated with a lowered level of transcriptional activity; ex vivo methylation markedly decreases transcriptional activity of the promoter in vivo. Reciprocally, demethylation after the treatment of cells with 5-azacytidine is associated with increased the enzyme expression. We have concluded that selective demethylation of the tissue transglutaminase promoter may regulate the levels of expression of the gene and may contribute to the tissue-specific pattern of enzyme expression.
MATERIALS AND METHODS
Cell Culture.
Human adrenal adenocarcinoma cell line SW13 and HeLa cells were maintained in Dulbecco’s modified Eagle’s medium (GIBCO/BRL) supplemented with 10% fetal bovine serum (HyClone) at 37°C in a 5% CO2/95% air incubator. Human erythroid leukemia K562 cells were cultured in RPMI 1640 medium (Sigma) supplemented with 10% fetal bovine serum. Human promyelocytic leukemia HL-60 cells were cultured in RPMI 1640 medium supplemented with insulin (5 mg/l), transferrin (5 mg/l), and 3 nM sodium selenite (Sigma). Human umbilical vein endothelial cells (HUVECs) (American Type Culture Collection) were maintained in Dulbecco’s modified Eagle’s medium with 15% fetal bovine serum and human basic fibroblast growth factor (Genzyme; 10 ng/ml). Peripheral blood lymphocytes and monocytes were obtained on the day of collection from Gulf Coast Regional Blood Center (Houston, TX) and were isolated by a countercurrent elutriation protocol (23).
Reagent.
5-Azacytidine was purchased from Sigma.
Plasmid DNA.
Vectors HTGP2-Luc, pXP2-ΔCAAT-Luc, and pXP2-TG-Luc were made by subcloning the human tissue transglutaminase promoter DNA fragments into promoterless luciferase reporter vector pXP2-Luc (20). pSV2-AL-Luc was used as the control.
Transient Transfection Assay.
Lipofectin-mediated transfection was used for the transient transfection assays according to the protocol provided by GIBCO/BRL.
Cell Extract Preparation.
Cells in 35-mm plates were washed twice with PBS. After 5 min of incubation with cell lysis buffer (25 mM Tris phosphate, pH 7.8/2 mM dithiothreitol/2 mM EDTA/10% glycerol/1% Triton X-100), the cells were scraped with a rubber policeman. The samples were then centrifuged at 4°C for 5 min and the supernatants were transferred to fresh vials. The protein concentration of each sample was determined before the assay for either luciferase activity or β-galactosidase activity.
Luciferase Assay and β-Galactosidase Assay.
Luciferase assays were performed in a Monolight 2010 Luminometer (Analytical Luminescence Laboratory, San Diego). For each assay, 40 μl of cell extract was added into a cuvette and the reaction was started by addition of 200 μl of substrate buffer (27 mM KH2PO4/K2HPO4,, pH 7.8/42 mM MgSO4/11.2 mM EDTA/70 mM glycylglycine/4 mM dithiothreitol/3.6 mM ATP/0.4 mM Luciferin). Each reaction was measured for 10 sec; luciferase activity was defined as light units/mg of protein.
β-Galactosidase activity was determined by using a protocol for the chemiluminescent detection of β-galactosidase (Tropix, Bedford, MA).
In Vitro DNA Methylation.
Bacterial methylase HhaI was used to methylate pSV2-AL-Luc and the transglutaminase promoter/luciferase reporter constructs. Plasmid DNA was incubated with 3 units of HhaI methylase per μg of DNA in 50 mM Tris⋅HCl, pH 7.5/10 mM EDTA/80 mM S-adenosylmethionine/5 mM 2-mercaptoethanol. All methylation reactions were incubated at 37°C overnight. To test the samples for complete methylation, the DNA was digested with HhaI restriction endonuclease and analyzed by agarose gel electrophoresis. Only samples that were protected from HhaI restriction enzyme digestion by DNA methylation were used in transfection experiments.
Southern Blot Analysis.
Genomic DNA was isolated from cells according to a phenol-free protocol (Qiagen, Chatsworth, CA). After restriction enzyme digestion, 20 μg of DNA from each sample was fractionated on a 1% agarose gel and then transferred onto a nitrocellular filter. Hybridization was performed according to a standard protocol (24).
Transglutaminase Assay.
Transglutaminase is calcium-dependent enzyme and its activity was assayed by measuring the Ca2+-dependent incorporation of [3H]putrescine into casein as described (25). Cell lysates were incubated with N,N-dimethylcasein (2 mg/ml) and [3H]putrescine (0.5 mM) in a buffer containing 20 mM Tris⋅HCl, 5 mM CaCl2, 15 mM 2-mercaptoethanol, and 150 mM NaCl. Aliquots were taken at intervals and spotted onto Whatman 3MM filter papers, and the protein-bound radioactivity was determined by trichloroacetic acid precipitation. Enzyme activity was expressed as pmol of [3H]putrescine incorporated into casein per min per mg of cell extract protein. Proteins were determined by the Coomassie blue-binding assay.
RESULTS
Correlation of the Hypomethylation of the Tissue Transglutaminase Promoter with Basal Expression of the Gene.
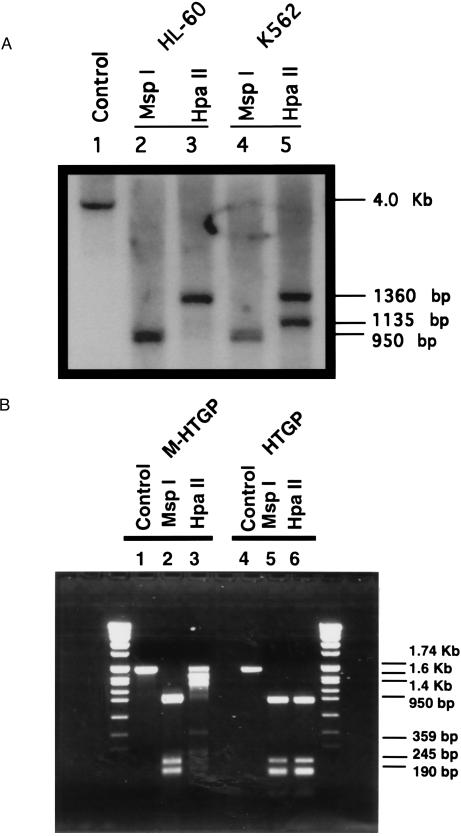
Genomic DNA from human erythroid leukemia K562 and human promyelocytic leukemia HL-60 cells was digested with HindIII and either HpaII, a methylation sensitive restriction endonuclease, or MspI, a methylation-insensitive isoschizomer. Fig. 1A shows the pattern of bands obtained when digested DNA samples were probed with a 1.74-kb HindIII–NcoI fragment derived from the proximal human tissue transglutaminase gene promoter (nucleotides −1665 to +72). DNA from HL-60 cells digested with HindIII alone gave the anticipated 4.0-kb fragment (lane 1 and same 4-kb band can also be obtained from K562 sample). In HL-60 cells, digestion of DNA with HindIII and MspI, a methylation-insensitive enzyme, gave a 950-bp band (Fig. 1A, lane 2), whereas digestion of DNA with the methylation-sensitive isoschizomer HpaII gave a larger band of 1360 bp (lane 3). Digestion of K562 cell DNA with HindIII and MspI gave the same 950-bp band (lane 4) as was detected in the HL-60 DNA whereas digestion with HindIII and HpaII gave two bands of 1360 and 1135 bp (lane 5). These results suggest that in both HL-60 and K562 DNA, the tissue transglutaminase promoter is methylated and, furthermore, that there are differences in the sites of methylation of the promoter in these two tumor cell lines.
Figure 1.
Methylation status of the human tissue transglutaminase promoter in tumor cell lines. (A) Determination of methylation state of the tissue transglutaminase promoter in HL-60 and K562 cells. Genomic DNA from HL-60 cells was digested with HindIII (lane 1), and DNA samples from both HL-60 and K562 cells were digested with HindIII plus MspI (lanes 2 and 4) or HindIII plus HpaII (lanes 3 and 5). Subsequently, the DNA fragments were fractionated on a 1% agarose gel followed by Southern blot analysis using as a probe the 1.74-kb HindIII–NcoI fragment from the 5′ flanking region of the human tissue transglutaminase gene. (B) Determination of modification of the human tissue transglutaminase gene promoter by methylation in vitro. The 1.74-kb promoter fragment was methylated by bacterial HpaII methylase. The methylated (M-HTGP) or unmethylated (HTGP) DNA samples were digested by the restriction enzymes HpaII or MspII, respectively. The DNA fragments were fractionated on a 1% agarose gel.
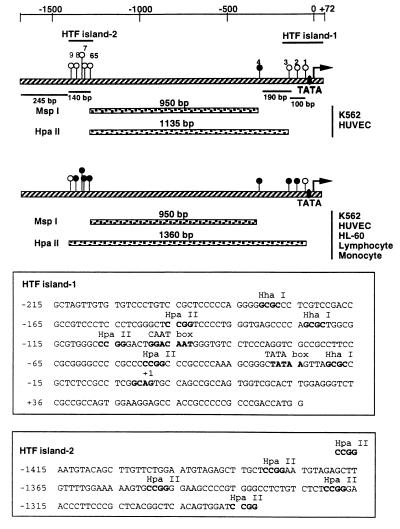
The proximal promoter of the human tissue transglutaminase gene includes two CpG-rich regions that fit the criteria for being HTF (HpaII tiny fragment) islands (Fig. 2), a well recognized sites of DNA methylation. To determine whether methylation at these sites is the basis for the isoschizomer digestion pattern of human tumor cell DNA, the proximal segment of the human tissue transglutaminase promoter (1.74 kb) was methylated in vitro with CpG methylase, a bacterial methylase capable of exhaustive methylation of all CpG dinucleotides, and then digested with HpaII or MspI (Fig. 1B). Digestion of the unmethylated promoter with either MspI or HpaII gave a 950-bp fragment compatible with cleavage at both HTF islands (Fig. 2). Methylation of the promoter had no effect on the MspI digestion pattern but altered HpaII pattern such that fragments of 1.74 Kb, 1.6 Kb, and 1.4 Kb were the major digestion products. These bands, which are larger than the major fragments of the transglutaminase promoter detected in HpaII digests of human tumor DNA, indicate that there are potential sites of methylation that can be methylated in vitro by CpG methylase but are not methylated in vivo (Figs. 1A and 2). The results we have obtained are compatible with the conclusion that methylation of two HTF islands in the proximal tissue transglutaminase promoter accounts for the isoschizomer digestion pattern of the promoter in the two human tumor cell lines.
Figure 2.
Schematic demonstration of methylation sites on the tissue transglutaminase promoter in tumor cell lines and normal human tissues. The 1.74-kb promoter fragment is shown as hatched bar. HpaII sites are indicated as circles and numbered from 1 to 9. The open circles are the unmethylated HpaII sites and the solid circles are the methylated HpaII sites. (Top) On one allele of the tissue transglutaminase promoter in K562 and HUVEC cells, the methylation sites were hypomethylated and Southern blot analysis gave a 1135-bp band by HindIII plus HpaII digestions. (Middle) On the other allele of the gene in K562 and HUVEC cells and both alleles in HL-60 cells, lymphocytes, and monocytes, the methylation sites were hypermethylated and Southern blot analysis showed a 1360-bp band. (Bottom) Sequences of two HTF islands. The HpaII and HhaI sites are indicated.
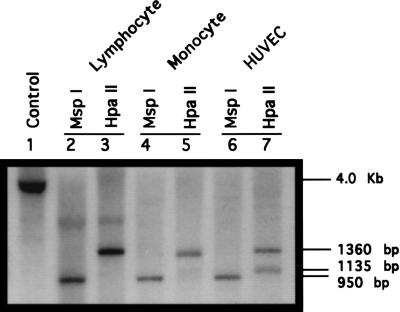
Isoschizomer analysis of the methylation of the transglutaminase promoter in the two human tumor cell lines demonstrated differences in methylation state of the promoter. The presence of a single large band (1360 bp) in the HpaII digest of HL-60 DNA compared with two bands (1360 and 1135 bp) in the equivalent digests of K-562 DNA suggests decreased methylation or hypomethylation of the promoter in K562 as compared with HL-60 cells. K562 cells have a basal level of transglutaminase expression, whereas there is no constitutive expression of the enzyme in HL-60 cells (Table 1). To determine whether the transglutaminase promoter was also methylated in normal human cells, we conducted isoschizomer analysis of transglutaminase promoter methylation in peripheral blood lymphocytes, monocytes, and primary cultured endothelial cells (HUVECs) (Fig. 3). In all three cell lines, digestion with MspI gave the anticipated 950-bp fragment (lanes 2, 4, and 6). In all three cases, digestion with HpaII gave larger fragments, indicating methylation of the promoter in all three cell types. In both lymphocytes and monocytes, the HpaII band pattern was identical to that in HL-60 cells, a single 1360-bp band was detected (Fig. 3, lanes 3 and 5). HpaII digestion of HUVEC DNA gave two bands, 1360 and 1135 bp, a pattern that exactly matched the digestion pattern obtained with K562 DNA (Fig. 3, lane 7). Analysis of the level of transglutaminase expression in these cell types indicated that in both monocytes and lymphocytes, there is no detectable level of expression of the gene whereas in HUVEC cells there is constitutive expression of the enzyme as indicated by significant transglutaminase activity (Table 1). These studies suggest that there are at least two basal states of methylation of the tissue transglutaminase promoter. One, characteristic of the promoter in lymphocytes, monocytes, and HL-60 cells, is a relatively hypermethylated state that is paralleled by an absence of detectable level of the enzyme expression. The second state, characteristic of both HUVEC and K562 cells, includes partial demethylation or hypomethylation of the promoter. This latter state is paralleled by the transglutaminase gene expression.
Table 1.
Transglutaminase activity in human cells
| Cell | Basal transglutaminase activity, pmol per min per mg of cellular protein |
|---|---|
| HL-60 | <0.001 |
| K562 | 0.064 |
| Lymphocyte | <0.001 |
| Monocyte | <0.001 |
| HUVEC | 0.67 |
Cell extracts were prepared from the cells and assayed for transglutaminase activity (25).
Figure 3.
Methylation state of the tissue transglutaminase promoter in lymphocytes, monocytes, and HUVECs. Genomic DNA from lymphocytes was digested with HindIII (lane 1). Genomic DNA samples from peripheral blood lymphocytes, monocytes, and HUVECs were digested with HindIII plus MspI (lanes 2, 4, and 6), or HindIII plus HpaII (lanes 3, 5, and 7). Subsequently, the DNA samples were fractionated on a 1% agarose gel followed by Southern blot analysis.
Effect of DNA Demethylation on Transglutaminase Expression.
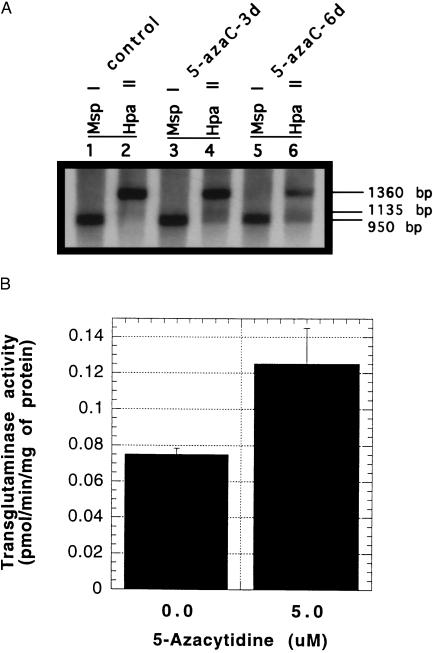
The preceding studies indicate a possible association between hypomethylation of the transglutaminase promoter and increased levels of enzyme expression. To address this issue directly, we induced hypomethylation of the transglutaminase promoter with 5-azacytidine and measured the effect on the enzyme expression. HeLa cells were selected for these studies because, in preliminary experiments, we determined that concentrations of 5-azacytidine of up to 5 μM had no effect on cell proliferation, cell viability, or cell morphology over a 6-day culture period. HeLa cells were treated for 3 or 6 days with 5-azacytidine and then the level of the promoter methylation was assessed by isoschizomer analysis (Fig. 4A). In both control, 3-day and 6-day treated cells, MspI digestion gave the anticipated 950-bp bands (lanes 1, 3, and 5). Treatment with 5-azacytidine resulted in a progressive decrease in the intensity of the 1360-bp band and a corresponding increase in the 950-bp band in the HpaII digests of 5-azacytidine-treated cells (lanes 2, 4, and 6). Quantitation of the intensity of the 1360-bp and 950-bp bands by densitometry showed ratio of 25:1, 4.8:1 and 2.4:1 (1360:950) in the day 0, day 3, and day 6 digests, respectively. This alteration in digestion pattern is compatible with progressive hypomethylation of the transglutaminase promoter. The transglutaminase activity of the 5-azacytidine-treated cells was increased after azacytidine treatment (Fig. 4B).
Figure 4.
Effect of 5-azacytidine on DNA methylation state of the tissue transglutaminase promoter and the gene expression. (A) HeLa cells were treated with 5 μM 5-azacytidine for 3 days or 6 days. On day 6 after 5-azacytidine treatment, the genomic DNA was isolated from control cells (lanes 1 and 2), 3-day treated cells (lanes 3 and 4), and 6-day treated cells (lanes 5 and 6) and subjected to the digestion with HindIII plus MspI (lanes 1, 3, and 5) or HindIII plus HpaII (lanes 2, 4, and 6), followed by Southern blot analysis. (B) HeLa cells were treated with 5.0 μM 5-azacytidine for 3 days. On day 6, the cell extracts were prepared from both control and drug-treated cells and subjected to transglutaminase assay.
Inhibition of Tissue Transglutaminase Promoter Activity by ex Vivo DNA Methylation.
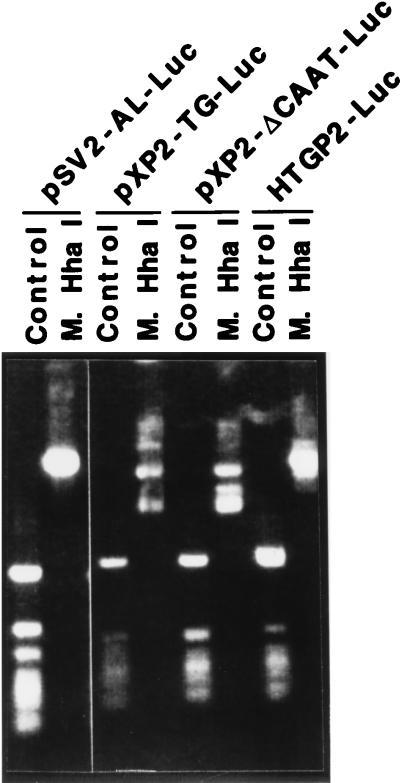
The effect of ex vivo methylation on the promoter activity of the tissue transglutaminase gene was investigated through transient transfection experiments. First, the tissue transglutaminase promoter/luciferase reporter constructs were methylated in vitro by HhaI methylase, a site-specific bacterial DNA methylase, and then to determine if all HhaI sites were protected by methylation, the methylated plasmid DNA was digested with methylation-sensitive HhaI. As shown in Fig. 5, the control plasmid DNA can be cut by HhaI whereas the methylated plasmid DNA cannot. Subsequently, both the methylated and control plasmid DNA was transfected into SW13 cells, an andrenal adenocarcinoma cell line that showed a high level of promoter activity after transfection with transglutaminase promoter constructs (20). Consistent with report of Guenette et al. (26), HhaI methylation did not affect the activity of the simian virus 40 promoter (Table 2). The human tissue transglutaminase promoter/luciferase reporter constructs pXP2-ΔCAAT-Luc (nucleotides −62 to +72), pXP2-TG-Luc (nucleotides −122 to +72), and HTGP2-Luc (nucleotides −1665 to +72) contain HhaI sites in the core promoter region and in vitro methylation decreased their transcriptional activity by 50–70% compared with their controls (Table 2). These results demonstrated that ex vivo methylation can suppress the high basal activity of the tissue transglutaminase promoter.
Figure 5.
Determination of the methylation of plasmid DNA using methylation-sensitive restriction enzyme. The vectors pSV2-AL-Luc, pXP2-ΔCAAT-Luc, pXP2-TG-Luc, and HTGP2-Luc were methylated by site-specific methylase HhaI in vitro. Subsequently, the methylated plasmid DNA and control plasmid were digested by methylation-sensitive restriction enzyme HhaI and fractionated on a 1% agarose gel.
Table 2.
Effect of methylation on the activity of the tissue transglutaminase promoter/reporter gene constructs
| Vector | Luciferase activity, light units per β-gal unit
|
Inhibition, % | |
|---|---|---|---|
| Control | Methylation | ||
| pSV2-AL-Luc | 32.73 | 30.49 | 7 |
| pXP2-ΔCAAT-Luc | 2.06 | 0.97 | 52 |
| pXP2-TG-Luc | 7.35 | 1.88 | 74 |
| HTGP2-Luc | 4.88 | 2.30 | 53 |
SW13 cells were cotransfected with 0.5 μg of pSV2-β-gal vector and 1 μg of methylated or control vectors pSV2-AL-Luc, pXP2-ΔCAAT-Luc, pXP2-TG-Luc, or HTGP2-Luc for 48 h, followed by a luciferase assay and a β-galactosidase (β-gal) assay. The β-gal activity was used as an internal control.
DISCUSSION
Analysis of the structure of the promoters of several tissue transglutaminase genes has demonstrated that the core promoters, which contain a TATA-box motif and CpG-rich flanking region, show a high basal transcriptional activity in many types of cells. Even though the core tissue transglutaminase promoter is constitutively active (20), the intact transglutaminase gene is expressed in a highly regulated manner. Expression of the gene is much lower in some tissues, such as skeletal muscle cells and neurons, than it is in others, such as endothelial cells and chondrocytes. Furthermore, physiological processes such as macrophage activation or the induction of apoptosis can lead to dramatic increases in the expression of the tissue transglutaminase gene (16, 27). These observations have led us to speculate that the level of expression of the tissue transglutaminase promoter may be under negative regulatory control (20). Release from the inhibition of this regulatory mechanism may play an important role in controlling the level of transglutaminase expression in a tissue-specific manner.
The negative regulation of gene expression has been associated with several distinct mechanisms, such as DNA methylation (22, 28), transcriptional silencers (29), and nucleosome structure (30). Methylation has been shown to play an important role in regulating the expression of keratinocyte transglutaminase (31, 32), another member of transglutaminase multigene family. Since the proximal promoters of several tissue transglutaminase genes contain conserved CpG-rich regions that fit the criteria of an “HTF island” (22), an important site of sequence-specific DNA methylation, we undertook a series of studies to investigate the role of DNA methylation in the control of the expression of the tissue transglutaminase gene.
The results we obtained established a correlation between the degree of promoter demethylation and the constitutive transcriptional activity of the tissue transglutaminase promoter. In HUVECs or K562 cells, in which the level of the enzyme activity was high, the promoter showed evidence of being hypomethylated. In both normal and transformed cells in which the level of expression of the transglutaminase gene was very low (i.e., lymphocytes, monocytes, and HL-60 cells), the promoter was hypermethylated. Altering the level of promoter methylation by treating cells with 5-azacytidine increased the level of tissue transglutaminase activity. The similarity in the effects of methylation on the expression of both tissue and keratinocyte transglutaminases suggests that alterations in the level of methylation of transglutaminase gene promoters may be a common mechanism controlling the expression of several members of this multigene family.
Structural analysis of the proximal promoter of the tissue transglutaminase gene indicated that the sites of DNA methylation are concentrated in two clusters of CpG dinucleotides; one is located in the core promoter (nucleotides −205 to +75) and the other is located approximately 1.3-kb upstream. In hypomethylated DNA, both clusters of methylation sites appear to undergo equivalent demethylation. Ex vivo methylation of both of these sites resulted in a marked decrease in transcriptional activity, but deletion analysis indicated that methylation of the proximal site, which contains the core promoter, is sufficient to suppress the basal level of transcription. The transcriptional activity of some gene promoters containing HTF-like sequence in their proximal promoter region, such as proα1(I)-collagen and platelet-derived growth factor genes, has been shown to be inhibited by methylation whereas the transcriptional activity of others, such as the early promoter of simian virus 40, is unaffected (33, 34). The demethylation of the transglutaminase promoter may be allelic-specific, since isoschizomer analysis showed that digestion with the methylation-sensitive restriction endonuclease HpaII resulted in the generation of two fragments of equal intensity, representing hypomethylated and hypermethylated alleles. This observation is compatible with a process of allelic-specific hypomethylation or imprinting, in which maternally and paternally inherited copies of the same gene are methylated differently (22).
Several important morphogens, including retinoids and transforming growth factor β, have been reported to regulate the expression of tissue transglutaminase activity. Retinoids have been shown to directly regulate transcription of the tissue transglutaminase gene (17), but the effects of transforming grwoth factor β are not yet well understood (35). Because DNA methylation controls the basal level of expression of the tissue transglutaminase gene, we considered the possibility that the inductive effects of retinoids might be linked to alterations in the level of methylation of the transglutaminase promoter. However, treatment of HL-60 cells with retinoids under conditions previously shown to increase transglutaminase activity (36) had no effect on the level of methylation of the endogenous transglutaminase promoter as judged by isoschizomer analysis (data not shown). Thus retinoid-induced increases in tissue transglutaminase expression are not attributable to alterations in promoter methylation.
We believe that alterations in DNA methylation may be involved in the more general level of the control of gene expression, such as tissue-specific expression of the transglutaminase gene. Alterations in DNA methylation have been shown to control tissue-specific expression of several other developmentally regulated genes, FMR-1 (37), MyoD (38), and actin (39). One interesting possibility is that alterations in DNA methylation may be intimately linked to the induction of the enzyme that occurs in cells undergoing programmed or apoptotic cell death. Several recent studies have shown that alterations in DNA methylation are frequently associated with the induction of apoptosis (40, 41). It is possible that the induction of tissue transglutaminase in cells undergoing apoptosis may reflect a consequence of demethylation associated with the induction or activation of apoptosis.
Acknowledgments
We are grateful for the excellent technical assistance of Mary Sobieski and Nancy Shipley and the secretarial assistance of Joan Jennings. This work was supported in part by Research Grant DK27078 from the National Institutes of Health.
ABBREVIATIONS
- HUVEC
human umbilical vein endothelial cell
- HTF
HpaII tiny fragment
References
- 1.Greenberg C S, Birckbichler P J, Rice R H. FASEB J. 1991;5:3071–3077. doi: 10.1096/fasebj.5.15.1683845. [DOI] [PubMed] [Google Scholar]
- 2.Ichinose A, Bottenus R E, Davie E W. J Biol Chem. 1990;265:13411–13414. [PubMed] [Google Scholar]
- 3.Folk J E. Annu Rev Biochem. 1980;49:517–531. doi: 10.1146/annurev.bi.49.070180.002505. [DOI] [PubMed] [Google Scholar]
- 4.Thacher S M, Rice R H. Cell. 1985;40:685–695. doi: 10.1016/0092-8674(85)90217-x. [DOI] [PubMed] [Google Scholar]
- 5.Ho K C, Quarmby V E, French F S, Wilson E M. J Biol Chem. 1992;267:12660–12667. [PubMed] [Google Scholar]
- 6.Henriksson P, Becker S, Lynch G, McDonagh J. J Clin Invest. 1985;76:528–534. doi: 10.1172/JCI112002. [DOI] [PMC free article] [PubMed] [Google Scholar]
- 7.Lynch G W, Pfueller S L. Thromb Haemostasis. 1988;59:372–377. [PubMed] [Google Scholar]
- 8.Weisberg L J, Shiu D T, Conkling P R, Shuman M A. Blood. 1987;70:579–582. [PubMed] [Google Scholar]
- 9.Thomazy V, Fesus L. Cell Tissue Res. 1989;255:215–224. doi: 10.1007/BF00229084. [DOI] [PubMed] [Google Scholar]
- 10.Murtaugh M P, Mehta K, Johnson J, Myers M, Juliano R L, Davies P J. J Biol Chem. 1983;258:11074–11081. [PubMed] [Google Scholar]
- 11.Aeschlimann D, Wetterwald A, Fleisch H, Paulsson M. J Cell Biol. 1993;120:1461–1470. doi: 10.1083/jcb.120.6.1461. [DOI] [PMC free article] [PubMed] [Google Scholar]
- 12.Byrd J C, Lichti U. J Biol Chem. 1987;262:11699–11705. [PubMed] [Google Scholar]
- 13.Fesus L, Thomazy V, Falus A. FEBS Lett. 1987;224:104–108. doi: 10.1016/0014-5793(87)80430-1. [DOI] [PubMed] [Google Scholar]
- 14.Hand D, Campoy F J, Clark S, Fisher A, Haynes L W. J Neurochem. 1993;61:1064–1072. doi: 10.1111/j.1471-4159.1993.tb03621.x. [DOI] [PubMed] [Google Scholar]
- 15.Murtaugh M P, Dennison O, Stein J P, Davies P J. J Exp Med. 1986;163:1325–1330. doi: 10.1084/jem.163.5.1325. [DOI] [PMC free article] [PubMed] [Google Scholar]
- 16.Moore W T, Jr, Murtaugh M P, Davies P J. J Biol Chem. 1984;259:12794–12802. [PubMed] [Google Scholar]
- 17.Chiocca E A, Davies P J, Stein J P. J Biol Chem. 1988;263:11584–11589. [PubMed] [Google Scholar]
- 18.Verma A K, Shoemaker A, Simsiman R, Denning M, Zachman R D. J Nutr. 1992;122:2144–2152. doi: 10.1093/jn/122.11.2144. [DOI] [PubMed] [Google Scholar]
- 19.Suto N, Ikura K, Shinagawa R, Sasaki R. Biochim Biophys Acta. 1993;1172:319–322. doi: 10.1016/0167-4781(93)90221-x. [DOI] [PubMed] [Google Scholar]
- 20.Lu S, Saydak M, Gentile V, Stein J P, Davies P J. J Biol Chem. 1995;270:9748–9756. doi: 10.1074/jbc.270.17.9748. [DOI] [PubMed] [Google Scholar]
- 21.Nagy L, Saydak M, Shipley N, Lu S, Basilion J P, Zhong H Y, Syka P, Heyman R, Chandraratna R A S, Stein J P, Davies P J A. J Biol Chem. 1995;271:4355–4365. doi: 10.1074/jbc.271.8.4355. [DOI] [PubMed] [Google Scholar]
- 22.Bird A P. Nature (London) 1986;321:209–213. doi: 10.1038/321209a0. [DOI] [PubMed] [Google Scholar]
- 23.Nii A, Fidler I J. Lymphokine Res. 1990;9:113–124. [PubMed] [Google Scholar]
- 24.Sambrook J, Fritsch E F, Maniatis T. Molecular Cloning: A Laboratory Manual. 2nd Ed. Plainview, NY: Cold Spring Harbor Lab. Press; 1989. [Google Scholar]
- 25.Lorand L, Campbell-Wilkes L K, Cooperstein L. Anal Biochem. 1972;50:623–631. doi: 10.1016/0003-2697(72)90074-7. [DOI] [PubMed] [Google Scholar]
- 26.Guenette D K, Ritzenthaler J D, Foley J, Jackson J D, Smith B D. Biochemistry J. 1992;283:699–703. doi: 10.1042/bj2830699. [DOI] [PMC free article] [PubMed] [Google Scholar]
- 27.Melino G, Annicchiarico-Petruzzelli M, Piredda L, Candi E, Gentile V, Davies P J, Piacentini M. Mol Cell Biol. 1994;14:6584–6596. doi: 10.1128/mcb.14.10.6584. [DOI] [PMC free article] [PubMed] [Google Scholar]
- 28.Eden S, Cedar H. Curr Opin Genet Dev. 1994;4:255–259. doi: 10.1016/s0959-437x(05)80052-8. [DOI] [PubMed] [Google Scholar]
- 29.Schoenjerr C J, Anderson D J. Science. 1995;267:1360–1363. doi: 10.1126/science.7871435. [DOI] [PubMed] [Google Scholar]
- 30.Adams C C, Workman J T. Cell. 1993;72:305–308. doi: 10.1016/0092-8674(93)90109-4. [DOI] [PubMed] [Google Scholar]
- 31.Duvic M, Nelson D C, Annarella M, Cho M, Esgleyes-Ribot T, Remenyik E, Ulmer R, Rapini R P, Sacks P G, Clayman G L C. J Invest Dermatol. 1994;102:462–469. doi: 10.1111/1523-1747.ep12373021. [DOI] [PubMed] [Google Scholar]
- 32.Rice R H, Qin Q, Pilato A, Rubin A L. Monographs. Bethesda: Natl. Cancer Inst.; 1992. 87–91. [PubMed] [Google Scholar]
- 33.Thompson J P, Simkevich C P, Holness M A, Kang A H, Raghow R. J Biol Chem. 1991;266:2549–2556. [PubMed] [Google Scholar]
- 34.Lin X H, Guo C, Gu L J, Deuel T F. J Biol Chem. 1993;268:17334–17340. [PubMed] [Google Scholar]
- 35.George M D, Vollberg T M, Floyd E E, Stein J P, Jetten A M. J Biol Chem. 1990;265:11098–11104. [PubMed] [Google Scholar]
- 36.Davies P J, Murtaugh M P, Moore W T, Jr, Johnson G S, Lucas D. J Biol Chem. 1985;260:5166–5174. [PubMed] [Google Scholar]
- 37.Sutcliffe J S, Nelson D L, Zhang F, Pieretti M, Caskey C T, Saxe D, Warren S T. Hum Mol Genet. 1992;1:397–400. doi: 10.1093/hmg/1.6.397. [DOI] [PubMed] [Google Scholar]
- 38.Rideout W M, III, Eversole-Cire P, Spruck C H, III, Hustad C M, Coetzee G A, Gonzales F A, Jones P A. Mol Cell Biol. 1994;14:6143–6152. doi: 10.1128/mcb.14.9.6143. [DOI] [PMC free article] [PubMed] [Google Scholar]
- 39.Yisraeli J, Adelstein R S, Melloul D, Nudel U, Yaffe D, Cedar H. Cell. 1986;46:409–416. doi: 10.1016/0092-8674(86)90661-6. [DOI] [PubMed] [Google Scholar]
- 40.Murakami T, Li X, Gong J, Bhatia U, Traganos F, Darzynkiewicz Z. Cancer Res. 1995;55:3093–3098. [PubMed] [Google Scholar]
- 41.Wu J, Herman J G, Wilson G, Lee R Y, Yen R W, Mabry M, de Bustros A, Nelkin B D, Baylin S B. Cancer Res. 1996;56:616–622. [PubMed] [Google Scholar]


