

Abstract
The investigation of inertial cavitation in micro-tunnels has significant implications for the development of therapeutic applications of ultrasound such as ultrasound-mediated drug and gene delivery. The threshold for inertial cavitation was investigated using a passive cavitation detector with a center frequency of 1 MHz. Micro-tunnels of various diameters (90 to 800 μm) embedded in gel were fabricated and injected with a solution of Optison™ contrast agent of concentrations 1.2% and 0.2% diluted in water. An ultrasound pulse of duration 500 ms and center frequency 1.736 MHz was used to insonate the microbubbles. The acoustic pressure was increased at one second intervals until broadband noise emission was detected. The pressure threshold at which broadband noise emission was observed was found to be dependent on the diameter of the micro-tunnels, with an average increase of 1.2 to 1.5 between the smallest and the largest tunnels, depending on the microbubble concentration. The evaluation of inertial cavitation in gel tunnels rather than tubes provides a novel opportunity to investigate microbubble collapse in a situation that simulates in vivo blood vessels better than tubes with solid walls do.
Keywords: Ultrasound Contrast agents, cavitation, focused transducers, passive cavitation detection, broadband noise, gel phantom
Introduction
Ultrasound (US) contrast agents (UCAs) are gas microbubbles encapsulated by albumin, lipids, polymer or surfactant shell. They are less than 10 μm in diameter and contain air or a low solubility gas such as perfluorocarbon. UCAs underwent a significant development in the 1990s for diagnostic applications (Becher and Burns, 2000) and more recently have also been investigated for potential therapeutic applications such as to facilitate ultrasound-mediated drug and gene delivery.
In diagnostic US, microbubbles injected intravenously increase the scattered echoes from vessels and flowing blood owing to their impedance mismatch, resonant and highly non-linear behaviors. At low mechanical index they produce linear backscatter enhancement. As the power is increased, bubbles scatter not only at the acoustic center frequency, but also at low multiples and simple fractions of the driving frequency. It is the detection of these non-linear components which is at the basis of contrast-specific modalities such as contrast harmonic (Burns et al. 1996) and pulse inversion imaging and contrast Doppler (Hope Simpson et al. 1999), which are used to suppress tissue signals and enhance blood echo, particularly at the level of the smaller blood vessels. As the pressure amplitude is further increased, contrast agent disruption takes place with the emission of a strong and brief nonlinear echo, which is relatively easy to detect and allows the evaluation of tissue perfusion because of the modification of the signal intensity of the image (Wei et al. 1998). New emerging areas of ultrasound-contrast imaging research are in the targeting of the bubbles to specific sites, such as blood clots (Takeuchi et al. 1999) or endothelial cells (Lindner et al., 2000) and the imaging of angiogenic vessels by high frequency ultrasound exposure (Foster et al. 2000).
In therapy, microbubbles have been investigated for a number of new applications. To cite a few of them, there is clear evidence that the permeability of the cell membrane to large molecules (both drugs and genes) is increased when suspensions of cells are exposed to ultrasound in the presence of an UCA (Bao et al. 1997; Brayman et al. 1999; Greenleaf et al. 1998; Guzmán et al. 2001a; Guzmán et al. 2001b; Kinoshita and Hynynen 2005; Ward et al. 2000). Inertial cavitation (IC) is believed to be the key mechanism for such effect. IC is characterized by the sudden expansion and then rapid collapse of a gas bubble in response to a peak negative pressure in excess of the inertial cavitation threshold.
In vivo, it has been shown that ultrasound enhanced with an UCA may transiently disrupt the blood-brain barrier in animal models with minimal damage, providing a technique for non-invasive, localized drug-delivery deep within the brain as monitored by magnetic resonance imaging (Hynynen et al. 2001). Other in vivo applications include the delivery of large molecules to sites such as interstitial tissues through micro-vessel rupture (Bao et al. 1998; Dalecki et al. 1997; Lu et al. 2003; Price et al. 1998) and blood clot lysis (Luo et al. 1998; Porter et al. 2001; Tachibana and Tachibana 1995). Microbubbles loaded with a bioactive substance can be destroyed in a target organ or tissue, thus allowing for the local delivery of therapeutics (Blomley et al. 2001). They can also be targeted to a specific tissue by incorporating protein ligands on their surface (Unger et al. 2002).
In order to improve these techniques and for the development of new ones, a significant research endeavour is underway. At the level of basic physics research, efforts are concentrated in determining through experimentation and mathematical modeling the scattering properties and the bubble dynamics of the different kinds of UCAs, which differ for properties such as encapsulating shell, gas, and size distribution (de Jong and Hoff 1993; Guan and Matula 2004; Lo et al. 2006; Marsh et al. 1999; May et al. 2002). A number of models have been proposed to describe the bubble dynamics in the presence of a shell, which are a modification of the free bubble equation, such as the Rayleigh-Plesset equation or the Gilmore equations, to include the shell properties (Allen et al. 2002; Chatterjee and Sasaki 2003; Church 1995; Hoff et al. 2000; Khismatullin and Nadim 2002).
Furthermore, the investigation of UCA destruction mechanisms has been the object of several studies. These studies cover a wide range of detection techniques, UCAs, equipment and US exposure conditions and are aimed at determining the thresholds for bubble collapse (Ammi et al. 2006; Chen et al. 2003a; Chen et al. 2003b; Chien and Burns 2004; Chomas et al. 2001a; Chomas et al. 2001b; Crum et al. 1992; Giesecke and Hynynen 2003; Holland and Apfel 1990; Shi et al. 2000). In all of these investigations the microbubbles are usually placed in a vessel which is much larger than their sizes and therefore the effect of boundaries are negligible.
However, in a clinical practice UCAs are normally injected into blood vessels and therefore the presence of boundaries may become significant. For this reason, the investigation of the bubble behavior in confined geometries has recently generated considerable attention (Zhong et al. 2001; Sassaroli and Hynynen 2004; Cui et al. 2006; Hu et al. 2005; Caskey et. al. 2006 ; Quin and Ferrara 2006). The resonance frequency and the damping coefficient of a bubble in an infinite volume of liquid have been well studied (Leigthon 1994). Less is known about the linear response of a bubble in a confined geometry. In such a situation, the linear resonance theory needs to be modified to take into account the fact that the bubble cannot be assumed in radial motion and that the tube wall imposes boundary conditions and generates reflection.
Leighton et al. (1995a; 1995b) derived an equation of motion with appropriate expressions for the mass, stiffness and damping coefficient, to describe the forced oscillations of a cylindrical bubble to a low intensity acoustic field. They tested their model by constructing a bubble of centimeter-order length and diameter of a few millimeters, which was set into oscillations by a low frequency sound in the range 15–36 Hz, obtaining good agreement between theory and experiment. In their experiment, one wall of the bubble (the gas-liquid interface) could move but the other walls (the curved wall, and the other end of the cylinder) were bounded by rigid surfaces.
In an earlier study, Miller (1979) investigated theoretically the response to ultrasound of gas-filled intercellular channels (gas bodies) in plant tissue. He modelled the gas-channels as cylindrical bubbles bounded by elastic walls and derived analytical expressions for their resonance frequency and damping. More recent investigations include the work by Sassaroli and Hynynen (2004; 2005), who performed numerical simulations to predict the resonance frequency and the damping of a gas microbubble placed on the axis of a blood vessel as a function of the radius, length, and microbubble position. It was found that the presence of the boundary represented by the blood vessel introduces a correction factor to the resonance and damping coefficient of an unconstrained microbubble.
Cui et al. (2006) studied the response of an acoustically driven spherical bubble between parallel plates in linear approximation. They derived explicit expressions for the resonance frequency and damping, which also accounts for the compressibility of the liquid.
Those above mentioned studies provide a good understanding of the behavior of constrained bubbles driven by low-intensity acoustic fields. The inertial collapse of a bubble in a narrow tube is however a much more difficult problem to treat theoretically, and the physics related to this phenomenon needs to be further explored.
In a free field situation, the early stage of a spherical-bubble collapse is dominated by the liquid inertia, as it was originally understood by Lord Rayleigh (1917), who investigated the collapse of an empty spherical cavity. Leighton et al. (1995a; 1995b) have discussed the role of the liquid inertia in the dynamics of bubbles in rigid tubes. The radiation mass of a free-floating spherical bubble is finite and relatively small, this because at large distances from the bubble the liquid velocity goes to zero as 1/r2 (r = distance from the bubble center), so that the total kinetic energy of the liquid is finite, even within an infinite liquid medium. At the opposite extreme, the radiation mass of a cylindrical bubble, also loosely termed “one dimensional”, i.e. a bubble that fills the cross section of an infinite long pipe, is infinite and the bubble does not behave as an oscillator at all. This is because the inertia contribution from the liquid contained in the tube increases monotonically with the tube length. In practical situations bubbles are not truly one-dimensional, and a radiation mass can be still defined for a bubble. However, it can be expected that the larger the bubble size with respect to the tube diameter, the greater the degree to which the bubble inertia departs from its free value. Leighton et al. (1998, 2000) have modelled the Rayleigh-like collapse of a conical bubble. In such a situation, when the bubble is small the fluid flow has a spherical symmetry and the bubble inertia is close to the free inertia, but tends to the one-dimensional inertia when the bubble is large. They concluded that the geometry of the system containing the bubble greatly affects the bubble inertia and therefore its Rayleigh-like collapse can be controlled by a suitable choice of the geometry. In general, it should be expected that inertial collapse is affected by the vessel size, both length and radius.
The aim of the present work is to investigate the pressure threshold for inertial cavitation in a situation in which the microbubbles are injected in finite length micro-tunnels embedded in gel as a function of the tunnel diameter. We made use of tunnels in gel rather than thin-wall tubes because we wanted to isolate the effect on the cavitation of vessel diameter from the one of US scattering from the tube in order to better simulate the situation of inertial collapse in blood vessels. However there are significant differences with respect to the in vivo situation. We have considered only a straight tunnel and therefore the geometric complexity of the vasculature and its effects on the bubble collapse threshold are ignored. Blood flow and blood vessel compliance is also ignored in our study. Hence the bioeffects associated with IC in vivo are not addressed in this investigation. Nevertheless this study provides physical insights that are essential for characterizing and controlling IC in vivo.
It is also important to point out here that the acoustic parameters chosen in this study, such as the pulse length, are relevant to therapeutical applications rather than diagnostic applications.
Materials and methods
Focused Ultrasound
Two focused air-backed PZT (lead zirconate titanate) transducers (in-house manufactured) of fundamental frequency 0.578 MHz and 1.0 MHz and narrow bandwidth were used in the experiments. The 0.578 MHz transducer had a diameter of 100 mm and a focal distance of 80 mm, and the 1.0 MHz transducer had a diameter of 50 mm and a focal distance of 120 mm. During the experiments the 0.578 MHz transducer was operated at its third harmonic 1.736 MHz. The 1.0 MHz transducer was used as a passive cavitation detector to record broadband noise emission. Wideband noise emission is considered to be a signature of IC (Apfel 1981). The acoustic power output and the focal pressure amplitude as a function of applied radiofrequency power were measured with a radiation force method (Hill 1970) and a calibrated membrane hydrophone (spot diameter 0.5 mm, GEC-Marconi Research Center, Chelmsford, UK), respectively. The peak negative pressure for the higher pressure amplitudes was measured using a membrane shock wave hydrophone (Sonic technologies) that was calibrated with the GEC-Marconi hydrophone at the low pressure amplitudes. The alignment of the two transducers was performed by placing a needle hydrophone approximately at the focus of both transducers. An oscilloscope was used to observe the output of the transducers and small adjustments were made until the alignment of each transducer was optimal. Once the two foci were aligned the two transducers were kept fixed in the tank.
Preparation of tunnels in gel
Four trays were built in order to make the four tunnels in gel of different diameters. The gel used was Agar (Aldrich Chemical Company, Milwaukee, WI, USA) with a concentration of 2% in deionized water. Each tray consisted of a rectangular acrylic slab of height 10 mm, placed horizontally, sandwiched between four acrylic pieces placed vertically at the edges of the slab, two above and two below it. A hole of about 10 mm was made at the center of the slab. A polystyrene tube segment of length 60 mm and 10 mm in diameter was used as a container for the gel. The tube was fixed in the hole in the slab (Fig. 1). Four different diameter silica tubes (Polymicro Technologies, LLC, Phoenix, AZ, USA) were used as templates for the tunnels in gel. Their average outer diameters were respectively 88, 152, 431 and 847 μm. The silica tube was positioned at the center of the polystyrene tube as shown in Fig 1. This figure shows the tray used to make the largest tunnel. A similar tray was built for the second largest tunnel. The trays for the two smallest tunnels were built in a slightly different way in order to accommodate two clips to keep the silica tubes straight. A transfer pipet was used to inject the gel into the polyester tube segments. The gel was removed from the polyester tube and the silica tube was removed from inside the gel just before the insonation exposure, as discussed below.
Fig. 1.

A Front view picture of frame used to make the largest tunnel in gel. The basic frame consisted of a rectangular acrylic slab sandwiched between four acrylic pieces. The gel was injected inside a polystyrene tube segment placed at the slab center. The 847 μm in diameter silica tube, used as templates for the tunnels in gel, was positioned at the center of the polystyrene tubes in the slab hole. Similar frames were built for the smaller silica tubes, see text.
Determination of tunnel diameter
The tunnel diameter was measured using optical microscopy and a hemocytometer grid. A light microscopy picture (Olympus BX40, Tokio, Japan) was taken of a thin gel slice for each tunnel size. The measurements were repeated a few times along the tunnel length and for different gel tubes. With the same camera settings a picture was taken of a hemocytomer grid. The average measured values of the tunnel diameter obtained using this procedure, were 92 ± 3, 159 ± 6, 410 ± 5 and 800 ± 11 μm (Fig. 2).
Fig. 2.
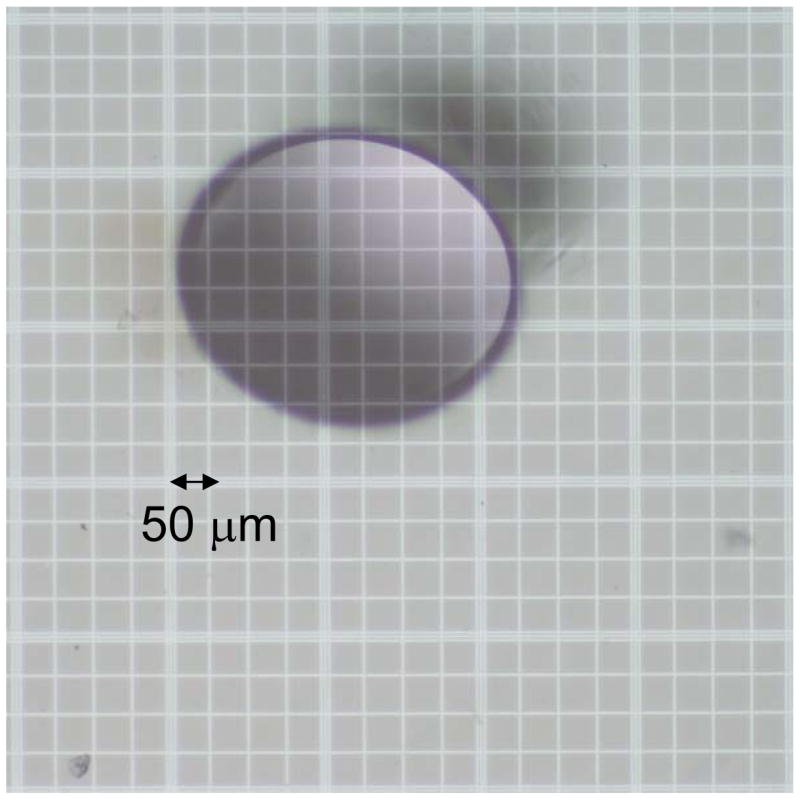
Light microscopy picture of a cross section of the tunnel with a diameter of about 410 μm. The hemocytomter grid is visible on the background.
Experimental setup
An acrylic tank was filled with deionized water and degassed. The apparatus is schematically illustrated in Fig. 3a. The active transducer was driven by a function generator (model 395, Wavetek, San Diego, CA, USA) and a RF amplifier (model 240L, ENI Inc., Rochester, NY, USA). The electrical impedance of the transducer was matched to the output impedance of the amplifier by an in-house manufactured external matching network. The passive transducer of fundamental frequency 1 MHz was connected to a spectrum analyzer (Hewlett Packard 8590A, Palo Alto, CA, USA), which captured and analyzed the acoustic signal. An acrylic tray was built to position the gel tube at the focal spot of both transducers. The tray consisted of two separated acrylic holders. Each holder was supporting a polystyrene tube segment of diameter 10 mm and length 60 mm. The ends of the gel tube (about 15 mm) were inserted between the two polystyrene tube segments just before the insonation such that the center of the gel was exposed to the water at the focal spot of the two ultrasound transducers (Fig. 3b). Before placing the gel tube in the holder the tunnel was filled with ultrasound contrast agent. The ultrasound contrast agent used was Optison™ (GE Healthcare, Milwaukee, WI, USA). This agent consists of preformed bubbles which have a human serum albumin shell and are filled with a perflurocarbon gas, Perflutren. According to the manufacturer, Optison has a concentration between 5 and 8 × 10⁸ microbubbles/mL. Approximately 93% of the microbubble diameters are less than 10 μm, with a maximum diameter of 32 μm and a mean diameter in the range 2–4.5 μm. Shortly before each ultrasound exposure, Optison™ contrast agent was mixed with deionized water and a small amount of green dye (about 3%). The dye was employed as a quick way to visualize a successful injection and presence of any trapped large bubbles into the tunnels. Different concentrations of Optison were used in the experiments, as described below. A micro-injector system was constructed to administer the UCA solution inside the tunnels in gel. Just before each experiment, the syringe in the micro-injector was filled with a diluted solution of UCA and the tube with the gel was placed horizontally on a tray for injection. The tip of the syringe in the micro-injector was positioned at the hole of the silica tube and then driven inside the gel using the linear translational stage. After the syringe tip was inside the gel, the silica tube was removed and the diluted solution of UCA was injected into the tunnels. Then the gel was gently removed from the polystyrene tube segment and placed in the holder in the insonation tank.
Fig 3.

(a) Side-view schematic diagram of experimental setup for the measurement of the collapse threshold of microbubbles in gel tunnels. Microbubbles were injected into the tunnel before the insonation. Two transducers were used and placed in the water tank: one generates the ultrasound waves and the other one listens to the acoustic emission. (b) Picture of the tray with the gel tube inserted between the two polystyrene tube segments.
Insonations
Both the active and the passive transducers were placed so that they focused at the center of the tunnel in gel. During the experiments 500 ms ultrasound bursts were delivered by the active transducer into the tunnel in the gel. During this insonation the emitted ultrasound was detected by the passive transducer and stored and analyzed by the spectrum analyzer.
In order to establish the effect of the vessel diameter and bubble concentration on the threshold for IC, a set of experiments was performed as follows. Prior to the day of the experiment at least ten gel tubes were prepared for each tunnel size. The gel tubes were stored underwater and refrigerated overnight and brought back to room temperature before the experiments. A solution of Optison diluted in deionized water was prepared just before the insonations. Each diluted solution was only used for four insonations at the time in order to avoid possible deterioration of the microbubbles due to the sensitivity of Optison to its environment and to the manner in which it was handled. The order in which the insonations were performed on the tunnels of different diameters was chosen randomly. The water in the tank was degassed every four set of measurements to avoid the risk of cavitation in the water tank. The measurements were repeated until all the prepared gel tubes were used. In addition, a set of control experiments was performed exactly in the same way as described above for the experiments using microbubbles, except that in this case no Optison was mixed with the water injected into the gel tube. The control number of insonations for each tunnel was seven.
For each ultrasound exposure a programmed pulse of length 500 ms was manually triggered. The voltage (acoustic pressure) transmitted by the active transducer was increased in steps of 10 mV each second until broadband noise emission was detected on the spectrum analyzer. Wideband noise emission was detected as a broad peak in the frequency spectrum centred at the resonance frequency of the detector 1 MHz in the range between 0.85 MHz and 1.15 MHz. We chose to measure IC cavity around the resonance frequency of the detector because of the better sensitivity to the noise spectrum in this region. Moreover, owing to the finite width of the fundamental and harmonic components of the signal, detection of wideband noise emission is more effective between the harmonic components. Although the presence of broadband noise emission was obvious in the spectrum, the threshold for IC was defined as the pressure amplitude value that caused a sudden increase in the wideband noise emission of at least 20 dB above the background. A typical spectrum with and without inertial cavitation present is illustrated in Fig. 4.
Fig 4.

Frequency spectrum without (---------) and with broadband acoustic emission present (…). The microbubbles were sonicated with a central frequency of 1.736 MHz. Broadband noise emission is not only visible around the third harmonic (1.736 MHz), but also around the fifth harmonic (about 3 MHz) of the transducer. A 1 MHz transducer received the signal passively.
Results
We have determined the threshold for IC as a function of the tunnel diameter for two different concentrations of Optison, 1.2% and 0.2% (volume/volume). A dosage of 0.5–5 ml is in the range recommended by the manufacturer for human use in diagnostic applications. This quantity mixed with 5 L of blood throughout the body yields a dilution of 10−4 – 10−3 and mixed with 0.5 L of blood in the heart gives a dilution of 10−3 –10−2. Therefore the concentrations of Optison used in our experiments are within or slightly above the range normally employed in diagnostic ultrasound.
Fig 5 shows the results of our experiments for the IC threshold as a function of the tunnel diameter for the two different Optison concentrations used in the experiments. The gel tubes were sonicated in the central location and their length was 60 mm. The squares are the average ± standard error for the IC threshold at 1.2 % Optison concentration. For each tunnel diameter, the data represent the average of at least 12 experiments. The IC threshold for the 0.2 % concentration as a function of the tunnel diameter is given by the circles in Fig. 5. The data represent the average ± standard error of the mean for at least 8 experiments for each tunnel diameter. As may be seen in Fig. 5, it appears that the IC threshold is affected by the tube diameter, for both concentration used in this study. It also appears to be higher on average for the smaller tunnels than the largest ones.
Fig. 5.
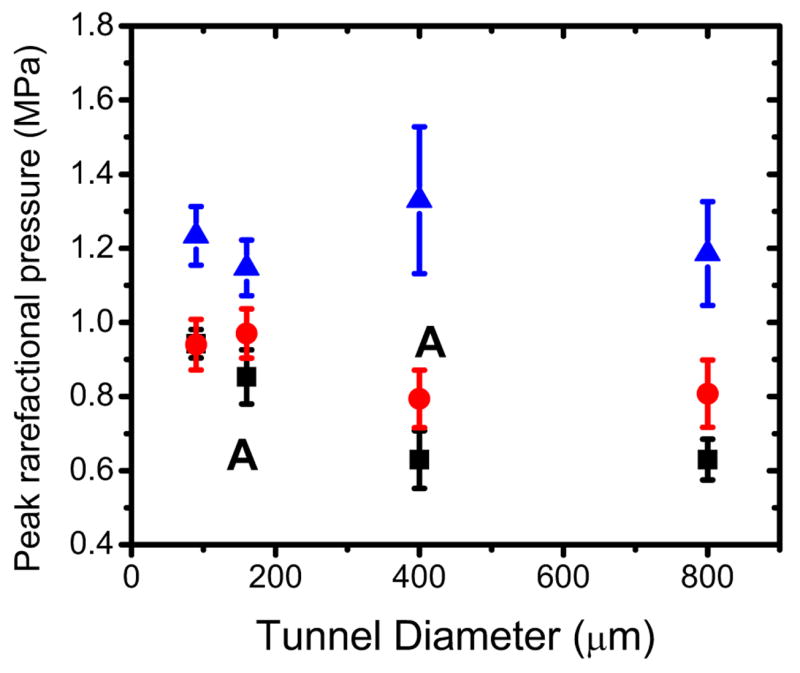
IC threshold for broadband noise emission as a function of the tunnel diameter for 1.2% Optison concentration (squared dots) and the 0.2 % concentration (circle dots). The tunnels were insonated in the center location. Control data are shown also in the figure (triangle dots). The letter A indicates about the same amount of bubbles in the volume V.
Control experiments were also performed for each tunnel diameter and the results are given by the triangles in Fig. 5. They represent the average ± standard error for at least 7 experiments for each tunnel diameter. The tunnels were injected with a solution of deionized water and green dye (3%). A one tail t-test was used to compare the data. The pressure values at which broadband acoustic emission were observed on the spectrum analyzer were significantly higher (P < 0.05) than the corresponding ones when UCA was present.
Discussion and summary
Contrast agents like Optison are stabilized microbubbles that can nucleate IC. One of the signatures of IC is broadband noise emission that takes place above a given peak rarefactional pressure amplitude. Our findings are consistent with the hypothesis that the IC threshold as determined by broadband noise emission is affected by the tunnel diameter with an increase in the smaller tunnels. These results can be interpreted as follows.
The inertia of a spherical bubble oscillating in an infinite body of liquid is finite and given by (Leighton et al., 1998), where ρ is the liquid density and R0 is the bubble equilibrium radius. In such a situation, the fluid velocity falls off as a square law with distance from the bubble. This fall-off gives to the bubble a finite inertia, because the liquid velocity is very small at large distances from the bubble. For a radius R0 of the order of 10−6 m in water the free bubble inertia is m0 ≈ 10−14 kg. In contrast, the inertia m of a bubble that fills a cross section of a tube (one-dimensional bubble) increases linearly with the tube length. In linear approximation m = ρAL (Leighton et al. 1995a; 1995b), where A is the cross-section of the tube and L is the length of the liquid in the tube. This approximation holds for an inviscid liquid in a rigid tube, ignoring end-effects at the end of the tube. An interesting consequence of this result is that in blood capillaries, where contrast-agent microbubbles can easily fill the vessel-cross section, their inertia would be therefore very large and their oscillations will be therefore significantly hindered.
Table 1 gives the values of m for the different tunnel diameters and length L = 0.06 m. Therefore m is much larger than m0. In general, one should expect that the larger the bubble size is with respect to the tube diameter, the greater the degree to which the inertia will depart from the free value m0. As the bubble grows to fill the tube cross-section, its inertia will increase from a value close to m0 to a value approaching m in a continuous rate, although not linearly (Leighton et al. 1998; 2000). Leighton and associates modeled a situation in which the fluid velocity falls off as an inverse square law close to the bubble, i.e. the free field situation, but tends to a one-dimensional flow when the bubble is large.
Table 1.
Inertial mass m and volume V for the different diameter tunnels.
| Diameter (μm) | m = ρπr2L (kg) | V = πr22wx (mL) |
|---|---|---|
| 90 | 4 × 10⁻⁷ | 8 × 10⁻⁶ |
| 160 | 1 × 10⁻⁶ | 2.4 × 10⁻⁵ |
| 400 | 8 × 10⁻⁶ | 1.5 × 10⁻⁴ |
| 800 | 3 × 10⁻⁵ | 6 × 10⁻⁴ |
This is the case of interest in our paper. Their formulation for example allows to estimate when the inertia of the liquid component which is constrained by the tunnel becomes comparable with the ‘free space’ inertia close to bubble. That takes place when the bubble radius (Eq. 9 of Leighton at al. 1998) is
| (1) |
where r is the tunnel radius. For the largest tunnel r is about 400 μm and therefore the inertia of the liquid in the entire length of the tube will dominate the bubble dynamics when the bubble radius exceeds 2.6 μm. Hence throughout their growth most of the microbubble contrast agents will have their inertial dynamics influenced by the presence of the tunnel even in the largest tunnel. Furthermore, they derived an expression for the Rayleigh collapse of a conical bubble
| (2) |
G is a geometric factor, which is model dependent and is not relevant to this study. pL is the pressure in the liquid at the bubble wall. In the numerator the term (r/R)4 arises from the inverse square law for the fluid flow valid near the bubble and is the work done by the pressure to compress (expand) the bubble radius from Ri to R. In the denominator the first term represents the inertia of the liquid close to the bubble and the second, that of the liquid in the tube. Li is the initial length of the liquid column when the bubble radius is Ri. As the collapse proceeds, the denominator of Eq. (2) tells us that the inertia associated with the liquid in the tube decreases and the free-field inertia becomes increasingly important.
In our experiments most of the microbubbles have initial diameters of less than 10 μm. For those microbubbles in the smallest tunnels which undergo IC and therefore grow to maximum diameters which greatly exceed their equilibrium values, the size of the tunnel could easily affect their growth and subsequent collapse. As the bubble grows its inertia increases and it reaches its largest value in the smallest tunnel. Increasing inertia slows down the growth and therefore more pressure needs to be applied in order to increase the expansion.
Previous investigations of the bubble dynamics in different diameter tubes can also be easily understood in terms of the bubble-inertia changes owing to the presence of the tube.
In a previous investigation, Sassaroli and Hynynen (2006) evaluated the IC threshold in micrometer size silica and polyester tubes. The IC threshold was investigated as a function of the tube internal diameter with ID ranging from about 50 to 750 μm for different values of the UCA concentration (6% and 45%), tube length L (L = 25, 40, 80 mm) and insonation location. This threshold was found to be affected by the tube size with an increase for the smaller diameters. In order to explain the trends seen in these experiments, i.e. a dependence of the IC threshold on the tube diameter, the bubble was modelled as a damped harmonic oscillator with the free damping coefficient and resonance frequency corrected for the presence of the tube. This linear model predicts that more pressure is required to expand the bubble radius from R0 to 2R0 in the smaller tubes than in the larger ones. This is because the resonance frequency and damping coefficient decrease as a result of an increase of the bubble inertia in the smaller tubes.
The bubble dynamics in silicone tubes (ID = 305, 508, 1000, 1500 μm) and cellulose hollow fibers (ID = 200 μm) was investigated experimentally in the context of shock-wave-lithotripsy (SWL) by Zhong et al. (2001) who employed high-speed imaging and passive detection techniques. They observed that, in contrast to the large expansion and violent collapse of SWL-induced bubbles in a free field, the expansion of the bubbles inside the tubes was significantly constrained. The severity of the constraint was found to be dependent on the vessel diameter, and increasing dramatically when the ID of the tube was less than 300 μm. In the smallest tube (200 μm) the intra-luminal expansion was found to cause a significant dilation of the phantom wall, leading to consistent rupture of the hollow fiber after less than 20 pulses of shock wave expansion. These facts correlate with their measurements of the bubble collapse time tcoll, which represents the duration of the primary bubble expansion and collapse. The free-field collapse time was observed to increase with the lithotripter output voltage. In the tubes however, tcoll was reduced with respect to the free value, and the degree of reduction was dependent on the vessel diameter. In the large silicone tubes (ID = 1000 and 1500 μm), despite the boundary, the value of tcoll was still observed to increase monotonically with the applied voltage. In the smaller tubes tcoll was further reduced and in the hollow fiber the collapse time of the bubbles was found to be statistically independent of the lithotripter output (see Fig. 7 of Zhong at al. (2001)). The collapse time can be expressed as . In the free situation, tcoll and Rmax increase linearly with the applied voltage (Church, 1989). In the tubes tcoll and Rmax are reduced because the bubble inertia is increased owing to the geometry of the tube. In the hollow fiber the bubble grows to become a one-dimensional bubble and therefore it does not move that much, but it can exercise stresses on the tube wall, which can be ruptured above a given threshold value.
In a more recent paper by Caskey et al. (2006), a high speed camera was used to image microbubble oscillations in rigid tubes with ID of 12, 25, and 195 μm. The bubble was subject to a focused US burst (5 cycles) at a frequency of 1 MHz. Oscillations and fragmentation of a microbubble placed near the edge of the micro-vessel and 100 μm from it were recorded. The study demonstrates that microbubbles in a tube with a diameter on the order of the microbubble diameter expand less than microbubbles in larger tubes and also that the microbubbles fragment more easily when they are closer to the edge of the micro-vessel.
All of the above studies were performed in tubes with diameters comparable (for the largest tubes) or much smaller than the applied ultrasound wavelength. In such a situation it is evident from basic wave theory that scattering of sound from the smaller pipes can be significant. Although the magnitude of the scattering effect was not investigated in the present study, the investigation of bubble dynamics in tunnels embedded in gel rather than in thin-wall tubes provides a novel tool to isolate the effect of vessel diameter from the one of scattering of sound from the tube itself.
Fig. 5 shows the effect of tunnel diameter for two different UCA concentrations, 1.2 % and 0.2 %. Especially for the two largest tunnels it appears that the threshold is somewhat affected by the concentration and it is lower for the higher concentration. This might be caused by the fact that at the higher concentration there are more bubbles having the right size to undergo IC. In the Gaussian approximation, the focal region dimensions can be approximated by wx=wy= 0.87λ f# in the radial direction and wz =6.01 λ (f#)2 in the axial direction of the driving acoustic field (Bigelow and O’Brien, Jr. 2004). The quantities wx, wy, are the equivalent Gaussian dimensions in the radial direction, and wz is the Gaussian dimension in the axial direction. The f-number is defined by f# = F/2a, where F is the focal length and a is aperture radius of a focused spherical transducer. At a frequency of 1.736 MHz (λ = 0.86 mm) and f-number f# = 0.8, wx=wy=0.6 mm and wz =3.3 mm, therefore all the bubbles in the gel tunnel are inside the focal region along the axial direction of the acoustic field, but not along the radial direction. The tunnel volume that is inside the focal region is approximately V=πr22wx where r is the tunnel radius. Table 1 shows the approximate values of V for the four tunnels used in the experiments. By estimating the number of bubbles in a given amount (mL) of Optison, from the known Optison concentration in the vial (5–8 × 10⁸ microbubbles/mL), one can get a crude estimate of the number of bubbles in the volume V. Obviously for the same tunnel size, there are more bubbles in V at the higher concentration than the lower one. However for example, the 160 μm tunnel with a 1.2% Optison concentration has roughly the same amount of bubbles in V (144–233) as the 400 μm tunnel at 0.2% concentration (150–240). As can be seen in Fig. 5 the effect of the vessel size is still significant indicating that the number of bubbles was not the reason for our results.
In summary, microbubble contrast agents are crucial for improving the ultrasound imaging of blood, and they will probably play an important role in the development of ultrasound-mediated drug and gene delivery. In our work we have investigated the threshold for inertial cavitation as a function of tunnel diameter at two different bubble concentrations under focused ultrasound exposure. The threshold, as recorded by broadband acoustic emission, was dependent on the tunnel diameter with an increase for smaller tunnels. These findings will increase our understanding of the interaction between microbubble contrast agents and ultrasound in a situation closer to the in vivo situation. These experimental results will also give useful insights for the development of a satisfactory and tractable model of microbubble oscillations in micrometer-size tunnels.
Acknowledgments
This research was in part supported by the NIH grants U41-RR019703, RO1-EB003268, and R33-EB000705. We thank Sue Agabian for building the setup to make the tunnels in gel. We thank Manabu Kinoshita for helpful discussions and the reviewers for very useful comments.
Footnotes
Publisher's Disclaimer: This is a PDF file of an unedited manuscript that has been accepted for publication. As a service to our customers we are providing this early version of the manuscript. The manuscript will undergo copyediting, typesetting, and review of the resulting proof before it is published in its final citable form. Please note that during the production process errors may be discovered which could affect the content, and all legal disclaimers that apply to the journal pertain.
References
- Allen JS, May DJ, Ferrara KW. Dynamics of therapeutic ultrasound contrast agents. Ultrasound Med Biol. 2002;28:805–816. doi: 10.1016/s0301-5629(02)00522-7. [DOI] [PubMed] [Google Scholar]
- Ammi AY, Cleveland RO, Mamou J, Wang GI, Bridal SL, O’Brien WD., Jr Ultrasonic contrast agent shell rupture detected by inertial cavitation and rebound signals. IEEE Trans Ultrason Ferroelect Freq Control. 2006;53:126–136. doi: 10.1109/tuffc.2006.1588398. [DOI] [PMC free article] [PubMed] [Google Scholar]
- Apfel RE. In: Methods in Experimental Physics. Edmonds PD, editor. Vol. 19. Academic Press; New York: 1981. pp. 355–413. [Google Scholar]
- Bao S, Thrall BD, Miller DL. Transfection of a reporter plasmid into cultured cells by sonoporation in vitro. Ultrasound Med Biol. 1997;23:953–959. doi: 10.1016/s0301-5629(97)00025-2. [DOI] [PubMed] [Google Scholar]
- Bao S, Thrall BD, Gies RA, Miller DL. In vivo transfection of melanoma cells by lithotripter shock waves. Cancer Res. 1998;58:219–221. [PubMed] [Google Scholar]
- Becher H, Burns PN. Handbook of contrast echocardiography. Berlin: Springer Verlag; 2000. [Google Scholar]
- Bigelow TA, O’Brien WD., Jr Scatterer size estimation in pulse-echo ultrasound using focused sources: Theoretical approximation and simulation analysis. J Acoust Soc Am. 2004;116:578–593. doi: 10.1121/1.1757452. [DOI] [PubMed] [Google Scholar]
- Blomley MJ, Cooke JC, Unger EC, Monaghan MJ, Cosgrove DO. Microbubble contrast agents: a new era in ultrasound. BMJ. 2001;322:1222–1225. doi: 10.1136/bmj.322.7296.1222. [DOI] [PMC free article] [PubMed] [Google Scholar]
- Braymann AA, Lizotte LM, Miller MW. Erosion of artificial endothelia in vitro by pulsed ultrasound: Acoustic pressure, frequency, membrane orientation and microbubble contrast agent dependence. Ultrasound Med Biol. 1999;25:1305–1320. doi: 10.1016/s0301-5629(99)00076-9. [DOI] [PubMed] [Google Scholar]
- Burns PN, Powers JE, Hope Simpson D, Uhlendorf V, Fritzsch T. Harmonic imaging: Principles and preliminary results. Angiology. 1996;47:S63–S74. [Google Scholar]
- Caskey CF, Kruse DE, Dayton PA, Kitano TK, Ferrara KW. Microbubble oscillations in tubes with diameters of 12, 25, and 195 microns. Appl Phys Lett. 2006;88:033902. [Google Scholar]
- Chang PP, Chen WS, Mourad PD, Poliachik SL, Crum LA. Thresholds for inertial cavitation in albunex suspensions under pulsed ultrasound conditions. IEEE Trans Ultrason Ferroelect Freq Contr. 2001;48:161–170. doi: 10.1109/58.895927. [DOI] [PubMed] [Google Scholar]
- Chatterjee D, Sasaki T. A newtonian rheological model for the interface of microbubble contrast agents. Ultrasound Med Biol. 2003;29:1749–1757. doi: 10.1016/s0301-5629(03)01051-2. [DOI] [PubMed] [Google Scholar]
- Chen WS, Brayman AA, Matula TJ, Crum LA, Miller MW. The pulse length-dependence of inertial cavitation dose and hemolysis. Ultrasound Med Biol. 2003a;29:739–748. doi: 10.1016/s0301-5629(03)00029-2. [DOI] [PubMed] [Google Scholar]
- Chen WS, Matula TJ, Brayman AA, Crum LA. A comparison of the fragmentation thresholds and inertial cavitation doses of different ultrasound contrast agents. J Acoust Soc Am. 2003b;113:643–651. doi: 10.1121/1.1529667. [DOI] [PubMed] [Google Scholar]
- Chien CT, Burns PN. Investigation of the effects of microbubble shell disruption on population scattering and implications for modeling contrast agent behavior. IEEE Trans Ultrason Ferroelectr Freq Control. 2004;51:286–292. [PubMed] [Google Scholar]
- Chomas JE, Dayton P, Allen J, Morgan K, Ferrara KW. Mechanisms of contrast agent destruction. IEEE Trans Ultrason Ferroelect Freq Control. 2001a;48:232–248. doi: 10.1109/58.896136. [DOI] [PubMed] [Google Scholar]
- Chomas JE, Dayton P, May D, Ferrara K. Threshold of fragmentation for ultrasonic contrast agents. J Biomed Opt. 2001b;6:141–150. doi: 10.1117/1.1352752. [DOI] [PubMed] [Google Scholar]
- Church CC. A theoretical study of cavitation generated by an extracorporeal shock wave lithotripter. J Acoust Soc Am. 1989;86:215–227. doi: 10.1121/1.398328. [DOI] [PubMed] [Google Scholar]
- Church CC. The effects of an elastic solid surface layer on the radial pulsations of gas bubbles. J Acoust Soc Am. 1995;97:1510–1521. [Google Scholar]
- Crum LA, Roy RA, Dinno MA, Church CC, Apfel RE, Holland CK, Madanshetty SI. Acoustic cavitation produced by microsecond pulses of ultrasound: a discussion of some selected results. J Acoust Soc Am. 1992;91:1113–1119. doi: 10.1121/1.402638. [DOI] [PubMed] [Google Scholar]
- Cui J, Hamilton MF, Wilson PS, Zabolotskaya EA. Bubble pulsations between parallel plates. J Acoust Soc Am. 2006;119:2067–2072. doi: 10.1121/1.2172545. [DOI] [PubMed] [Google Scholar]
- Dalecki D, Raeman CH, Child SZ, Penney DP, Mayer R, Carstensen EL. The influence of contrast agents on hemorrhage produced by lithotripter fields. Ultrasound Med Biol. 1997;23:1435–1439. doi: 10.1016/s0301-5629(97)00151-8. [DOI] [PubMed] [Google Scholar]
- de Jong N, Hoff L. Ultrasound scattering properties of Albunex microspheres. Ultrasonics. 1993;31:175–181. doi: 10.1016/0041-624x(93)90004-j. [DOI] [PubMed] [Google Scholar]
- Deng CX, Sieling F, Pan H, Cui J. Ultrasound-induced cell membrane porosity. Ultrasound Med Biol. 2004;30:519–526. doi: 10.1016/j.ultrasmedbio.2004.01.005. [DOI] [PubMed] [Google Scholar]
- Foster FS, Burns PN, Hope SD, Wilson SR, Christopher DA, Goertz DE. Ultrasound for the visualization and quantification of tumor microcirculation. Cancer Metastasis Rev. 2000;19:131–138. doi: 10.1023/a:1026541510549. [DOI] [PubMed] [Google Scholar]
- Giesecke T, Hynynen K. Ultrasound-mediated cavitation thresholds of liquid perfluorocarbon droplets in vitro. Ultrasound Med Biol. 2003;29:1359–1365. doi: 10.1016/s0301-5629(03)00980-3. [DOI] [PubMed] [Google Scholar]
- Greenleaf WJ, Bolander ME, Sarkar G, Goldring MB, Greenleaf JF. Artificial cavitation nuclei significantly enhance acoustically induced cell transfection. Ultrasound Med Biol. 1998;24:587–595. doi: 10.1016/s0301-5629(98)00003-9. [DOI] [PubMed] [Google Scholar]
- Guan J, Matula TJ. Using light scattering to measure the response of individual ultrasound contrast microbubbles subjected to pulsed ultrasound in vitro. J Acoust Soc Am. 2004;116:2832–2848. doi: 10.1121/1.1795334. [DOI] [PubMed] [Google Scholar]
- Guzmán HR, Nguyen DX, Khan S, Prausnitz MR. Ultrasound-mediated disruption of cell membranes. I. Quantification of molecular uptake and cell viability. J Acoust Soc Am. 2001a;110:588–596. doi: 10.1121/1.1376131. [DOI] [PubMed] [Google Scholar]
- Guzmán HR, Nguyen DX, Sohail K, Prausnitz MR. Ultrasound-mediated disruption of cell membranes II: Heterogeneous effects on cells. J Acoust Soc Am. 2001b;110:597–606. doi: 10.1121/1.1376130. [DOI] [PubMed] [Google Scholar]
- Hill CR. Calibration of ultrasonic beams for medical applications. Phys Med Biol. 1970;15:241–248. doi: 10.1088/0031-9155/15/2/001. [DOI] [PubMed] [Google Scholar]
- Hoff L, Sontum PC, Hovem JM. Oscillations of polymeric microbubbles: effect of the encapsulating shell. J Acoust Soc Am. 2000;107:2272–2280. doi: 10.1121/1.428557. [DOI] [PubMed] [Google Scholar]
- Holland CK, Apfel RE. Thresholdd for transient cavitation produced by pulsed ultrasound in a controlled nuclei enviromement. J Acoust Soc Am. 1990;88:2059–2069. doi: 10.1121/1.400102. [DOI] [PubMed] [Google Scholar]
- Hope Simpson D, Chin CT, Burns PN. Pulse inversion Doppler: a new method for detecting nonlinear echoes from microbubble contast agents. IEEE Trans UFFC. 1999;46:372–382. doi: 10.1109/58.753026. [DOI] [PubMed] [Google Scholar]
- Hu YT, Qin SP, Hu T, Ferrara KW. Asymmetric oscillation of cavitation bubbles in a microvessel and its implications upon mechanisms of clinical vessel injury in shock-wave lithotripsy. Int J Non-Linear Mech. 2005;40:341–350. [Google Scholar]
- Hynynen K, McDannold N, Vykhodtseva N, Jolesz FA. Noninvasive MR imaging-guided focal opening of the blood-brain barrier in rabbits. Radiology. 2001;220:640–646. doi: 10.1148/radiol.2202001804. [DOI] [PubMed] [Google Scholar]
- Khismatullin DB, Nadim A. Radial oscillations of encapsulated microbubbles in viscoelastic liquids. Phys Fluids. 2002;14:3534–3557. [Google Scholar]
- Kinoshita M, Hynynen K. A novel method for the intracellular delivery of siRNA using microbubble-enhanced focused ultrasound. Biochem Biophys Res Commun. 2005;335:393–399. doi: 10.1016/j.bbrc.2005.07.101. [DOI] [PubMed] [Google Scholar]
- Leighton TG. The Acoustic Bubble. New York: Academic Press; 1994. [Google Scholar]
- Leighton TG, White PR, Marsden MA. The one-dimensional bubble: An unusual oscillator, with applications to human bioeffects of underwater sound. Eur J Phys. 1995a;16:275–281. [Google Scholar]
- Leighton TG, White PR, Marsden MA. Applications of one-dimensional bubbles to lithotripsy, and to diver response to low frequency sound. Acta Acoustica. 1995b;3:517–529. [Google Scholar]
- Leighton TG, Phelps AD, Cox BT, Ho WL. Theory and preliminary measurements of the Rayleigh-like collapse of a conical bubble. Acta Acoustica. 1998;84:801–814. [Google Scholar]
- Leighton TG, Cox BT, Phelps AD. The Rayleigh-like collapse of a conical bubble. J Acoust Soc Am. 2000;107:130–142. doi: 10.1121/1.428296. [DOI] [PubMed] [Google Scholar]
- Lindner JR, Song J, Xu F, Klibanov AL, Singbartl K. Noninvasive ultrasound imaging of inflammation using microbubbles targeted to activated leukocytes. Circulation. 2000;102:2745–2750. doi: 10.1161/01.cir.102.22.2745. [DOI] [PubMed] [Google Scholar]
- Lo AH, Kripfgans OD, Carson PL, Fowlkes JB. Spatial control of gas bubbles and their effects on acoustic fields. Ultrasound Med Biol. 2006;32:95–105. doi: 10.1016/j.ultrasmedbio.2005.09.009. [DOI] [PubMed] [Google Scholar]
- Lord Rayleigh. On the pressure developed in a liquid during the collapse of a spherical cavity. Phil Mag. 1917;34:94–98. [Google Scholar]
- Lu QL, Liang HD, Partridge T, Blomley MJ. Microbubble ultrasound improves the efficiency of gene transduction in skeletal muscle in vivo with reduced tissue damage. Gene Ther. 2003;10:396–405. doi: 10.1038/sj.gt.3301913. [DOI] [PubMed] [Google Scholar]
- Luo H, Birnbaum Y, Fishbein MC, Peterson TM, Nagai T, Nishioka T, Siegel RJ. Enhancement of thrombolysis in vivo without skin and soft tissue damage by transcutaneous ultrasound. Thromb Res. 1998;89:171–177. doi: 10.1016/s0049-3848(98)00002-4. [DOI] [PubMed] [Google Scholar]
- Marsh JN, Hughes MS, Brandenburger GH, Miller JG. Broadband measurement of the scattering-to-attenuation ratio for Albunex at 37 degrees C. Ultrasound Med Biol. 1999;25:1321–1324. doi: 10.1016/s0301-5629(99)00077-0. [DOI] [PubMed] [Google Scholar]
- May DJ, Allen JS, Ferrara KW. Dynamics and fragmentation of thick-shelled microbubbles. IEEE Trans Ultrason Ferroelectr Freq Control. 2002;49:1400–1410. doi: 10.1109/tuffc.2002.1041081. [DOI] [PubMed] [Google Scholar]
- Miller DL. A cylindrical-bubble model for the response of plant-tissue bodies to ultrasound. J Acoust Soc Am. 1979;65:1313–1321. [Google Scholar]
- Miller DL. Gas body activation. Ultrasonics. 1984;22:261–269. doi: 10.1016/0041-624x(84)90042-8. [DOI] [PubMed] [Google Scholar]
- Miller DL. Frequency relationships for ultrasonic activation of free microbubbles, encapsulated microbubbles, and gas-filled micropores. J Acoust Soc Am. 1998;104:2498–2505. doi: 10.1121/1.423755. [DOI] [PubMed] [Google Scholar]
- Ory E, Yuan H, Prosperetti A, Popinet S, Zaleski S. Growth and collapse of a vapor bubble in a narrow tube. Phys Fluids. 2000;12:1268–1277. [Google Scholar]
- Porter TR, Kricsfeld D, Lof J, Everbach EC, Xie F. Effectiveness of transcranial and transthoracic ultrasound and microbubbles in dissolving intravascular thrombi. J Ultrasound Med. 2001;20:1313–1325. doi: 10.7863/jum.2001.20.12.1313. [DOI] [PubMed] [Google Scholar]
- Price RJ, Skyba DM, Kaul S, Skalak TC. Delivery of colloidal particles and red blood cells to tissue through microvessel ruptures created by targeted microbubble destruction with ultrasound. Circulation. 1998;98:1264–1267. doi: 10.1161/01.cir.98.13.1264. [DOI] [PubMed] [Google Scholar]
- Qin S, Ferrara KW. Acoustic response of compliable microvessels containing ultrasound contrast agents. Phys Med Biol. 2006;27:5065–5088. doi: 10.1088/0031-9155/51/20/001. [DOI] [PMC free article] [PubMed] [Google Scholar]
- Sassaroli E, Hynynen K. Forced linear oscillations of microbubbles in blood capillaries. J Acoust Soc Am. 2004;115:3235–3243. doi: 10.1121/1.1738456. [DOI] [PubMed] [Google Scholar]
- Sassaroli E, Hynynen K. Resonance frequency of microbubbles in small blood vessels: a numerical study Resonance frequency of microbubbles in small blood vessels: a numerical study. Phys Med Biol. 2005;50:5293–5305. doi: 10.1088/0031-9155/50/22/006. [DOI] [PubMed] [Google Scholar]
- Sassaroli E, Hynynen K. On the impact of vessel size on the threshold for bubble collapse. Appl Phys Lett. 2006;89:123901. [Google Scholar]
- Shi WT, Forsberg F, Tornes A, Ostensen J, Goldberg BB. Destruction of contrast microbubbles and the association with inertial cavitation. Ultrasound Med Biol. 2000;26:1009–1019. doi: 10.1016/s0301-5629(00)00223-4. [DOI] [PubMed] [Google Scholar]
- Tachibana K, Tachibana S. Albumin microbubble echo-contrast material as an enhancer for ultrasound accelerated thrombolysis. Circulation. 1995;92:1148–1150. doi: 10.1161/01.cir.92.5.1148. [DOI] [PubMed] [Google Scholar]
- Takeuchi M, Ogunyankin K, Pandian NG, McCreery TP, Sweitzer RH, Caldwell VE, Unger EC, Avelar E, Sheahan M, Connolly R. Enhanced visualization of intravascular and left atrial appendage thrombus with the use of a thrombus-targeting ultrasonographic contrast agent (MRX-408A1): In vivo experimental echocardiographic studies. J Am Soc Echocardiogr. 1999;12:1015–1021. doi: 10.1016/s0894-7317(99)70096-9. [DOI] [PubMed] [Google Scholar]
- Unger EC, Matsunaga TO, McCreery T, Schumann P, Sweitzer R, Quigley R. Therapeutic applications of microbubbles. Eur J Radiol. 2002;42:160–168. doi: 10.1016/s0720-048x(01)00455-7. [DOI] [PubMed] [Google Scholar]
- Ward M, Wu J, Chiu JF. Experimental study of the effects of Optison concentration on sonoporation in vitro. Ultrasound Med Biol. 2000;26:1169–1175. doi: 10.1016/s0301-5629(00)00260-x. [DOI] [PubMed] [Google Scholar]
- Wei K, Jayaweera AR, Firoozan S, Linka A, Skyba DM, Kaul S. Quantification of mycardial blood flow with ultrasound-induced destruction of microbubbles administrated as a constant nevous infusion. Circulation. 1998;97:473–483. doi: 10.1161/01.cir.97.5.473. [DOI] [PubMed] [Google Scholar]
- Zhong P, Zhou Y, Zhu S. Dynamics of bubble oscillation in constrained media and mechanisms of vessel rupture in SWL. Ultrasound Med Biol. 2001;27:119–134. doi: 10.1016/s0301-5629(00)00322-7. [DOI] [PubMed] [Google Scholar]