

Abstract
Aim
To analyze genetic alterations of p53 gene in Slovenian gastric cancer patients and to compare these alterations with clinicopathological parameters in order to assess the value of p53 as a prognostic factor.
Methods
We analyzed the samples from 230 Slovenian patients with gastric cancer, collected between 1983 and 2001. p53 expression was evaluated immunohistochemically with DO-7 monoclonal antibody. In addition, loss of heterozigosity (LOH) and microsatellite instability (MSI) of p53 gene were evaluated, as well as its mutational status in the selected population of patients.
Results
p53 expression was associated with poorer survival and it was an independent predictor in multivariate analysis, along with TNM (T – size of tumor, N – nodal involvement, M – distant metastasis) stage status. Loss of heterozigosity and microsatellite instability status did not influence survival, however we found association of loss of heterozigosity with Lauren’s (Mantel-Haenszel test, P = .004) and Ming’s (Mantel-Haenszel test, P<.001) classification, whereas microsatellite instability was associated with gender (Mantel-Haenszel test, P = .017), TNM stage (χ2 test, P = .006) of gastric cancer, and lymph node involvement (pN) (χ2 test, P = .004).
Conclusions
The data on p53 abnormalities, when considered separately, could be of relative value for predicting the behavior of gastric tumors. However, our analyses showed that studying p53 overexpression, loss of heterozigosity, microsatellite instability, and mutational analysis could provide data that, particularly in combination with some clinicopathological features, might be of clinical value for predicting the tumor behavior and patient response to therapy.
In the 1980s, stomach cancer was the most frequent type of cancer worldwide and, although its incidence has gradually declined in developed countries, it still remains one of the leading causes of mortality worldwide, with a modest 5-year survival of about 25% (1,2). In general, it is still the one of the leading cause of cancer-related death, surpassed only by lung and breast cancer (3,4).
According to the classification by Lauren (5), stomach cancer is classified into two main histological types: diffuse and intestinal. Particular combinations of genetic and epigenetic changes differ in both subtypes, although a few of them appear to be common, as shown by several studies in the last decade (6-8). Namely, a significant proportion of intestinal type carcinomas progress to diffuse types, and in individuals a large number of tumors could also be comprised of a mixture of both cellular subtypes (9,10). In addition to hypermethylation of several genes and loss of heterozigosity, abnormalities of p53 tumor suppressor gene are the most evident genetic changes found in both types of gastric cancer, which is in accordance with generally accepted opinion that genetic changes of p53 are one of the most prevalent alterations in human cancers (8,10,11). The main mechanisms of inactivation in gastric cancer are loss of heterozigosity, mutations, and frame shift deletions (8,9). These abnormalities occur in 46.6 to 74% of gastric cancers, regardless of the histological subtype. They are also frequently observed in pre-cancerous lesions such as intestinal metaplasia and dysplasia, which are precursors of the intestinal type of gastric cancer (9,12).
Most mutations of p53 gene or genetic and/or epigenetic changes of upstream and/or downstream located genes in the p53 network result in a loss of function of the wild-type gene product. However, most but not all mutant p53 proteins have a prolonged half-life and accumulate in cells (13,14). Both p53 accumulation and its absence in the nucleus of malignant cells could thus be used as a valuable prognostic marker and predictor of clinical outcome of gastric tumors. Namely, several studies have shown the association of p53 mutations with particular histological type of gastric cancer, age of the patients at the onset of malignancies, and poor response to the treatment (9,14-16).
In the present study, we studied a series of 230 gastric carcinomas, collected in a period from 1983 to 2001. We wanted to combine molecular genetic analysis data on p53, such as expression, loss of heterozygosity (LOH), microsatellite instability (MSI), and mutational status with tumor descriptive characteristics in order to discern the value of p53 as a molecular marker for diagnosis and/or prognosis in this type of cancer. We showed that at least one of the selected clinical or histopathological features might be associated with genetic variables such as p53 expression, loss of heterozigosity, or microsatellite instability, and could thus in combination improve the determination of biological feature and/or prognosis of gastric malignancy.
Patients and methods
Patients and samples
We examined 230 primary advanced gastric cancers surgically resected at the Department of Abdominal Surgery in Ljubljana from 1983-2001. All patients underwent R0 resection (12). One hundred samples, collected from 1983 to 1992, were formalin-fixed and paraffin-embedded. From 130 samples collected between 1997 and 2001, portions of tumor tissues and adjacent non-tumor mucosa were carefully sampled and frozen at -70°C for DNA extraction. In addition, their representative portions were again formalin-fixed and paraffin-embedded for immunohistochemistry and histology. Histological evaluation of all samples was confirmed at the Institute of Oncology in Ljubljana. The study was approved by the National Medical Ethics Committee and informed consent was obtained from all participating patients before surgery.
Most gastric cancer patients were male, with 1.8:1 male-to-female ratio (Table 1). Mean age ± standard deviation (SD) at the operation was 61.9 ± 11.3 years. Tumor stage was assessed in accordance with the TNM classification system (T – size of tumor, N – nodal involvement, M – distant metastasis), and histological appearances were categorized according to the classifications of Lauren, Ming, and Borrmann (5,12,17,18). Cases lost to follow-up (n = 4) and those who died within 30 days after surgery (n = 5), were excluded from survival analyses.
Table 1.
Clinicopathological features of 230 patients with gastric cancer
| Parameter | No. (%) |
|---|---|
| Age (years, mean ± standard deviation) | 61.9 ± 11.3 |
| Gender (n = 230): | |
| male | 147 (63.7) |
| female | 83 (36.1) |
| Lauren’s classification, ref. 5 (n = 230): | |
| intestinal | 126 (54.8) |
| diffuse | 74 (32.2) |
| mixed | 30 (13.0) |
| Borrmann’s classification, ref. 17 (n = 228): | |
| type 1 | 27 (11.7) |
| type 2 | 58 (25.4) |
| type 3 | 123 (53.9) |
| type 4 | 20 (8.8) |
| Ming’s classification, ref. 18 (n = 229): | |
| expansive | 86 (37.6) |
| infiltrative | 106 (46.3) |
| mixed | 37 (16.2) |
| TNM classification, ref. 12 (n = 230): | |
| I | 49 (21.3) |
| II | 68 (29.6) |
| III | 77 (33.5) |
| IV | 36 (15.7) |
| Tumor location: | |
| upper | 62 (27.0) |
| middle | 74 (32.2) |
| lower | 80 (34.8) |
| whole | 14 (6.1) |
DNA extraction
DNA was isolated from 100 paraffin sections as described previously (19). Briefly, the paraffin-embedded sections were microdissected and dewaxed with xylol and ethanol. DNA was obtained from these tissues using the proteinase K-lysis buffer after 24 hours of incubation at 55°C. DNA from 130 freshly frozen tissue samples, which was kept at -70°C, was isolated following the standard phenol/chloroform protocol. Briefly, tissues were incubated overnight at 50°C in SDS-proteinase K lytic solution. Afterwards, the DNA was extracted with phenol-chloroform and precipitated with ethanol. DNA concentration was measured spectrophotometrically and agarose gel electrophoresis was used to confirm DNA concentration and integrity.
Analysis of loss of heterozigosity and microsatellite instability
Microsatellite loci were examined for loss of heterozigosity using the p53 locus microsatellite markers p53-1 and p53-2 (20). The loss of heterozigosity index was calculated for each paired normal and tumor samples using the method described by Cawkwell et al (20). In brief, the tumor ratio was divided by the normal ratio, that is, T1:T2/N1:N2, where T1 and N1 are the peak height of the tumor and the peak height of normal samples for the corresponding allele 1, and T2 and N2 are the peak height of the tumor and the peak height normal samples for the corresponding allele 2. The tumors were considered to have the loss of heterozigosity if the allele peak ratio was ≤0.5 or ≥1.5. Tumor samples that exhibited novel allele peaks compared with the corresponding normal samples were classified as having microsatellite instability at that marker and were considered uninformative for the loss of heterozigosity study. Cases with detectable heterozygous alleles and without microsatellite instability were defined as informative for loss of heterozigosity analysis.
Fluorescence PCR was performed with 1µl genomic DNA (25-50 ng), 0.5 µl forward and reverse primers (20) for each locus (12.5µM), 5 µl dNTPs (2mM), 1.5 µl MgCl2 (25mM), 2.5 µl 10 × reaction buffer (Gold PCR Buffer, Applied Biosystems, Foster City, CA, USA) and 0.5 µl of AmpliTaq DNA–polymerase Gold (Applied Biosystems) in the final volume of 25 µl. Forward primer was 5′ end-labeled with the 6-FAM fluorescent dye (Applied Biosystems). Twenty-two cycles of 95°C for 30 seconds, 55°C for 1 minute, and 72°C for 30 seconds were performed with an initial denaturation step at 95°C for 12 minutes and final extension step at 72°C for 10 minutes for both fragments. The reactions were carried out in a GeneAmp PCR System 9600 Thermal Cycler (Applied Biosystems). The amplified, fluorescently tagged products were then diluted with deionized formamide, and 0.5 µl of internal standard TAMRA 500 (Applied Biosystems) was added to each solution. The mixture was then denatured for 3 minutes at 95°C, followed by ice cooling. Finally, the products were separated on ABI Prism 310 Genetic Analyzer (Applied Biosystems) by capillary electrophoresis and results were evaluated with Genescan analysis software (Applied Biosystems).
Mutation analysis of p53
According to Soussi and Beroud (21), the majority of p53 mutations were located in the exons 4 and 10. Therefore, p53 mutational analysis was carried out on 28 randomly selected samples, equally subgrouped in accordance with their loss of heterozigosity (LOH) and microsatellite instability status. It was performed by means of automated direct sequencing on AbiPrism 310 (Applied Biosystems) within the exons 4-10 as described previously (22). Briefly, prior to sequencing, the PCR products were purified with the QIAQuick columns (QIAGEN QIAQuick PCR Purification Kit). Afterwards, the Ready Dye Terminator Cycle Sequencing Kit (Applied Biosystems) was used according to manufacturer’s instructions. The sequences of primers were selected according to Chang et al (23). Samples were grouped into four groups according to their microsatellite instability/loss of heterozigosity status: microsatellite instability; loss of heterozigosity-high (LOH-H) – with loss of heterozigosity at both p53 loci; loss of heterozigosity-low (LOH-L) – with loss of heterozigosity at only one locus; and no loss of heterozigosity (no-LOH).
Immunohistochemistry
Paraffin-embedded tumor and non-tumor tissue sections from all 230 patients were immuno-stained with a monoclonal mouse antibody DO-7 (DAKO, Carpinteria, CA, USA) against p53 at a working concentration of 1:500. This antibody reacts with both wild-type and mutant forms of the p53 protein. Tissue sections were deparaffinized and hydrated through a graded series of alcohols. The immunohistochemistry was performed using an automated staining device TechMate 500 (DAKO Corp., Glostrup, Denmark) after an antigen retrieval process with microwave treatment (15-minute, 850 W). Following the completed automated staining procedure with labeled streptavidin-biotin system method using peroxidase/DAB (3,3′-diaminobenzidine tetrahydrochloride) as the reaction indicator (DAKO ChemMate K5001), the nuclear counterstaining was accomplished with light hematoxylin. Positive and negative controls were included with each staining series. Negative controls were obtained by omission of the primary antibody. A set of breast cancers with high levels of p53 was used as positive control. Two independent pathologists assessed the results of immunohistochemical staining. For statistical analysis, the results were considered to be positive for p53 (p53+), if 25% or more of the nuclei of neoplastic cells were stained.
Statistical analysis
The distribution of each clinicopathological and genetic variable was calculated by the χ2 test. Statistical significance was defined as P<.05. Survival was assessed by the Kaplan-Meier method and differences between groups were evaluated using the log-rank test. Multivariate survival analyses were further performed using the Cox proportional-hazards regression model. In the Cox multivariate analyses, forward stepwise procedure was used to determine the predictor variables. Only the variables that resulted in P values <0.05 in the Kaplan-Meier test were entered into the Cox proportional hazard model for the determination of independent prognostic factors for gastric cancer. The postoperative period was measured from the date of surgery to the date of the last follow-up or death.
Results
Microsatellite instability and loss of heterozigosity evaluation
Microsatellite instability status was determined for 173 patients out of 230 included in this study. Fifty-seven cases were excluded due to inappropriate quality of DNA. Microsatellite instability at the examined loci was assessed separately with relevance to selected clinicopathological variables (Table 2). Seventeen (9.8%) patients had microsatellite instability at either p53-1 or p53-2 locus and 156 (90.2) had no microsatellite instability. The majority of microsatellite instability was found at locus p53-1, while only three incidences were found at p53-2, with two of them occurring simultaneously with microsatellite instability at p53-1. Microsatellite instability groups showed clear association with gender, TNM stage, and pN. Higher percentage of microsatellite instability was associated with TNM stages I and II (Table 2).
Table 2.
Statistical comparison between clinicopathological features and microsatellite instability in Slovenian patients with gastric cancer*
| Clinicopathological characteristics | Total | No MSI | MSI | P |
|---|---|---|---|---|
| Total | 156 | 17 | ||
| Gender: | ||||
| male | 109 | 103 | 6 | 0.017† |
| female | 64 | 53 | 11 | |
| Borrmann’s classification (ref. 17): | ||||
| I | 22 | 19 | 3 | 0.058‡ |
| II | 41 | 33 | 8 | |
| III | 96 | 90 | 6 | |
| IV | 13 | 13 | 0 | |
| Lauren’s classification (ref. 5): | ||||
| intestinal | 99 | 88 | 11 | 0.505† |
| diffuse | 58 | 52 | 6 | |
| mixed | 16 | 16 | 0 | |
| Ming’s classification (ref. 18): | ||||
| expansive | 76 | 64 | 12 | 0.052‡ |
| infiltrative | 80 | 75 | 5 | |
| mixed | 16 | 16 | 0 | |
| TNM classification (ref. 12): | ||||
| I | 42 | 34 | 8 | 0.006§ |
| II | 55 | 49 | 6 | |
| III | 52 | 49 | 3 | |
| IV | 24 | 24 | 0 | |
| pT: | ||||
| T1 | 4 | 2 | 2 | 0.100§ |
| T2 | 80 | 72 | 8 | |
| T3 | 84 | 77 | 7 | |
| T4 | 5 | 5 | 0 | |
| pN: | ||||
| N0 | 70 | 58 | 12 | 0.004§ |
| N1 | 62 | 57 | 5 | |
| N2 | 26 | 26 | 0 | |
| N3 | 15 | 15 | 0 | |
| pM: | ||||
| M0 | 162 | 145 | 17 | 0.604† |
| M1 | 11 | 11 | 0 |
*Abbreviations: pT – size of the tumor; pN – involvement of lymph nodes; pM – distant metastasis.
†Fisher exact test.
‡χ2 test.
§Mantel-Haenszel test.
The loss of heterozigosity analysis was performed for 170 samples out of 230 patients who underwent total gastrectomy, while the remaining 60 cases were excluded due to inappropriate quality of DNA. Markers with detectable heterozygous alleles were defined as informative, so 115 and 98 informative individuals, with loss of heterozigosity at p53-1 or p53-2 marker, respectively, were included in the analysis (Tables 3 and 4). Twenty-four tumors (20.9%, 24/115) exhibited loss of heterozigosity at p53-1 and 27 (27.6%, 27/98) at p53-2 locus. Only 10 (15.6%, 10/64) individuals had loss of heterozigosity at both loci. There were no differences in the distribution of gender, size of the tumor (pT), pN, presence of distant metastases (pM), Borrmann’s classification, or TNM stage between the selected groups (Table 3). However, there was a clear association between Lauren’s and Ming’s classification and loss of heterozigosity groups (Table 3). Next, we analyzed loss of heterozigosity at both p53 loci separately (Table 4). We found a trend between p53 expression and p53-1 LOH, while there was no association between this variable and p53-2 LOH. However, both loci showed association with Lauren’s and Ming’s classification. No other associations were found with p53 markers and clinicopathological parameters.
Table 3.
Statistical comparison between clinicopathological characteristics and overall loss of (LOH) heterozigosity status of the p53 gene in selected gastric cancer cases*
| Clinicopathological characteristics | Total | LOH-L | LOH-H | No-LOH | P |
|---|---|---|---|---|---|
| Total | 83 | 31 | 10 | 42 | |
| Gender: | |||||
| male | 54 | 23 | 6 | 25 | 0.393† |
| female | 29 | 8 | 4 | 17 | |
| Borrmann’s classification (ref. 17): | |||||
| I | 9 | 6 | 1 | 2 | 0.478‡ |
| II | 21 | 9 | 3 | 9 | |
| III | 45 | 14 | 5 | 26 | |
| IV | 8 | 2 | 1 | 5 | |
| Lauren’s classification (ref. 5): | |||||
| intestinal | 49 | 22 | 9 | 18 | 0.004† |
| diffuse | 27 | 6 | 0 | 21 | |
| mixed | 7 | 3 | 1 | 3 | |
| Ming’s classification (ref. 18): | |||||
| expansive | 40 | 22 | 8 | 10 | <0.001† |
| infiltrative | 37 | 7 | 2 | 28 | |
| mixed | 6 | 2 | 0 | 4 | |
| pT: | |||||
| T1 | 1 | 0 | 0 | 1 | 0.746§ |
| T2 | 41 | 16 | 6 | 19 | |
| T3 | 39 | 13 | 4 | 22 | |
| T4 | 2 | 2 | 0 | 0 | |
| pN: | |||||
| N0 | 30 | 10 | 2 | 18 | 0.848§ |
| N1 | 29 | 14 | 4 | 11 | |
| N2 | 13 | 3 | 2 | 8 | |
| N3 | 11 | 4 | 2 | 5 | |
| pM: | |||||
| M0 | 77 | 29 | 9 | 39 | 1.000† |
| M1 | 6 | 2 | 1 | 3 | |
| p53 expression║ | |||||
| - | 60 | 19 | 6 | 35 | 0.075‡ |
| + | 23 | 12 | 4 | 7 |
*Abbreviations: LOH-L – LOH-low; LOH-H – LOH-high; pT – size of the tumor; pN – involvement of lymph nodes; pM – distant metastasis.
†Fisher exact test.
‡χ2 test.
§Mantel-Haenszel test.
║Minus – no detectable p53 expression; plus – p53 overexpression.
Table 4.
Statistical comparison between clinicopathological parameters and separate p53-1 or p53-2 LOH status in selected gastric cancer cases*
| Clinicopathological characteristics | Total | P53-1 LOH | No-LOH | P | Total | P53-2 LOH | No-LOH | P |
|---|---|---|---|---|---|---|---|---|
| Total | 115 | 24 | 91 | 98 | 27 | 71 | ||
| Gender: | ||||||||
| male | 77 | 15 | 62 | 0.631† | 61 | 20 | 41 | 0.166† |
| female | 38 | 9 | 29 | 37 | 7 | 30 | ||
| Borrmann’s classification (ref. 17): | ||||||||
| I | 10 | 2 | 8 | 0.305‡ | 11 | 6 | 5 | 0.191‡ |
| II | 27 | 9 | 18 | 26 | 6 | 20 | ||
| III | 64 | 10 | 54 | 55 | 14 | 41 | ||
| IV | 13 | 3 | 10 | 6 | 1 | 5 | ||
| Lauren’s classification (ref. 5): | ||||||||
| intestinal | 60 | 18 | 42 | 0.003† | 56 | 22 | 34 | 0.010† |
| diffuse | 42 | 2 | 40 | 35 | 4 | 31 | ||
| mixed | 13 | 4 | 9 | 7 | 1 | 6 | ||
| Ming’s classification (ref. 18): | ||||||||
| expansive | 42 | 16 | 26 | 0.002† | 44 | 22 | 22 | <0.001† |
| infiltrative | 62 | 6 | 56 | 46 | 5 | 41 | ||
| mixed | 10 | 2 | 8 | 8 | 0 | 8 | ||
| pT: | ||||||||
| T1 | 2 | 0 | 2 | 0.792§ | 2 | 0 | 2 | 0.474§ |
| T2 | 56 | 13 | 43 | 45 | 15 | 30 | ||
| T3 | 53 | 9 | 44 | 50 | 12 | 38 | ||
| T4 | 4 | 2 | 2 | 1 | 0 | 1 | ||
| pN: | ||||||||
| N0 | 40 | 6 | 34 | 0.060§ | 42 | 8 | 34 | 0.633§ |
| N1 | 42 | 8 | 34 | 32 | 14 | 20 | ||
| N2 | 18 | 4 | 14 | 13 | 3 | 10 | ||
| N3 | 15 | 6 | 9 | 9 | 2 | 7 | ||
| pM: | ||||||||
| M0 | 106 | 21 | 85 | 0.392† | 93 | 26 | 67 | 1.000† |
| M1 | 9 | 3 | 6 (6.6) | 5 | 1 | 4 | ||
| P53 expression: | ||||||||
| - | 89 | 14 | 75 | 0.012‡ | 73 | 17 | 56 | 0.106‡ |
| + | 26 | 10 | 16 | 25 | 10 | 15 |
*Abbreviations: pT – size of the tumor; pN – involvement of lymph nodes; pM – distant metastasis); p53-1 LOH – LOH at p53-1 locus; p53-2 LOH – LOH at p53-2 locus.
†Fisher exact test.
‡χ2 test.
§Mantel-Haenszel test.
P53 expression
In the present series, 66 (28.7%) cases showed positive p53 expression and 164 (71.3%) were categorized negative. p53 expression was inversely associated with pM (Table 5). No other significant relations were apparent between p53 expression and clinicopathological parameters.
Table 5.
Statistical comparison between clinicopathological factors and p53 expression in gastric carcinomas of Slovenian patients*
| Clinicopathological characteristics | Number of patients | P53 expression |
P | |
|---|---|---|---|---|
| - | + | |||
| Total | 164 | 66 | ||
| Gender | ||||
| male | 147 | 102 | 45 | 0.392† |
| female | 83 | 62 | 21 | |
| Borrmann’s classification (ref. 17): | ||||
| I | 27 | 19 | 8 | 0.874† |
| II | 58 | 39 | 19 | |
| III | 123 | 90 | 33 | |
| IV | 20 | 14 | 6 | |
| Lauren’s classification (ref. 5): | ||||
| intestinal | 126 | 87 | 39 | 0.703† |
| diffuse | 74 | 55 | 19 | |
| mixed | 30 | 22 | 8 | |
| Ming’s classification (ref. 18): | ||||
| expansive | 89 | 56 | 30 | 0.087† |
| infiltrative | 106 | 83 | 23 | |
| mixed | 37 | 24 | 13 | |
| pT: | ||||
| T1 | 5 | 5 | 0 | 0.520‡ |
| T2 | 105 | 75 | 30 | |
| T3 | 115 | 80 | 35 | |
| T4 | 5 | 4 | 1 | |
| pN: | ||||
| N0 | 81 | 61 | 20 | 0.120‡ |
| N1 | 80 | 62 | 18 | |
| N2 | 42 | 21 | 21 | |
| N3 | 27 | 20 | 7 | |
| pM: | ||||
| M0 | 216 | 158 | 58 | 0.028§ |
| M1 | 14 | 6 | 8 | |
*Abbreviations: pT – size of the tumor; pN – involvement of lymph nodes; pM – distant metastasis.
†χ2 test.
‡Mantel-Haenszel test.
§Fisher exact test.
Mutation analysis
p53 mutation analysis was performed on 28 gastric cancer samples, equally distributed to the 4 groups in accordance with the microsatellite instability/loss of heterozigosity status. All nucleotide changes were checked against IARC TP53 Mutation Database and p53 Web Site (http://p53.free.fr). Table 6 shows the results of mutational analysis for 2 out of 6 cases with MSI+and 13 out of 22 cases with microsatellite instability-status. In 15 (53.6%) cases we found a mutated p53 sequence. Altogether, we found 7 changes and some cases harbored more than 1 change. Five patients had 2 or 3 sequence changes, while the rest of them had only 1. Regarding the distribution of mutations among patients, there were 20 heterozygous and 3 homozygous changes some individuals had more than one change. There was no significant association between clinicopathological parameters and mutational status of p53 gene. Also, we did not find significant association of these nucleotide changes with p53 expression. Only three cases harboring nucleotide changes had positive p53 expression. Of 7 nucleotide changes found, there were 3 silent (P36P, R213Rand R280R), 1 missense (R282R), 1 frameshift (F134na), and 1 splice (IVS-4(11934_11958)ins) mutation. Patient (case 140) with R282R mutation showed p53 overexpression as well, while the other 2 in the group with positive p53 expression harbored silent mutations (cases 143 and 154).
Table 6.
p53 mutations and LOH status at p53 locus in Slovenian patients with gastric cancer*
| Patient | Exon | Nucleotide change | Protein change | Effect | LOH status |
|---|---|---|---|---|---|
| MSI | |||||
| 151 | 4 | g.12032G>A† | p.P36P | silent | Un |
| 4 | g.12139C>G† | p.P72R | polymorphism | ||
| Intron 3 | IVS-4(11934_11958)dup† | splice | |||
| 162 | 4 | g.12139C>G§ | p.P72R | polymorphism | Un |
| Intron 3 | IVS-4(11934_11958)dup§ | splice | |||
| No MSI | |||||
| 121 | 5 | g.13079delT‡ | p.F134na | frameshift | LOH-L |
| 140 | 8 | g.14513C>T‡ | p.R282W | missense | LOH-H |
| 142 | 4 | g.12139C>G‡ | p.P72R | polymorphism | Un |
| Intron 3 | g.14513C>T§ | p.R282W | missense | ||
| Intron 3 | IVS-4(11934_11958)dup† | splice | |||
| 147 | 4 | g.12139C>G† | p.P72R | polymorphism | No-LOH |
| 153 | 6 | g.13399A>G† | p.R213R | silent | No-LOH |
| 154 | 8 | g.14509A>G† | p.R280R | silent | LOH-L |
| 164 | 4 | g.12139C>G† | p.P72R | polymorphism | Un |
| Intron 3 | IVS-4(11934_11958)dup† | splice | |||
| 160 | 6 | g.13399A>G† | p.R213R | silent | LOH-L |
| 169 | 4 | g.12032G>A† | p.P36P | silent | No-LOH |
| 171 | 4 | g.12032G>A§ | p.P36P | silent | No-LOH |
| 4 | g.12139CG† | p.P72R | polymorphism | ||
| 173 | 4 | g.12139C>G† | p.P72R | polymorphism | No-LOH |
| 174 | 4 | g.12139C>G† | p.P72R | polymorphism | Un |
| 175 | 4 | g.12139C>G† | p.P72R | polymorphism | No-LOH |
| Intron 3 | IVS-4(11934_11958)dup† | splice |
*Abbreviations: Un – unstable, MSI at either one or both loci; LOH-L – LOH-low; LOH-H – LOH-high.
†Somatic, heterozygous nucleotide change.
‡Nucleotide change only in tumor tissue, heterozygous.
§Somatic nucleotide change, homozygous.
Survival analysis
At the end of the follow-up period, 68 of 221 (30.8%) patients were still alive. Nine patients were excluded, 4 cases were lost to follow up and 5 died within 30 days after surgery. The overall 5-year survival was 43.1%. Univariate survival analysis showed that p53 expression, Borrmann’s classification, pT, pN, pM, TNM stage, grade, and tumor location were significant prognostic factors (P<.05) (Table 7). High p53 expression, presence of metastases, higher nodal involvement, higher TNM stage, higher grade, and tumor invasion predicted shorter 5-year survival (Figure 1). Microsatellite instability and loss of heterozigosity status had no prognostic significance for survival in the whole group. Multivariate analyses were performed for 216 patients that were accompanied with complete data sets (Table 8). Cox regression model included all significant variables (p53 expression, Borrmann’s classification, pT, pN, pM, TNM stage, grade and tumor location). The forward stepwise method showed that the only independent predictors of shorter survival were p53 expression and TNM stage.
Table 7.
Univariate survival analysis of clinicopathological variables in gastric cancer patients*
| Variable | 5-y survival (%) | P |
|---|---|---|
| P53 expression: | ||
| - | 47.4 | 0.033 |
| + | 31.9 | |
| Borrmann’s classification (ref. 17): | ||
| type 1 | 55.6 | 0.014 |
| type 2 | 52.7 | |
| type 3 | 40.7 | |
| type 4 | 12.5 | |
| Lauren’s classification (ref. 5): | ||
| intestinal | 46.9 | 0.129 |
| diffuse | 40.6 | |
| mixed | 34.1 | |
| Ming’s classification (ref. 18): | ||
| expansive | 48.8 | 0.496 |
| infiltrative | 38.4 | |
| mixed | 42.9 | |
| pT: | ||
| T1 | 100 | <0.001 |
| T2 | 57.6 | |
| T3 | 28.6 | |
| T4 | 20.0 | |
| pN: | ||
| N0 | 74.6 | <0.001 |
| N1 | 37.2 | |
| N2 | 12.0 | |
| N3 | 3.8 | |
| pM: | ||
| M0 | 44.9 | <0.001 |
| M1 | 9.1 | |
| TNM classification (ref. 12): | ||
| I | 82.8 | <0.001 |
| II | 53.2 | |
| III | 25.2 | |
| IV | 3.0 | |
| Grade: | ||
| G1 | 79.3 | 0.032 |
| G2 | 42.2 | |
| G3 | 39.3 | |
| G4 | 35.7 | |
| Location: | ||
| upper | 27.3 | 0.002 |
| middle | 51.9 | |
| lower | 49.1 | |
| whole | 30.8 |
*Abbreviations: pT – size of the tumor; pN – involvement of lymph nodes; pM – distant metastasis.
Figure 1.
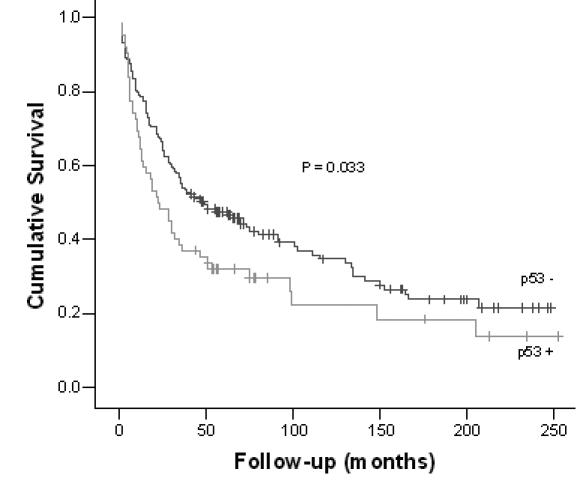
Survival of patients according to p53 expression (from surgery to the last follow-up).
Table 8.
Multivariate survival analysis of clinicopathological variables in gastric cancer patients*
| Category | B† | HR (95% CI) | P |
|---|---|---|---|
| P53 expression: | |||
| - | -0.401 | 0.669 (0.470-0.953) | 0.026 |
| + | Reference | ||
| TNM classification (ref. 12): | |||
| I | -2.620 | 0.73 (0.039-0.137) | <0.001 |
| II | -1.970 | 0.139 (0.083-0.233) | <0.001 |
| III | -0.886 | 0.412 (0.265-0.641) | <0.001 |
| IV | Reference |
*Abbreviations: HR – hazard ratio, relative risk; CI – 95% confidence interval.
†Predicted change in the hazard for a unit increase in the predictor.
‡TNM classification of gastric tumors.
Discussion
Our study showed that gastric cancers with loss of heterozigosity at different p53 loci, displayed significant association with the most frequently used classifications in clinical practice, Lauren’s and Ming’s classification (5,18). Statistical analyses showed that more patients with LOH-low and LOH-high status had intestinal type of gastric cancer, compared with patients without loss of heterozigosity at p53. On the other hand, more patients with diffuse gastric cancer type had no loss of heterozigosity at the examined p53 loci. This is in accordance with some previous studies (10,24).
However, in general reports regarding microsatellite instability and loss of heterozygosity, genotypes in gastric cancers are more or less conflicting, displaying the variation of microsatellite instability in gastric cancer among different studies (10). It is widely accepted that tumors with microsatellite instability phenotypes have lower frequency of loss of heterozigosity and lower rate of mutations. This suggests that there are at least two pathways, mutator and suppressor, which could be independent of each other at least in the early stages of gastric cancer development (10). Nevertheless, several studies showed certain overlap between these two pathways (25). In our sample group, we found relatively low level of microsatellite instability (7.4%), probably because this type of genetic abnormality was detected at loci for p53 gene, initially selected for the analysis of loss of heterozigosity. On the other hand, reported variations of microsatellite instability in gastric cancer range from 9 to 44%, and some researchers have already proposed the use of alternative markers for microsatellite instability assessment (26). However, our microsatellite instability analyses revealed a clear trend of decreasing percentage of microsatellite instability with an increase in TNM stage, which is in accordance with previous studies (27).
Overexpression of p53 in gastric cancer tissues ranges from 13 to 54%, which is comparable with 28.7%, as found in our study (28). Several studies reported no significant relationship between p53 positivity and macroscopic appearance, histological classifications, and growth pattern (29). Similarly, our study also showed no significant relationship between these parameters. It was postulated that p53 overexpression and mutations were an early event, critical in the development of differentiated carcinomas. In this respect, the frequent detection of these changes in undifferentiated carcinomas could be due to frequent conversion of differentiated tumors to the undifferentiated ones as the disease progresses (10). This could explain the discrepancy between histological parameters and p53 expression found in our study, since almost all cases were diagnosed with an advanced gastric cancer.
The p53 mutational status did not result in a clear association with p53 expression, which is in accordance with several studies (27,30). It is well known that certain types of mutations do not produce stable proteins and that protein overexpression could be the result of stress environment in stomach, which is why even the minimal accumulation of wild-type protein could be detected by sensitive immunohistochemical methods (14,31). In our study, we found p53 nucleotide changes in half of the examined cases and, although we selected a small group of patients for mutation analysis, this prevalence fell within the wide range of p53 mutation prevalence (8 to 65%) found in previous studies (19). The P72R polymorphism was relatively frequent in our group and was previously associated with an increased risk of developing cancers of the lung, stomach, esophagus, and the cervix (32). Although our sample was too small to perform statistical analysis of haplotypes, our finding supports the findings of previous studies, showing arginine allele to be more efficient in apoptosis in cell cultures (16). It was concluded that these polymorphisms could influence the occurrence or progression of cancer (16). The biological activity of insertion of 16 base pairs in intron 3 and deletion of one nucleotide in codon 134 have not been tested and it has been assumed that frameshift and nonsense mutations are deleterious for p53 (http://p53.free.fr, ref. 33). One patient had missense R282W mutation and this change was associated with the loss of transactivation and the loss of dominant negative nature, because it had no effect on transactivational activity of the wild-type p53 gene product in reporter assays (34). This and loss of heterozigosity, found in this case, could explain the absence of p53 immunostaining. In conclusion, although performed on a small sample, our results indicate that p53 positivity in gastric tumors is not an indicator of p53 mutations. Several other studies also confirmed this assumption (13,19,33). Even more, because of the biological variability of p53 mutations and the diverse causes of p53 protein accumulation, either parameter alone may fail to predict the prognosis correctly (13).
Today, the only prognostic factors accepted in clinical practice are clinicopathological features, such as TNM stage, age, or macroscopic tumor type (27). Univariate survival analyses of our group of patients also revealed TNM stage, pT, pN, pM, grade, and Borrmann’s classification as significant factors for predicting survival. We also found positive p53 expression associated with poorer survival (Figure 1). On the other hand, although the role of p53 expression and its genetic changes in determining the therapy outcome has been studied in many different tumor types, the results are still conflicting (32). Some researchers showed that, in gastric carcinoma, p53 overexpression was associated with a lack of response to chemotherapy, while a few others showed that p53 absence is the predictor of poorer outcome (14,27,32). However, in the Western countries it was generally accepted that positive p53 expression had a poor prognosis outcome (28). The multivariate analysis showed TNM stage and p53 expression as independent prognostic factors for our group of gastric cancers. Although previous studies showed these two parameters to be important for survival, with genome-wide methods, such as microarrays, chromosomal comparative genomic hybridization, methylation assays, and single nucleotide polymorphisms, new views were opened up on complexity of gastric cancers (10,26,27,35,36).
In conclusion, our findings revealed that the combination of immunohistochemistry and detecting genetic changes of p53, followed by search of their association, in particular instances could be of value for predicting the behavior of gastric tumors.
Acknowledgments
This work was supported by the grant No. P1-0104 (Functional Genomics and Biotechnology for Health) from Slovenian Research Agency. The authors also are grateful to Professor Janez Stare from Institute for Biomedical Informatics (IBMI) at the Faculty of Medicine, University of Ljubljana for checking the statistical presentation of the data in the manuscript.
References
- 1.Bacani J, Zwingerman R, Di Nicola N, Spencer S, Wegrynowski T, Mitchell K, et al. Tumor microsatellite instability in early onset gastric cancer. J Mol Diagn. 2005;7:465–77. doi: 10.1016/S1525-1578(10)60577-6. [DOI] [PMC free article] [PubMed] [Google Scholar]
- 2.Wu CW, Chi CW, Lin WC. Gastric cancer: prognostic and diagnostic advances. Expert Rev Mol Med. 20022002:1–12. doi: 10.1017/S1462399402004337. [DOI] [PubMed] [Google Scholar]
- 3.Crew KD, Neugut AI. Epidemiology of gastric cancer. World J Gastroenterol. 2006;12:354–62. doi: 10.3748/wjg.v12.i3.354. [DOI] [PMC free article] [PubMed] [Google Scholar]
- 4.Ferlay J, Bray F, Pisani P, Parkin D. Globocan 2000: Cancer incidence, mortality and prevalence worldwide. Lyon: IARC Press; 2001. [Google Scholar]
- 5.Lauren P. The two histological main types of gastric carcinoma: diffuse and so-called intestinal-type carcinoma. An attempt at a histo-clinical classification. Acta Pathol Microbiol Scand. 1965;64:31–49. doi: 10.1111/apm.1965.64.1.31. [DOI] [PubMed] [Google Scholar]
- 6.Tahara E, Kuniyasu H, Yasui W, Yokozaki H. Gene alterations in intestinal metaplasia and gastric cancer. Eur J Gastroenterol Hepatol. 1994;6(Suppl 1):S97–102. [PubMed] [Google Scholar]
- 7.Kountouras J, Zavos C, Chatzopoulos D. New concepts of molecular biology on gastric carcinogenesis. Hepatogastroenterology. 2005;52:1305–12. [PubMed] [Google Scholar]
- 8.Tahara E. Genetic pathways of two types of gastric cancer. IARC Sci Publ. 2004;(157):327–49. [PubMed] [Google Scholar]
- 9.Smith MG, Hold GL, Tahara E, El-Omar EM. Cellular and molecular aspects of gastric cancer. World J Gastroenterol. 2006;12:2979–90. doi: 10.3748/wjg.v12.i19.2979. [DOI] [PMC free article] [PubMed] [Google Scholar]
- 10.Tamura G. Alterations of tumor suppressor and tumor-related genes in the development and progression of gastric cancer. World J Gastroenterol. 2006;12:192–8. doi: 10.3748/wjg.v12.i2.192. [DOI] [PMC free article] [PubMed] [Google Scholar]
- 11.Yokozaki H, Yasui W, Tahara E. Genetic and epigenetic changes in stomach cancer. Int Rev Cytol. 2001;204:49–95. doi: 10.1016/s0074-7696(01)04003-7. [DOI] [PubMed] [Google Scholar]
- 12.Kufe DW, Pollock RE, Wichselbaum RR, Bast RC, Gansler TS, Holland JF, et al, editors. Cancer medicine. 6th ed. Hamilton, Ontario: BC Decker; 2003. [Google Scholar]
- 13.Shiao YH, Palli D, Caporaso NE, Alvord WG, Amorosi A, Nesi G, et al. Genetic and immunohistochemical analyses of p53 independently predict regional metastasis of gastric cancers. Cancer Epidemiol Biomarkers Prev. 2000;9:631–3. [PubMed] [Google Scholar]
- 14.Fenoglio-Preiser CM, Wang J, Stemmermann GN, Noffsinger A. TP53 and gastric carcinoma: a review. Hum Mutat. 2003;21:258–70. doi: 10.1002/humu.10180. [DOI] [PubMed] [Google Scholar]
- 15.Gottlieb TM, Oren M. p53 in growth control and neoplasia. Biochim Biophys Acta. 1996;1287:77–102. doi: 10.1016/0304-419x(95)00019-c. [DOI] [PubMed] [Google Scholar]
- 16.Levine AJ, Hu W, Feng Z. The P53 pathway: what questions remain to be explored? Cell Death Differ. 2006;13:1027–36. doi: 10.1038/sj.cdd.4401910. [DOI] [PubMed] [Google Scholar]
- 17.Borrmann R. Geshwulste des Magens und Duodenums. In: Henkie F, Lubarsch O, editors. Handbuch der Speziellen Pathologischen Anatomie und Histologie. Berlin, Springer-Verlag, 1926:865. [Google Scholar]
- 18.Ming SC. Cellular and molecular pathology of gastric carcinoma and precursor lesions: A critical review. Gastric Cancer. 1998;1:31–50. doi: 10.1007/s101200050053. [DOI] [PubMed] [Google Scholar]
- 19.Shibata A, Parsonnet J, Longacre TA, Garcia MI, Puligandla B, Davis RE, et al. CagA status of Helicobacter pylori infection and p53 gene mutations in gastric adenocarcinoma. Carcinogenesis. 2002;23:419–24. doi: 10.1093/carcin/23.3.419. [DOI] [PubMed] [Google Scholar]
- 20.Cawkwell L, Lewis FA, Quirke P. Frequency of allele loss of DCC, p53, RBI, WT1, NF1, NM23 and APC/MCC in colorectal cancer assayed by fluorescent multiplex polymerase chain reaction. Br J Cancer. 1994;70:813–8. doi: 10.1038/bjc.1994.404. [DOI] [PMC free article] [PubMed] [Google Scholar]
- 21.Soussi T, Beroud C. Assessing TP53 status in human tumours to evaluate clinical outcome. Nat Rev Cancer. 2001;1:233–40. doi: 10.1038/35106009. [DOI] [PubMed] [Google Scholar]
- 22.Hudler P, Vouk K, Liovic M, Repse S, Juvan R, Komel R. Mutations in the hMLH1 gene in Slovenian patients with gastric carcinoma. Clin Genet. 2004;65:405–11. doi: 10.1111/j.0009-9163.2004.0234.x. [DOI] [PubMed] [Google Scholar]
- 23.Chang SC, Lin JK, Lin TC, Liang WY. Genetic alteration of p53, but not overexpression of intratumoral p53 protein, or serum p53 antibody is a prognostic factor in sporadic colorectal adenocarcinoma. Int J Oncol. 2005;26:65–75. [PubMed] [Google Scholar]
- 24.Zheng L, Wang L, Ajani J, Xie K. Molecular basis of gastric cancer development and progression. Gastric Cancer. 2004;7:61–77. doi: 10.1007/s10120-004-0277-4. [DOI] [PubMed] [Google Scholar]
- 25.Ottini L, Falchetti M, Lupi R, Rizzolo P, Agnese V, Colucci G, et al. Patterns of genomic instability in gastric cancer: clinical implications and perspectives. Ann Oncol. 2006;17(suppl_7):vii97–vii102. doi: 10.1093/annonc/mdl960. [DOI] [PubMed] [Google Scholar]
- 26.Tay ST, Leong SH, Yu K, Aggarwal A, Tan SY, Lee CH, et al. A combined comparative genomic hybridization and expression microarray analysis of gastric cancer reveals novel molecular subtypes. Cancer Res. 2003;63:3309–16. [PubMed] [Google Scholar]
- 27.Bataille F, Rummele P, Dietmaier W, Gaag D, Klebl F, Reichle A, et al. Alterations in p53 predict response to preoperative high dose chemotherapy in patients with gastric cancer. Mol Pathol. 2003;56:286–92. doi: 10.1136/mp.56.5.286. [DOI] [PMC free article] [PubMed] [Google Scholar]
- 28.Lee KE, Lee HJ, Kim YH, Yu HJ, Yang HK, Kim WH, et al. Prognostic significance of p53, nm23, PCNA and c-erbB-2 in gastric cancer. Jpn J Clin Oncol. 2003;33:173–9. doi: 10.1093/jjco/hyg039. [DOI] [PubMed] [Google Scholar]
- 29.Muller W, Borchard F. Prognostic influence of p53 expression in gastric cancer. J Pathol. 1996;178:255–8. doi: 10.1002/(SICI)1096-9896(199603)178:3<255::AID-PATH468>3.0.CO;2-V. [DOI] [PubMed] [Google Scholar]
- 30.Sturm I, Kohne CH, Wolff G, Petrowsky H, Hillebrand T, Hauptmann S, et al. Analysis of the p53/BAX pathway in colorectal cancer: low BAX is a negative prognostic factor in patients with resected liver metastases. J Clin Oncol. 1999;17:1364–74. doi: 10.1200/JCO.1999.17.5.1364. [DOI] [PubMed] [Google Scholar]
- 31.Grundei T, Vogelsang H, Ott K, Mueller J, Scholz M, Becker K, et al. Loss of heterozygosity and microsatellite instability as predictive markers for neoadjuvant treatment in gastric carcinoma. Clin Cancer Res. 2000;6:4782–8. [PubMed] [Google Scholar]
- 32.Sul J, Yu GP, Lu QY, Lu ML, Setiawan VW, Wang MR, et al. P53 Codon 72 polymorphisms: a case-control study of gastric cancer and potential interactions. Cancer Lett. 2006;238:210–23. doi: 10.1016/j.canlet.2005.07.004. [DOI] [PMC free article] [PubMed] [Google Scholar]
- 33.Soussi T, Ishioka C, Claustres M, Beroud C. Locus-specific mutation databases: pitfalls and good practice based on the p53 experience. Nat Rev Cancer. 2006;6:83–90. doi: 10.1038/nrc1783. [DOI] [PubMed] [Google Scholar]
- 34.Sugiyama H, Arita M, Min Z, Zhong X, Iwasaki I, Hirano K, et al. A novel dysfunctional p53 mutation in the human neuroblastoma cell line TGW. Tohoku J Exp Med. 2003;201:229–37. doi: 10.1620/tjem.201.229. [DOI] [PubMed] [Google Scholar]
- 35.Liu XP, Tsushimi K, Tsushimi M, Oga A, Kawauchi S, Furuya T, et al. Expression of p53 protein as a prognostic indicator of reduced survival time in diffuse-type gastric carcinoma. Pathol Int. 2001;51:440–4. doi: 10.1046/j.1440-1827.2001.01216.x. [DOI] [PubMed] [Google Scholar]
- 36.Pinto-de-Sousa J, Silva F, David L, Leitao D, Seixas M, Pimenta A, et al. Clinicopathological significance and survival influence of p53 protein expression in gastric carcinoma. Histopathology. 2004;44:323–31. doi: 10.1111/j.1365-2559.2004.01852.x. [DOI] [PubMed] [Google Scholar]