

Abstract
Background
Exposure to the fungus Alternaria alternata is a risk factor for asthma. Few studies have examined Alternaria exposures in indoor environments.
Objective
We examined whether exposure to A alternata in US homes was associated with asthma-related outcomes.
Methods
The data for this study were collected as part of the National Survey of Lead and Allergens in Housing. This cross-sectional study surveyed a nationally representative sample of 831 housing units inhabited by 2456 individuals in 75 different locations throughout the United States. An interviewer-administered questionnaire obtained information on demographics, household characteristics, and occupants' health status. Exposure to A alternata was assessed by measuring concentrations of A alternata antigens in vacuumed dust samples using a polyclonal anti–A alternata antibody assay. Dust samples were collected from a bed, a sofa, or a chair, and from bedroom, living room, and kitchen floors.
Results
Lifetime prevalence of doctor-diagnosed asthma was 11.2%, and 6.9% of the study subjects reported active asthma symptoms in the past 12 months. The prevalence of current symptomatic asthma increased with increasing Alternaria concentrations in US homes; higher levels of A alternata antigens increased the odds of having asthma symptoms in the past year (relative to the lowest tertile, adjusted odds ratio was 1.52, 95% CI, 0.90−2.55 for the 2nd tertile; and 1.84, 95% CI, 1.18−2.85 for the 3rd tertile).
Conclusion
Exposure to A alternata in US homes is associated with active asthma symptoms.
Clinical implications
Measures that reduce indoor exposure to A alternata may help control asthma exacerbations.
Keywords: Alternaria alternata, fungal allergen, antigen, indoor, exposure, asthma, allergy
Alternaria alternata is one of the most common fungi associated with asthma.1,2 Not only the presence of asthma but also persistence and severity of asthma have been strongly associated with sensitization and exposure to A alternata.3-8 Although exposure to Alternaria is an important risk factor for asthma, few studies have assessed exposure to this fungus in indoor environments.9,10
A alternata, a cosmopolitan saprophyte commonly found in soil and plants, is usually considered an outdoor allergen.1,11,12 Although most intense exposure is likely to occur outdoors, Alternaria and other allergenic fungi are also found in indoor environments.1,13-15 Yet fungal allergen exposures in indoor environments have not been characterized as well as other indoor allergens (eg, house dust mite, cockroach, and pet allergens).
One of the major constraints in assessing exposure to fungal allergens has been the difficulty of accurately quantitating the exposure. Exposure to fungal allergens has been conventionally estimated by indirect methods using spore or fungal colony counts in air or dust samples as a proxy of exposure.15,16 Although spores are considered primary sources of fungal allergens,17 allergens and other biologically active molecules derived from fungi can be transported by means other than intact spores (eg, hyphael fragments, fragmented spores, and dust particles).1,18,19 For example, allergens can be released along the entire length of the hyphael tube in A alternata.18 Moreover, allergen content in spores may vary depending on environmental conditions.18,20 The complex nature of the exposure has hampered development of more sophisticated measuring techniques. Although several fungal allergens have been purified and cloned, availability of fungal immunoassays remains limited.15,21 Considerable progress, however, has been made in qualifying and quantifying Alternaria allergens.15,22
The National Survey of Lead and Allergens in Housing (NSLAH) was the first population-based study that measured antigenic and allergenic components of A alternata in a nationally representative sample of US homes using a polyclonal anti–A alternata antibody assay. In this article, we examine the associations between indoor exposures to A alternata and asthma-related symptoms among the study population.
METHODS
Study design and procedures
The data for this cross-sectional study were obtained from the NSLAH. The NSLAH surveyed 831 housing units, which were designed to represent the 96 million permanently occupied, noninstitutional housing units that permit resident children. The surveyed housing units were inhabited by 2456 individuals, including 26.8% children. The survey was approved by the National Institute of Environmental Health Sciences Institutional Review Board in 1998. A detailed description of the study design and methodology has been published elsewhere.23 Briefly, information on demographics, household characteristics, and occupant health status was collected by a questionnaire administered to an adult representative of the household. Environmental data were also acquired by sample collection and inspection of the housing units.
Assessment of health outcomes
The interview obtained information on doctor-diagnosed asthma and allergies, asthma symptoms in the past year, and current asthma medication use. In this survey, an adult respondent was asked whether anyone in the household had doctor-diagnosed asthma, including adults with childhood-onset asthma. If answered affirmative, an additional question ascertained whether the household members with doctor-diagnosed asthma had had asthma symptoms in the past year. Current asthma at the individual level, which was our primary outcome measure, was defined as symptomatic, doctor-diagnosed asthma. The respondent was also asked whether anyone in the household had doctor-diagnosed allergies (eg, hay fever, skin, or food allergies).
Exposure assessment
Single surface dust samples were collected from a bed, a sofa, or a chair, and from bedroom, living room, and kitchen floors as previously described.23,24 Each sampling site was vacuumed for 5 minutes using a Eureka Mighty-Might 7.0-ampere vacuum cleaner (Eureka Co, Bloomington, Ill) modified to collect dust into a 19 mm × 90 mm cellulose extraction thimble (Whatman International, Ltd, Maidstone, United Kingdom). Concentrations of A alternata antigens (μg/g) in dust were measured with a competitive inhibition ELISA using a commercially prepared polyclonal rabbit anti–A alternata antibody and A alternata antigen standard (Greer Laboratories, Inc, Lenoir, NC).24 The assay detects major A alternata antigens, including the most common allergen, Alt a 1.25
Statistical analyses
Alternaria alternata antigen concentrations were log-transformed for the statistical analysis. In addition to the site-specific concentrations, we calculated a house index (ie, the mean of all sampling location concentrations) to represent the average Alternaria concentration in the household. We maximized the number of samples in the analysis by assigning samples with concentrations less than the detection limit to ½ the value of the detection limit.24 If samples had insufficient amount of dust for the antigen analysis, they were considered missing. Assessing exposures with the average Alternaria concentration, 98.9% (N = 822) of the households were included in the analysis. In the site-specific analyses, the corresponding percentage varied from 76.1% to 85.4%, lowest for beds and highest for bedroom floors.
We calculated odds ratios (ORs) with 95% CIs for the asthma-related outcomes using logistic regression. Subjects with missing data on the exposures were excluded from the analyses. The following covariates were considered as potential confounders or modifying factors: age, sex, race and ethnicity, living area defined by the size of population and census region, household income, education, family size, smoking in the household, presence of pets, presence of mold/moisture problems, main heating source, survey season, and personal history of atopy. Furthermore, we examined whether the effect estimates were influenced by dust weight and presence of other indoor allergens (Der f 1, Der p 1, Bla g 1, Fel d 1, Can f 1, mouse urinary protein) and bacterial lipopolysaccharide (endotoxin). The associations between Alternaria concentrations and asthma symptoms were not strongly confounded by the covariates; changes in ORs tended to be less than 10%. To maximize observations in the analysis and avoid multicollinearity, we chose to adjust our models for age, sex, race, education, smoking, and survey season. Because we did not have information on personal smoking, smoking exposure was assessed at the household level (indoor smoking in the home).
Logistic modeling was conducted using SUDAAN (Version 9.1; Research Triangle Institute, Research Triangle Park, NC), and Taylor series linearization methods were used to adjust SEs for the complex survey design. The SUDAAN software also took into account effects of clustering in the data including multiple occupants in the same household. Sample weights were applied to all estimates to account for housing selection probabilities, nonresponse, and poststratification. Details of statistical weighing for the NSLAH are described elsewhere.23
To illustrate the associations between A alternata antigen concentrations and asthma symptoms graphically, we used smoothed plots to display trends in outcome prevalence across a range of concentrations. Nonparametric regression analyses were conducted using GAM function in S-Plus (v6; Insightful Corp, Seattle, Wash), and the fitted model relationships were graphed.
RESULTS
In the study population, 11.2% had been diagnosed with asthma sometime in their lifetime, whereas 6.9% reported current asthma. The prevalence of asthma was comparable to other national surveys.26 The majority of the subjects with current asthma (71.2%) in this study used asthma medication. Subjects who reported doctor-diagnosed allergies were more likely to have diagnosed asthma (30.1% vs 5.6%; P < .01 for difference), especially with active symptoms (22.0% vs 2.6%; P < .01 for difference), than those who did not have diagnosed allergies. The lifetime prevalence of self-reported doctor-diagnosed hay fever was 16.2% among the participants, significantly higher among subjects with asthma than subjects without asthma (45.8% vs 12.0%; P < .01 for difference). The main characteristics of the study population are presented in Table I.
TABLE I.
Characteristics of the study population from the NSLAH
| Characteristic | N | %* |
|---|---|---|
| Age | ||
| <18 y | 762 | 26.8 |
| 18 y or older | 1643 | 73.2 |
| Sex | ||
| Male | 1189 | 48.2 |
| Female | 1256 | 51.8 |
| Race | ||
| White | 1788 | 79.9 |
| Black | 355 | 11.6 |
| Other | 262 | 8.5 |
| Living area | ||
| MSA, ≥1 million persons | 823 | 28.0 |
| MSA, <1 million persons | 1241 | 48.3 |
| Non-MSA | 392 | 23.7 |
| Census poverty† | ||
| At or below poverty level | 472 | 16.5 |
| Above poverty level | 1873 | 83.5 |
| Education‡ | ||
| High school level or lower | 758 | 29.7 |
| Above high school level | 1646 | 70.3 |
| Living with smoker(s) | ||
| Yes | 1124 | 46.0 |
| No | 1320 | 54.0 |
| Doctor-diagnosed asthma§ | ||
| Yes | 278 | 11.2 |
| No | 2162 | 88.8 |
| Current asthma | ||
| Yes | 174 | 6.9 |
| No | 2265 | 93.1 |
| Doctor-diagnosed hay fever§ | ||
| Yes | 309 | 16.2 |
| No | 1767 | 83.8 |
MSA, Metropolitan statistical area.
Weighted for the multistage sampling design of the NSLAH.
Poverty based on US Census Bureau poverty thresholds for 1996.
Highest education level attained in the household.
Lifetime diagnosis.
Exposure to A alternata antigens in US homes was common; 95% to 99% of the dust samples collected from 5 locations in the home had detectable levels of A alternata antigens. Of the sampled sites, living room floors had the highest concentrations (geometric mean, 5.73 μg/g; geometric standard error of mean [GSE], 0.20 μg/g), whereas bedroom beds had the lowest concentrations (geometric mean, 2.38 μg/g; GSE, 0.17 μg/g). The geometric mean for the average Alternaria concentration in the household was 4.88 μg/g (GSE, 0.13 μg/g). Details of the exposure characteristics have been published previously in the Journal.24
Current asthma was positively associated with A alternata antigen levels in the home. Prevalence of current asthma increased significantly with higher antigen levels (Table II). Table III shows unadjusted and adjusted effect estimates for the association between current asthma and the average Alternaria concentration in the household (the house index). This association was not greatly influenced by dust weight, presence of other indoor allergens, or endotoxin (Table III; see this article's Table E1 in the Online Repository at www.jacionline.org). Consistent with the results, asthma medication use was associated with A alternata antigen levels in the home. Relative to the lowest tertile, the OR was 1.43, 95% CI, 0.74 to 2.79, for the 2nd tertile and 1.72, 95% CI, 1.02 to 2.90, for the 3rd tertile (ORs adjusted for age, sex, race, education, smoking, and sampling season). On the contrary, hay fever (Table III) and other diagnosed allergies were not associated with indoor levels of A alternata antigens. Although wheezing is often closely related to asthma, recent wheezing was not associated with indoor levels of A alternata (data not shown). In this population, wheezing was not restricted to asthma symptoms; more than half of those who reported wheezing in the past year (69.9%) did not report current asthma. It is well known that diseases other than asthma (eg, chronic obstructive pulmonary disease) may also contribute to wheezing, especially among adults.27
TABLE II.
Prevalence of current asthma and diagnosed hay fever by average A alternata antigen level in the household (house index)
|
Current asthma |
Diagnosed hay fever |
|||
|---|---|---|---|---|
| Categorized Alternaria level* | N | Prevalence†‡(95% CI) | N | Prevalence† (95% CI) |
| 1st tertile | 40 | 4.81 (3.32−6.92) | 93 | 16.44 (13.04−20.52) |
| 2nd tertile | 61 | 7.47 (5.18−10.64) | 122 | 17.14 (12.82−22.54) |
| 3rd tertile | 73 | 8.73 (6.70−11.30) | 93 | 15.21 (12.13−18.90) |
1st tertile < 3.90 μg/g; 2nd tertile 3.90−6.27 μg/g; 3rd tertile ≥ 6.28 μg/g.
Percentage (95% CI) weighted for the multistage sampling design of the NSLAH.
χ2; P < .05.
TABLE III.
Current asthma and diagnosed hay fever in relation to average A alternata concentration in the household (house index)
| Logistic models* | Current asthma OR (95% CI) | Diagnosed hay fever OR (95% CI) |
|---|---|---|
| Unadjusted model | ||
| 1st tertile | 1.00 | 1.00 |
| 2nd tertile | 1.60 (0.93−2.77) | 1.06 (0.71−1.56) |
| 3rd tertile | 1.89 (1.21−2.93) | 0.91 (0.64−1.28) |
| Adjusted† model | ||
| 1st tertile | 1.00 | 1.00 |
| 2nd tertile | 1.52 (0.90−2.55) | 1.04 (0.71−1.51) |
| 3rd tertile | 1.84 (1.18−2.85) | 0.92 (0.65−1.31) |
| Adjusted† model | ||
| including other | ||
| indoor allergens | ||
| 1st tertile | 1.00 | 1.00 |
| 2nd tertile | 1.56 (0.96−2.53) | 1.04 (0.71−1.53) |
| 3rd tertile | 1.89 (1.25−2.85) | 0.91 (0.61−1.37) |
| Adjusted† model | ||
| including other | ||
| indoor allergens and dust weight | ||
| 1st tertile | 1.00 | 1.00 |
| 2nd tertile | 1.55 (0.96−2.52) | 1.03 (0.70−1.51) |
| 3rd tertile | 1.86 (1.22−2.84) | 0.89 (0.59−1.35) |
| Adjusted† model | ||
| including other | ||
| indoor allergens, dust weight, and endotoxin‡ | ||
| 1st tertile | 1.00 | 1.00 |
| 2nd tertile | 1.45 (0.88−2.39) | 1.07 (0.73−1.58) |
| 3rd tertile | 1.73 (1.08−2.77) | 0.98 (0.64−1.51) |
Alternaria concentration categorized into tertiles.
Adjusted for age, sex, race, education, smoking, and sampling season.
The model adjusted for endotoxin includes fewer observations than the other adjusted models (current asthma/no current asthma [n/N] = 170/2145 for the adjusted models, 168/2061 for the endotoxin adjusted model; hay fever/no hay fever = 300/1683 for the adjusted models, 290/1623 for the endotoxin adjusted model).
We used nonparametric regression analysis to characterize further the relationship between current asthma and A alternata antigen levels in the home. The modeled relationships display estimated trends in current asthma prevalence across Alternaria concentrations. The smooth plots illustrating adjusted prevalence for the average and site-specific Alternaria concentrations are shown in Fig 1. The prevalence of current asthma tended to increase with increasing antigen concentrations across the sites. There was no clear indication of a threshold below which there was no increase in prevalence. Complementary to the smooth curves, Fig 2 presents adjusted ORs for the association between current asthma and A alternata antigen levels when the antigen concentration was modeled as a continuous variable in logistic models. The ORs correspond to a 2-fold increase in A alternata concentration (average and site-specific concentrations).
FIG 1.
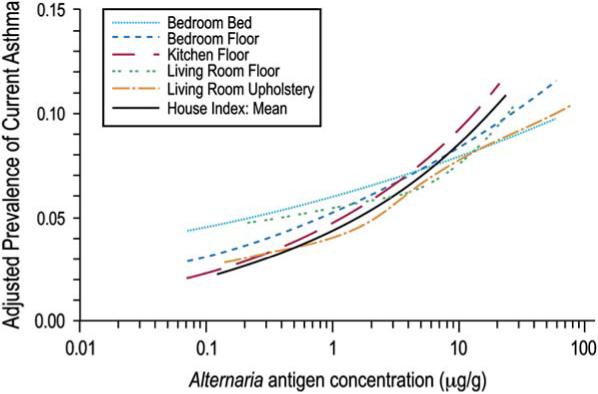
Smoothed plots showing adjusted prevalence of current asthma by A alternata antigen concentration for the house index and each sampling location. The estimated prevalence is adjusted for age, sex, race, education, smoking, and survey season.
FIG 2.

Adjusted ORs and 95% CIs for the association between current asthma and A alternata antigen concentration in the household (continuous variable). The house index (the mean of the site-specific concentrations) and site-specific ORs correspond to a 2-fold increase in Alternaria concentration adjusting for age, sex, race, education, smoking, and survey season.
We also examined whether the effect of Alternaria exposure differed by age groups (children, adults) and by atopic status, which was based on reported doctor-diagnosed allergies. Neither of these differences reached statistical significance (Table IV).
TABLE IV.
Current asthma in relation to a 2-fold increase in average Alternaria concentration in the household (house index) stratified by age groups and atopic status
| Stratification by | Current asthma OR (95% CI)* | P value for interaction |
|---|---|---|
| Age† | .62 | |
| All | 1.31 (1.05−1.64) | |
| Children | 1.47 (0.83−2.62) | |
| Adults | 1.25 (0.99−1.58) | |
| Diagnosed allergies‡ | .97 | |
| All | 1.28 (1.04−1.57) | |
| No | 1.27 (0.89−1.82) | |
| Yes | 1.28 (0.98−1.67) |
Adjusted model, Alternaria concentration modeled as a continuous variable.
Children (<18 years old), adults (18 years or older).
The model has fewer observations because of missing values (current asthma/no current asthma [n/N] = 170/2145 for the age-stratified model, 167/1857 for the atopy-stratified model).
DISCUSSION
This study demonstrates that exposure to A alternata in the home is positively associated with current asthma. Although fungal exposure levels in indoor environments are usually lower than outdoors,15,28 our results suggest that indoor exposure to A alternata contributes to asthma symptoms. Among the surveyed US population, the odds of having asthma symptoms in the past year increased significantly with higher indoor levels of A alternata antigens. This association remained consistent after adjusting for other potential risk factors, including exposures to other indoor allergens and endotoxin.
Indoor exposures are of great importance in relation to asthma because people spend most of their time in indoor environments, especially at home.29 In addition to the major indoor allergens, generated from arthropods and animals, exposure to fungal allergens has been associated with asthma.2,15 In particular, Alternaria sensitivity and increased Alternaria spore counts in the atmosphere have been repeatedly associated with asthma-related outcomes.1,2,4-8,12 However, few studies have assessed exposure to Alternaria in indoor environments9,10; exposure to Alternaria has been generally thought to arise primarily from outdoor environments.
In this study, higher levels of A alternata antigens in the home increased the odds of having asthma symptoms in the past year. The relationship is likely exposure-dependent because the prevalence of current symptomatic asthma increased with increasing Alternaria concentrations. All sampling sites showed an increasing trend, although the association was weaker for bedroom beds. Despite fairly uniform distributions across the sites, Alternaria concentrations were lowest in beds.24 Although Alternaria levels were correlated to some extent with the levels of dust mite allergens, mouse urinary protein, and endotoxin (data not shown), indoor exposure to Alternaria contributed independently to asthma symptoms. After adjusting for potential confounders, including the presence of other indoor allergens, endotoxin, or dust weight, the ORs did not change appreciably, and the magnitude of the effect remained the same (Table III; see this article's Table E1 in the Online Repository at www.jacionline.org).
Exposure and sensitization to Alternaria have been shown to be important risk factors for asthma, particularly among children.5,6,8,12 In our population, active asthma symptoms were slightly more prevalent among children than among adults (8.4% vs 6.5%; P = .12 for difference), but the observed effect was not modified by age. Although the point estimate for the association was higher among children than among adults, there was no evidence of significant interaction. We did not have detailed information on asthma severity among the study participants, but indoor exposure to A alternata appeared to contribute to active asthma symptoms irrespective of whether subjects used asthma medication.
Although sensitization to Alternaria has also been associated with allergic rhinitis,30,31 indoor exposure to A alternata antigens was not associated with doctor-diagnosed hay fever in this population. The lack of association was not necessarily unexpected because we had no information on whether individuals with diagnosed hay fever manifested any active symptoms. Prevalence of symptomatic hay fever usually tends to decline with advancing age, after reaching its peak during adolescence.32,33 Correspondingly, skin test response rates to common allergens, including Alternaria, have been shown to decline with older age.34 Because the prevalence of doctor-diagnosed hay fever was higher among adults than among children (18.2% vs 12.0%; P < .01 for difference), many of the individuals with hay fever diagnosis may have been symptom-free because of declined reactivity to allergens.
The effects of fungal exposure are generally greater among individuals who have skin prick test sensitivity to fungal allergens.3-5,8,15 Sensitization to Alternaria has been found to be significantly higher among subjects with asthma than among subjects without asthma.35 We were unable to ascertain Alternaria sensitivity among the study participants because we lacked detailed information on their sensitization status. Although the odds of having asthma diagnosis were significantly higher among those who reported doctor-diagnosed allergies, the observed association between current asthma and indoor exposure to A alternata was not modified by atopy. Although fungal allergens are known to induce IgE-mediated hypersensitivity, exposure to fungi can induce non–IgE-mediated inflammatory and immunological processes; particulates derived from fungi contain a variety of biologically active molecules, not only allergens.2,36 It has been suggested that fungal exposure may promote adjuvant effects on allergic immune responses.37 Fungal proteases may also interact directly with airway epithelium. For example, a recent study showed that proteases present in A alternata extracts induced morphological changes, cell desquamation, and production of proinflammatory cytokines.38
Absence of standardized measurement techniques for evaluation of fungal allergen exposures has been a major constraint in risk assessment. Because interpretation of fungal exposure data is both complex and contentious, no exposure thresholds exist. Although mAb-based assays are more sensitive and specific for a single allergenic protein (eg, Alt a 1), allergenic fungi express great variability in allergen profiles depending on the environmental conditions under which they grow.17,25 Some previous studies have had difficulties in detecting Alternaria allergens in environmental samples with mAb-based assays, even among populations in which Alternaria sensitivity and exposure to Alternaria spores are known to be common.22,39,40 We measured concentrations of A alternata antigens in dust with a polyclonal anti–A alternata antibody assay, which was the best available assay at the time of the survey. Because the polyclonal rabbit anti–A alternata antibodies (Greer Laboratories, Inc) were raised against the cellular antigens derived from whole mycelial extracts of A alternata, they bind to a variety of antigenic components, including, but not limited to, known allergens. Although the possibility of cross-reactivity cannot be excluded in the current study, monoclonal fungal antibodies can also have widespread cross-reactivity.41 It is also worth noting that the diagnosis of Alternaria-induced allergy and asthma has largely relied on the use of crude filtrate and mycelial extracts of A alternata, which are variable and lack standardization.
Although the most intense exposure to Alternaria occurs outdoors during summer and fall months when the atmospheric spore counts peak,1 our findings suggest that indoor exposure may contribute to perennial asthma symptoms independently. It is unlikely that the indoor level of Alternaria is a surrogate for outdoor levels because the indoor levels of Alternaria did not reflect the seasonal patterns that are typical of outdoor levels (see this article's Table E2 in the Online Repository at www.jacionline.org). In agreement with previous studies,28,42-44 we have recently shown that regional factors, housing characteristics, and occupants' behavior can significantly affect indoor fungal levels.24
A key difficulty in all epidemiological studies that examine asthma prevalence has been the problem of validation, because there is no gold standard for asthma. In this study, asthma-related outcomes were based on self-reported symptoms, diagnosis, and medication use, which may introduce bias. However, prevalence of asthma in the study population did not significantly differ from that in other national prevalence estimates (eg, ever-diagnosed and current asthma).26
We acknowledge that the cross-sectional nature of the study is a limitation. We focused primarily on active asthma symptoms in the past 12 months, because the temporal relationship between outcomes and exposures can be difficult to determine in cross-sectional studies. We lacked detailed sensitization data (eg, skin prick test, specific IgE), but on the other hand, the association between current asthma and Alternaria levels was not modified by atopic status. To characterize the exposure in detail, we assessed exposure levels across multiple household sites. Although we were not able to assess seasonal variability in Alternaria levels in individual homes, sampling in the survey was conducted throughout summer, fall, and winter months in each geographic region to capture seasonal variation in the data. Settled dust samples are often thought to be less influenced by temporal and spatial variability, are reproducible, and represent long-term exposure better than short-term air sampling, although there is no clear agreement how to assess fungal exposure over time.21,45 For other common indoor allergens, however, measurement of allergen concentration in reservoir dust has generally been used as the standard index of exposure.
One of the main strengths of this study is that the survey sample is nationally representative. The weighted characteristics of the survey sample, including distributions of housing characteristics, socioeconomic, and demographic factors, were very similar to characteristics obtained from other national surveys.23 The NSLAH is the first population-based study that not only measured antigenic and allergenic components of A alternata but also simultaneously estimated levels of other common indoor allergens and endotoxin in the US housing stock.
This study provides new information on Alternaria exposures in relation to asthma, suggesting that indoor exposure to A alternata antigens is associated with active asthma symptoms. To determine clinically relevant exposure levels in indoor environments, further research is warranted, because immunoassays that are used to assess fungal allergen exposures have not achieved the same reliability as have similar assays for other allergens.1 However, avoidance of asthma triggers has been a fundamental part of treatment of patients with asthma.46,47 Although it is essential to restrict outdoor exposure to Alternaria when atmospheric concentrations of spores are high, measures that reduce indoor exposure to Alternaria may also help control asthma exacerbations, especially among Alternaria-sensitive individuals. Indoor levels of A alternata antigens are influenced by both regional and residential factors, of which some are modifiable.24 Subjects with asthma are likely to benefit from preventing mold and moisture-related problems and having their homes cleaned on a regular basis, because these measures may not only reduce Alternaria antigen levels but also lower levels of other potential asthma triggers in the home.
We acknowledge Westat Inc for their assistance with conduct of the field component of the survey. We thank Drs Steve Kleeberger and Donna Baird for their helpful comments.
Acknowledgments
Supported in part by the Intramural Research Program of the National Institutes of Health, National Institute of Environmental Health Sciences, and by the US Department of Housing and Urban Development.
Abbreviations used
- GSE
Geometric standard error of mean
- NSLAH
National Survey of Lead and Allergens in Housing
- OR
Odds ratio
Footnotes
Disclosure of potential conflict of interest: The authors have declared that they have no conflict of interest.
REFERENCES
- 1.Bush RK, Prochnau JJ. Alternaria-induced asthma. J Allergy Clin Immunol. 2004;113:227–34. doi: 10.1016/j.jaci.2003.11.023. [DOI] [PubMed] [Google Scholar]
- 2.Committee on the assessment of asthma and indoor air . Clearing the air: asthma and indoor exposures. National Academy Press; Washington (DC): 2000. Indoor Biologic Exposures. pp. 105–222. [Google Scholar]
- 3.Black PN, Udy AA, Brodie SM. Sensitivity to fungal allergens is a risk factor for life-threatening asthma. Allergy. 2000;55:501–4. doi: 10.1034/j.1398-9995.2000.00293.x. [DOI] [PubMed] [Google Scholar]
- 4.Delfino RJ, Zeiger RS, Seltzer JM, Street DH, Matteucci RM, Anderson PR. The effect of outdoor fungal spore concentrations on daily asthma severity. Environ Health Perspect. 1997;105:622–35. doi: 10.1289/ehp.97105622. [DOI] [PMC free article] [PubMed] [Google Scholar]
- 5.Downs SH, Mitakakis TZ, Marks GB, Car NG, Belousova EG, Leuppi JD. Clinical importance of Alternaria exposure in children. Am J Respir Crit Care Med. 2001;164:455–9. doi: 10.1164/ajrccm.164.3.2008042. [DOI] [PubMed] [Google Scholar]
- 6.Halonen M, Stern DA, Wright AL, Taussig LM, Martinez FD. Alternaria as a major allergen for asthma in children raised in a desert environment. Am J Respir Crit Care Med. 1997;155:1356–61. doi: 10.1164/ajrccm.155.4.9105079. [DOI] [PubMed] [Google Scholar]
- 7.Neukirch C, Henry C, Leynaert B, Liard R, Bousquet J, Neukirch F. Is sensitization to Alternaria alternata a risk factor for severe asthma? a population-based study. J Allergy Clin Immunol. 1999;103:709–11. doi: 10.1016/s0091-6749(99)70247-2. [DOI] [PubMed] [Google Scholar]
- 8.O'Hollaren MT, Yunginger JW, Offord KP, Somers MJ, O'Connell EJ, Ballard DJ. Exposure to an aeroallergen as a possible precipitating factor in respiratory arrest in young patients with asthma. N Engl J Med. 1991;324:359–63. doi: 10.1056/NEJM199102073240602. [DOI] [PubMed] [Google Scholar]
- 9.Arbes SJ, Sever M, Mehta J, Collette N, Thomas B, Zeldin DC. Exposure to indoor allergens in day-care facilities: results from 2 North Carolina counties. J Allergy Clin Immunol. 2005;116:133–9. doi: 10.1016/j.jaci.2005.04.022. [DOI] [PubMed] [Google Scholar]
- 10.Barnes C, Tuck J, Simon S, Pacheco F, Hu F, Portnoy J. Allergenic materials in the house dust of allergy clinic patients. Ann Allergy Asthma Immunol. 2001;86:517–23. doi: 10.1016/S1081-1206(10)62899-2. [DOI] [PubMed] [Google Scholar]
- 11.Corden J, Millington W. The long-term trends in seasonal variation of the aeroallergen Alternaria in Derby, UK. Aerobiologia. 2001;17:127–36. [Google Scholar]
- 12.Perzanowski MS, Sporik R, Squillace SP, Gelber LE, Call R, Carter M. Association of sensitization to Alternaria allergens with asthma among school-age children. J Allergy Clin Immunol. 1998;101:626–32. doi: 10.1016/S0091-6749(98)70170-8. [DOI] [PubMed] [Google Scholar]
- 13.Licorish K, Novey HS, Kozak P, Fairshter RD, Wilson AF. Role of Alternaria and Penicillium spores in the pathogenesis of asthma. J Allergy Clin Immunol. 1985;76:819–25. doi: 10.1016/0091-6749(85)90755-9. [DOI] [PubMed] [Google Scholar]
- 14.Mitakakis TZ, Tovey ER, Xuan W, Marks GB. Personal exposure to allergenic pollen and mould spores in inland New South Wales, Australia. Clin Exp Allergy. 2000;30:1733–9. doi: 10.1046/j.1365-2222.2000.00966.x. [DOI] [PubMed] [Google Scholar]
- 15.Bush RK, Portnoy JM. The role and abatement of fungal allergens in allergic diseases. J Allergy Clin Immunol. 2001;107:S430–40. doi: 10.1067/mai.2001.113669. [DOI] [PubMed] [Google Scholar]
- 16.Burge HA, Rogers CA. Outdoor allergens. Environ Health Perspect. 2000;108(suppl 4):653–9. doi: 10.1289/ehp.00108s4653. [DOI] [PMC free article] [PubMed] [Google Scholar]
- 17.Horner WE, Helbling A, Salvaggio JE, Lehrer SB. Fungal allergens. Clin Microbiol Rev. 1995;8:161–79. doi: 10.1128/cmr.8.2.161. [DOI] [PMC free article] [PubMed] [Google Scholar]
- 18.Green BJ, Mitakakis TZ, Tovey ER. Allergen detection from 11 fungal species before and after germination. J Allergy Clin Immunol. 2003;111:285–9. doi: 10.1067/mai.2003.57. [DOI] [PubMed] [Google Scholar]
- 19.Green BJ, Sercombe JK, Tovey ER. Fungal fragments and undocumented conidia function as new aeroallergen sources. J Allergy Clin Immunol. 2005;115:1043–8. doi: 10.1016/j.jaci.2005.02.009. [DOI] [PubMed] [Google Scholar]
- 20.Barnes C, Schreiber K, Pacheco F, Landuyt J, Hu F, Portnoy J. Comparison of outdoor allergenic particles and allergen levels. Ann Allergy Asthma Immunol. 2000;84:47–54. doi: 10.1016/S1081-1206(10)62740-8. [DOI] [PubMed] [Google Scholar]
- 21.Portnoy JM, Barnes CS, Kennedy K. Sampling for indoor fungi. J Allergy Clin Immunol. 2004;113:189–98. doi: 10.1016/j.jaci.2003.11.021. [DOI] [PubMed] [Google Scholar]
- 22.Vailes L, Sridhara S, Cromwell O, Weber B, Breitenbach M, Chapman M. Quantitation of the major fungal allergens, Alt a 1 and Asp f 1, in commercial allergenic products. J Allergy Clin Immunol. 2001;107:641–6. doi: 10.1067/mai.2001.114118. [DOI] [PubMed] [Google Scholar]
- 23.Vojta PJ, Friedman W, Marker DA, Clickner R, Rogers JW, Viet SM. First National Survey of Lead and Allergens in Housing: survey design and methods for the allergen and endotoxin components. Environ Health Perspect. 2002;110:527–32. doi: 10.1289/ehp.02110527. [DOI] [PMC free article] [PubMed] [Google Scholar]
- 24.Salo PM, Yin M, Arbes SJ, Jr, Cohn RD, Sever M, Muilenberg M. Dustborne Alternaria alternata antigens in US homes: results from the National Survey of Lead and Allergens in Housing. J Allergy Clin Immunol. 2005;116:623–9. doi: 10.1016/j.jaci.2005.05.030. [DOI] [PMC free article] [PubMed] [Google Scholar]
- 25.Portnoy J, Pacheco F, Barnes C, Upadrashta B, Crenshaw R, Esch R. Selection of representative Alternaria strain groups on the basis of morphology, enzyme profile, and allergen content. J Allergy Clin Immunol. 1993;91:773–82. doi: 10.1016/0091-6749(93)90197-n. [DOI] [PubMed] [Google Scholar]
- 26.Asthma: National Health Interview Survey Data. Center for Disease Control and Prevention; Atlanta (GA): 2005. Available at: http://www.cdc.gov/asthma/NHIS/default.htm . Accessed November 23, 2005. [Google Scholar]
- 27.Britton J. Symptoms and objective measures to define the asthma phenotype. Clin Exp Allergy. 1998;28(suppl 1):2–7. doi: 10.1046/j.1365-2222.1998.0280s1002.x. [DOI] [PubMed] [Google Scholar]
- 28.Shelton BG, Kirkland KH, Flanders WD, Morris GK. Profiles of airborne fungi in buildings and outdoor environments in the United States. Appl Environ Microbiol. 2002;68:1743–53. doi: 10.1128/AEM.68.4.1743-1753.2002. [DOI] [PMC free article] [PubMed] [Google Scholar]
- 29.Leech JA, Nelson WC, Burnett RT, Aaron S, Raizenne ME. It's about time: a comparison of Canadian and American time-activity patterns. J Expo Anal Environ Epidemiol. 2002;12:427–32. doi: 10.1038/sj.jea.7500244. [DOI] [PubMed] [Google Scholar]
- 30.Andersson M, Downs S, Mitakakis T, Leuppi J, Marks G. Natural exposure to Alternaria spores induces allergic rhinitis symptoms in sensitized children. Pediatr Allergy Immunol. 2003;14:100–5. doi: 10.1034/j.1399-3038.2003.00031.x. [DOI] [PubMed] [Google Scholar]
- 31.Stark PC, Celedon JC, Chew GL, Ryan LM, Burge HA, Muilenberg ML. Fungal levels in the home and allergic rhinitis by 5 years of age. Environ Health Perspect. 2005;113:1405–9. doi: 10.1289/ehp.7844. [DOI] [PMC free article] [PubMed] [Google Scholar]
- 32.Berger WE. Overview of allergic rhinitis. Ann Allergy Asthma Immunol. 2003;90:7–12. doi: 10.1016/s1081-1206(10)61653-5. [DOI] [PubMed] [Google Scholar]
- 33.Greisner WA, 3rd, Settipane RJ, Settipane GA. Natural history of hay fever: a 23-year follow-up of college students. Allergy Asthma Proc. 1998;19:271–5. doi: 10.2500/108854198778557728. [DOI] [PubMed] [Google Scholar]
- 34.Arbes SJ, Jr, Gergen PJ, Elliott L, Zeldin DC. Prevalences of positive skin test responses to 10 common allergens in the US population: results from the third National Health and Nutrition Examination Survey. J Allergy Clin Immunol. 2005;116:377–83. doi: 10.1016/j.jaci.2005.05.017. [DOI] [PubMed] [Google Scholar]
- 35.Gergen PJ, Turkeltaub PC. The association of individual allergen reactivity with respiratory disease in a national sample: data from the second National Health and Nutrition Examination Survey, 1976−80 (NHANES II). J Allergy Clin Immunol. 1992;90:579–88. doi: 10.1016/0091-6749(92)90130-t. [DOI] [PubMed] [Google Scholar]
- 36.Portnoy JM, Kwak K, Dowling P, VanOsdol T, Barnes C. Health effects of indoor fungi. Ann Allergy Asthma Immunol. 2005;94:313–9. doi: 10.1016/S1081-1206(10)60982-9. [DOI] [PubMed] [Google Scholar]
- 37.Instanes C, Ormstad H, Rydjord B, Wiker HG, Hetland G. Mould extracts increase the allergic response to ovalbumin in mice. Clin Exp Allergy. 2004;34:1634–41. doi: 10.1111/j.1365-2222.2004.02076.x. [DOI] [PubMed] [Google Scholar]
- 38.Kauffman HF, Tomee JF, van de Riet MA, Timmerman AJ, Borger P. Protease-dependent activation of epithelial cells by fungal allergens leads to morphologic changes and cytokine production. J Allergy Clin Immunol. 2000;105:1185–93. doi: 10.1067/mai.2000.106210. [DOI] [PubMed] [Google Scholar]
- 39.Eggleston PA, Rosenstreich D, Lynn H, Gergen P, Baker D, Kattan M. Relationship of indoor allergen exposure to skin test sensitivity in inner-city children with asthma. J Allergy Clin Immunol. 1998;102:563–70. doi: 10.1016/s0091-6749(98)70272-6. [DOI] [PubMed] [Google Scholar]
- 40.O'Connor GT, Walter M, Mitchell H, Kattan M, Morgan WJ, Gruchalla RS. Airborne fungi in the homes of children with asthma in low-income urban communities: the Inner-City Asthma Study. J Allergy Clin Immunol. 2004;114:599–606. doi: 10.1016/j.jaci.2004.05.064. [DOI] [PubMed] [Google Scholar]
- 41.Schmechel D, Simpson JP, Lewis DM. The production and characterization of monoclonal antibodies to the fungus Aspergillus versicolor. Indoor Air. 2005;15(suppl 9):11–9. doi: 10.1111/j.1600-0668.2005.00340.x. [DOI] [PubMed] [Google Scholar]
- 42.Dharmage S, Bailey M, Raven J, Mitakakis T, Thien F, Forbes A. Prevalence and residential determinants of fungi within homes in Melbourne, Australia. Clin Exp Allergy. 1999;29:1481–9. doi: 10.1046/j.1365-2222.1999.00640.x. [DOI] [PubMed] [Google Scholar]
- 43.Garrett MH, Rayment PR, Hooper MA, Abramson MJ, Hooper BM. Indoor airborne fungal spores, house dampness and associations with environmental factors and respiratory health in children. Clin Exp Allergy. 1998;28:459–67. doi: 10.1046/j.1365-2222.1998.00255.x. [DOI] [PubMed] [Google Scholar]
- 44.Sterling DA, Lewis RD. Pollen and fungal spores indoor and outdoor of mobile homes. Ann Allergy Asthma Immunol. 1998;80:279–85. doi: 10.1016/S1081-1206(10)62971-7. [DOI] [PubMed] [Google Scholar]
- 45.Ren P, Jankun TM, Leaderer BP. Comparisons of seasonal fungal prevalence in indoor and outdoor air and in house dusts of dwellings in one Northeast American county. J Expo Anal Environ Epidemiol. 1999;9:560–8. doi: 10.1038/sj.jea.7500061. [DOI] [PubMed] [Google Scholar]
- 46.Chapman MD, Vailes LD, Ichikawa K. Immunoassays for indoor allergens. Clin Rev Allergy Immunol. 2000;18:285–300. doi: 10.1385/CRIAI:18:3:285. [DOI] [PubMed] [Google Scholar]
- 47.Platts-Mills TA. Allergen avoidance. J Allergy Clin Immunol. 2004;113:388–91. doi: 10.1016/j.jaci.2003.12.027. [DOI] [PubMed] [Google Scholar]