Abstract
Despite the knowledge that superficial zone chondrocytes (SZC, located within 100 μm of the articular surface) and deep zone chondrocytes (DZC, located near the calcified zone) have distinct phenotypes, previous studies on bone morphogenetic proteins (BMPs) have not differentiated its effects on SZC versus DZC. Using a pellet culture model we have compared phenotype, morphology and matrix accumulation in SZC and DZC with or without adenovirus-mediated overexpression of BMP-2 or -7 or the BMP antagonist Noggin. Greater accumulation of proteoglycan (PG)-rich matrix in the untreated DZC was associated with a hypertrophic phenotype with large cell diameters and high gene expression levels of runt-related transcription factor-2 (Runx2) as well as higher endogenous BMP activity. Noggin overexpression decreased matrix accumulation and cell diameters in SZC and DZC, confirming a role for endogenous BMP in both processes. In DZC, overexpression of either BMP2 or -7 increased cell diameter without increasing PG-rich matrix accumulation. In contrast, in SZC, BMP overexpression increased matrix accumulation and type II collagen gene expression without increasing cell diameter. These data indicate that differences in endogenous BMP activity level and responsiveness to BMPs define, in part, the differences between the SZC and DZC phenotype. They also suggest that SZC may be a more appropriate target for BMP therapy than DZC.
Keywords: superficial zone chondrocytes, bone morphogenetic proteins, noggin, hypertrophy
Introduction
Production and accumulation of extra-cellular matrix (ECM) by chondrocytes are critical to the successful repair and/or regeneration of cartilage tissue. We and others have previously reported that matrix metabolism is dependent on the spatial location of chondrocytes. Deep zone chondrocytes (DZC) isolated from the proteoglycan (PG)-rich radial zone (near the osteo-chondral interface) express higher levels of cartilage matrix genes and accumulate more PG than superficial zone chondrocytes (SZC) isolated from within 100 μm of the articular surface (Aydelotte et al., 1988; Aydelotte and Kuettner, 1988; Darling and Athanasiou, 2005b; Darling et al., 2004; Siczkowski and Watt, 1990; Sun and Kandel, 1999; Waldman et al., 2003; Zanetti et al., 1985). These observations suggest that the specific use of SZC and DZC may refine cell-based strategies for cartilage tissue regeneration. Indeed, several groups have attempted to layer SZC on top of DZC to engineer cartilage tissue with a morphology and function that is similar to normal cartilage (Kim et al., 2003; Klein et al., 2006; Klein et al., 2003).
Chondrocyte phenotype and matrix metabolism are also influenced by growth factors. In particular, we and others have shown the efficacy of bone morphogenetic protein-7 (BMP7, also known as osteogenic protein-1) in increasing matrix production in chondrocytes (Flechtenmacher et al., 1996; Hidaka et al., 2001; Huch et al., 1997; Masuda et al., 2006; Merrihew et al., 2003). The BMPs are a family of growth factors whose expression is critical for skeletal development, including the formation of the joints (Chubinskaya and Kuettner, 2003; Francis-West et al., 1999; Rosen, 2006). Several family members, including BMP7, are expressed in post-natal articular cartilage where they are important for cartilage ECM homeostasis (Chang et al., 1994; Chubinskaya and Kuettner, 2003; Chubinskaya et al., 2000; Rountree et al., 2004; Soder et al., 2005). Previously, we have reported increased matrix gene expression and matrix synthesis in chondrocytes overexpressing BMP7 (Hidaka et al., 2001). Furthermore, we showed that BMP7 overexpressing chondrocytes can be implanted into experimental cartilage defects to accelerate repair in vivo (Hidaka et al., 2003).
A limitation of our previous work, and that of other studies that have examined BMP treatment of chondrocytes, is that the potential differences in BMP effects on SZC and DZC were not investigated. The distinction is important as the use of BMPs and/or other growth factors in cell-based strategies for cartilage tissue engineering or regeneration cannot be optimized without specific knowledge about the potentially distinct effects of such factors on SZC versus DZC. Recent reports on the effects of other growth factors such as transforming growth factor β and insulin-like growth factor 1 indicate that chondrocyte sub-populations have zone-specific responses (Darling and Athanasiou, 2005a; Eleswarapu et al., 2006). In this study we compared morphology, gene expression, matrix accumulation and quality by SZC versus DZC in a scaffold-free in vitro model of cartilage-like tissue formation. We found that in addition to accumulating a greater amount of proteoglycan (PG)-rich matrix than SZC, that DZC had a relatively hypertrophic phenotype. To determine the extent to which BMP activation may be responsible for this difference we compared endogenous BMP activation levels in SZC and DZC and also compared effects of overexpressing BMP7, or a related family member BMP2, and one of its antagonists, Noggin in SZC and DZC. The DZC had higher baseline BMP activity, and overexpression of Noggin decreased matrix accumulation and cell diameters in SZC and DZC, confirming a role for endogenous BMP in both processes. Overexpression of BMPs did not enhance matrix accumulation in DZC, but did increase cell diameter. In contrast, BMP overexpression did increase matrix accumulation in SZC without inducing hypertrophy. Our data show the importance of BMP activity and responsiveness in defining the SZC and DZC phenotypes, and also suggest that SZC may be a more appropriate target for BMP therapy than DZC.
Results
Increased matrix accumulation in DZC is associated with a hypertrophic phenotype
After 1 week of culture pellets consisting of SZC or DZC harvested from the femoral condyles of young adult steer (18–36 mo) formed a tissue-like mass, characterized by rounded cells embedded in an alcian blue-positive proteoglycan (PG)-rich matrix that also stained positively for type II collagen (Figure 1 A – F). To quantify differences in the matrix quality between SZC and DZC pellets, sections were analyzed using fourier-transform infra-red imaging spectroscopy (FT-IRIS, Figure 1 G and H) (Camacho et al 2001; West et al., 2004). In agreement with the alcian blue-staining, comparison of the peak area measurements for proteoglycan (PG) and Amide 1 (Am1, mostly collagen) showed that DZC accumulated matrix has a higher PG:Am1 ratio than SZC (p<0.05, Figure 1 I). Cellularity in the DZC pellets was 1.5-fold lower than in SZC pellets, indicating greater matrix accumulation (p<0.05, Figure 1 J). No difference was detected in the total number of cells (calculated by multiplying cellularity and total pellet area) in SZC versus DZC constructs, suggesting that the lower cellularity in DZC did not indicate a difference in proliferation or survival in the sub-populations.
Figure 1.
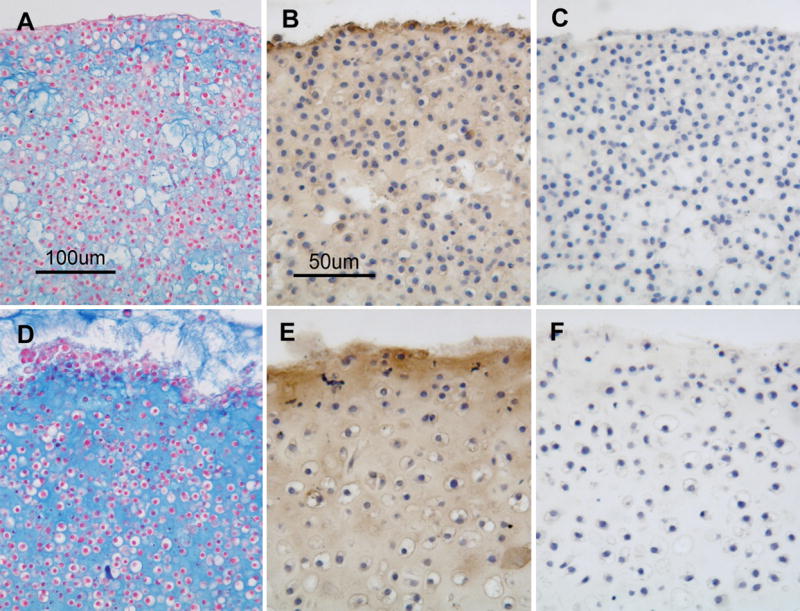
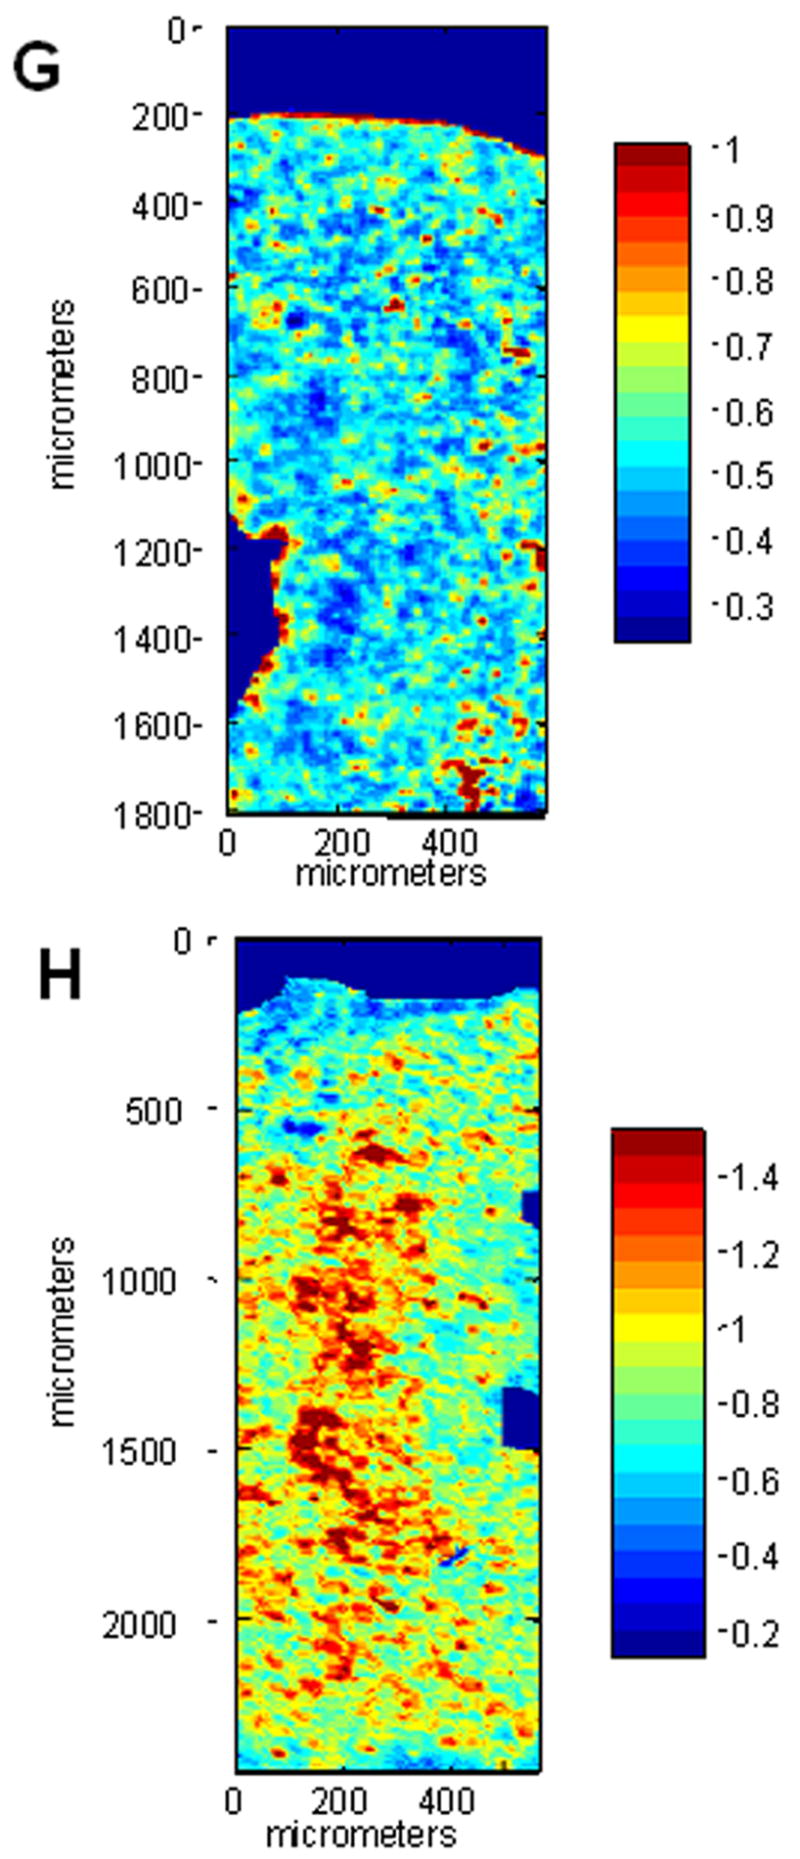
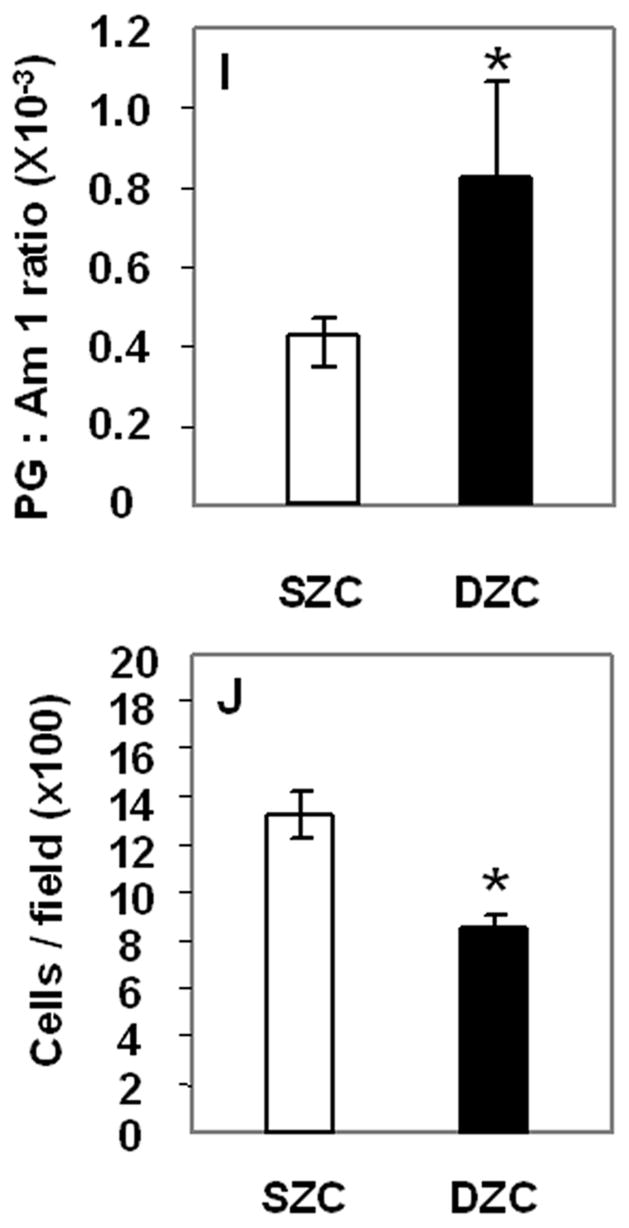
Greater proteoglycan (PG)-rich matrix accumulation in tissue formed by deep zone chondrocytes (DZC) versus superficial zone chondrocytes (SZC). Pellets were formed from SZC (A – C, G) and DZC (D – F, H) as described in Experimental Procedures and cultured for 7 days. Sections were stained with Alcian Blue (panels A and D; Bar=100μm) where (PGs)-rich matrix appears blue and nuclei appear red, or anti-type II collagen antibody (panels B and E; Bar=50μm) where positive type II collagen staining appears brown (DAB) and nuclei appear purple. As negative control for type II collagen staining, sections were stained with non-immune IgG (C and F) In sections analyzed by fourier-transform infrared imaging spectroscopy (FT-IRIS; panels G and H) red indicates regions with the highest ratio of PG to Amide 1 (mostly collagen). (G) Histomorphometric analysis showed that the DZC pellets had lower cellularity than SZC pellets, indicating a greater amount of matrix per cell. (H) Analysis of FT-IRIS showed that the matrix associated with DZC had a greater PG:Am1 ratio than that in SZC (H).
Despite the higher PG accumulation in DZC pellets, the aggrecan gene expression levels in SZC and DZC were similar (p>0.05, data not shown). Also, the level of type II collagen gene expression was 10-fold or 2-fold higher in DZC than SZC on day 0 and 7 respectively (p<0.01, data not shown). Gene expression levels of Sox 9, a transcriptional regulator or type II collagen gene expression did not differ between SZC and DZC on day 0 (p>0.05) but was 1.5-fold higher in DZC on day 7 (p<0.02, data not shown). The SZC maintained expression levels of superficial zone protein (SZP, a marker of SZCs) that was at least 5-fold or 21-fold higher than in DZC on day 0 and 7, respectively, indicating that SZCs maintained their specific phenotype over 7 days in culture. These data are in agreement with our previous findings (Hidaka et al, 2006).
The increased matrix accumulation in DZC pellets was associated with a hypertrophic phenotype. The average DZC diameter was approximately 5 μm greater than that of SZC (p<0.02, Figure 2 A). The DZC also expressed 130-fold or 55-fold greater levels of the runt-related transcription factor 2 (Runx2) than SZC on day 0 (p<0.02, Figure 2 B) and on day 7 (p<0.01), respectively. This magnitude of difference reflects a very low expression level by SZC, in which it was near the limit of detection (possibly not expressed) as Runx2 levels in DZC were not extremely high (about 100-fold lower than β-actin). Expression levels of alkaline phosphatase (ALP) were also 12-fold or 7-fold higher in DZC than SZC on day 0 or 7, respectively (p<0.01 both comparisons, Figure 2 C); however, expression levels of type X collagen were similar in SZC and DZC at both time points (p>0.05). These measurements confirmed that the hypertrophic appearance of DZC is correlated with increased gene expression of markers of chondrocyte hypertrophy.
Figure 2.
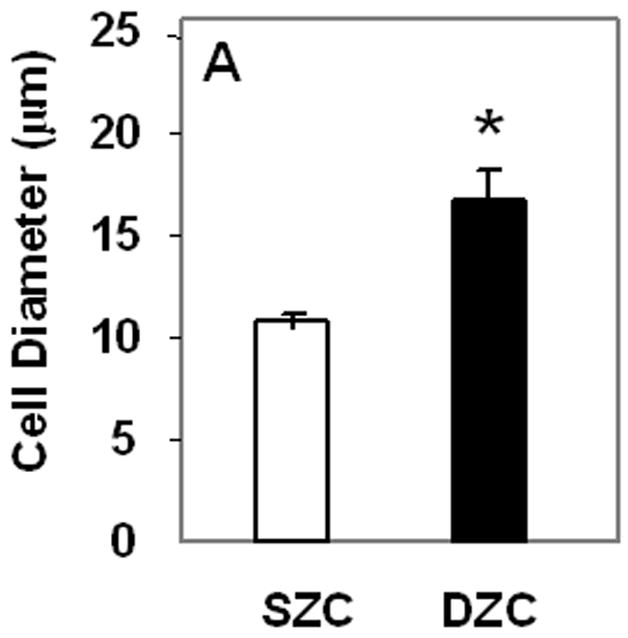
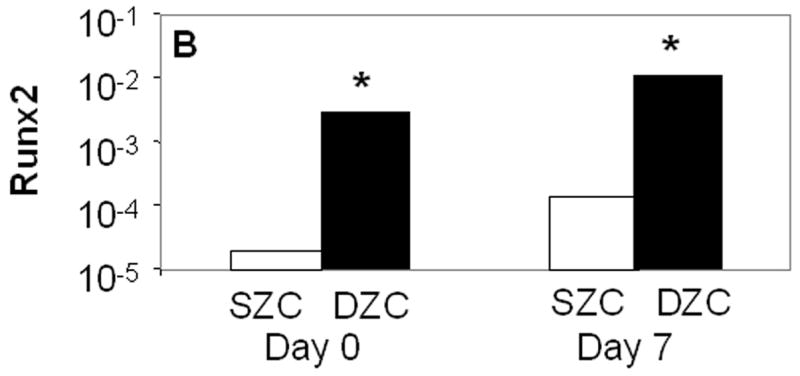
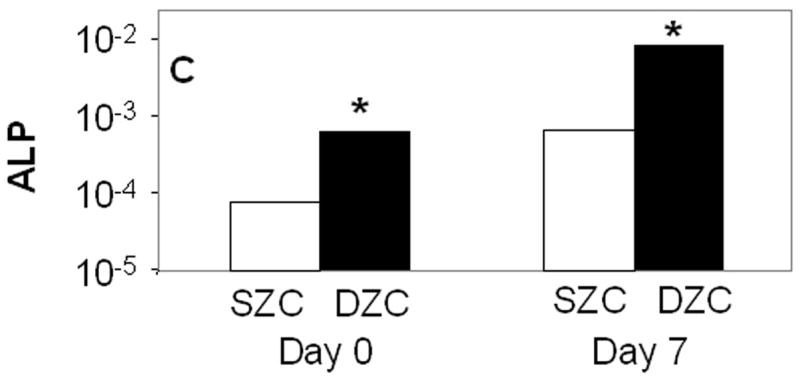
Hypertrophic phenotype of DZC. (A) Histomorphometric analysis (see Figure 1 legend and panels A and D) showed a larger average diameter of DZC versus SZC. Expression levels of markers of chondrocyte hypertrophy including (B) runt-related transcription factor-2 [Runx2] and (C) alkaline phosphatase [ALP] were measured in SZC and DZC immediately after harvest (day 0) or on day 7 of culture by qRT-PCR as described in Experimental Procedures and normalized to the expression level of β-actin gene. Both genes were more highly expressed in DZC than SZC. White bars represent SZC and black bars represent DZC. Each bar represents mean relative expression levels for 3 – 6 samples per group per time point. [*] indicate statistical significance with p<0.05. Error bars are not included as statistical significance was tested on ∆CT values based on which relative expression was calculated.
Higher endogenous BMP activity in DZC
To determine whether BMP activation may be responsible for the differences in the SZC and DZC phenotypes, expression levels of Noggin (a BMP antagonist) and phosphorylation of Smad (a BMP-induced intra-cellular signaling molecule) were compared in SZC and DZC. Expression levels of Noggin were 4-fold or 2-fold higher in DZC than SZC on day 0 and 7, respectively (p<0.01, Figure 3A). Noggin is upregulated through BMP activation in a negative feedback loop, and its expression is an indicator of BMP activation (Gazzero et al 1998). In untreated (naïve) DZC, the ratio of band intensities for phosphorylated Smad (pSmad, Figure 3B, lane 4) to total Smad (Figure 3C, lane 4) was 1.7-fold higher than in naïve naïve SZC (Figures 3B and C, lane 1), also indicating a greater level of endogenous BMP activation in DZC. Stimulation with exogenous recombinant human BMP2 (rhBMP2) increased the ratio from 1.1 to 1.2 in SZC and from 1.8 to 1.9 in DZC, indicating that both sub-populations could be stimulated by BMP. Addition of recombinant Noggin (rNoggin) decreased the ratio to 50% of untreated control in DZC, while only a 10% decrease occurred in SZC. These data confirm that while both cell types can be stimulated by exogenous BMP2, that DZC have a higher level of endogenous BMP activity.
Figure 3.
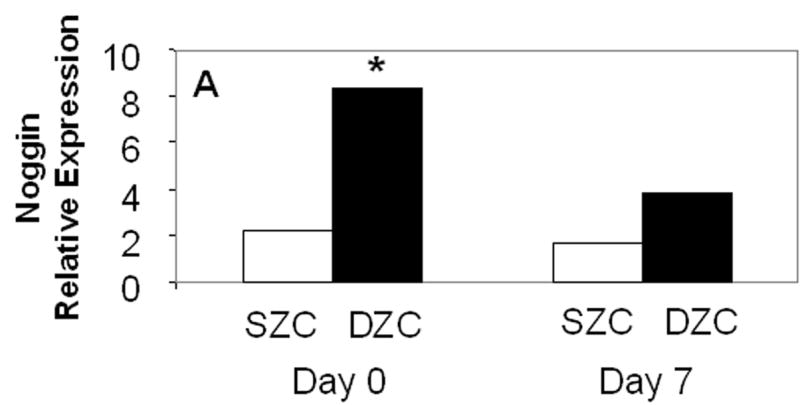
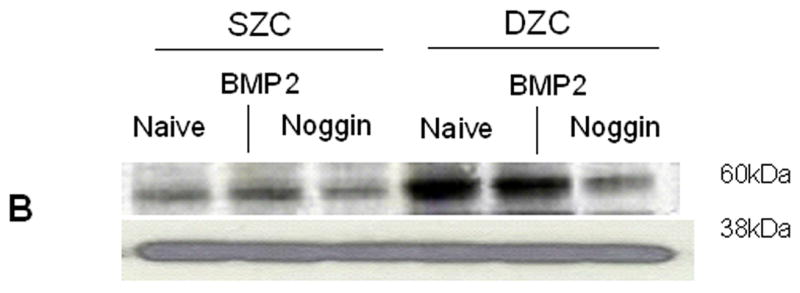
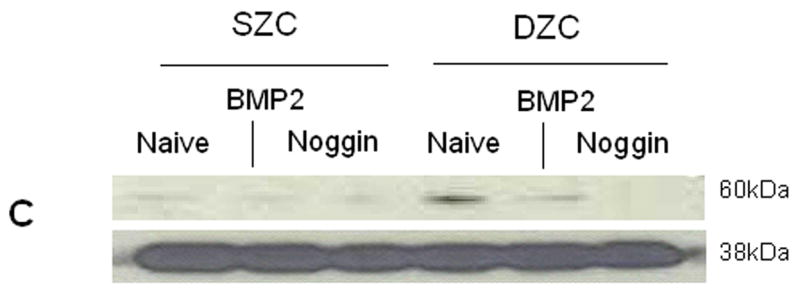
Elevated endogenous BMP activity in DZC. (A) Expression levels of Noggin, a BMP antagonist were compared in SZC and DZC immediately after harvest (day 0) or on day 7 of culture by qRT-PCR as described in Experimental Procedures. (B) Presence of phosphorylated (active) Smad 1/5/8 and (C) total Smad were compared in SZC and DZC that were treated with no growth factor (naïve) or with recombinant BMP2 (200 ng/ml) or recombinant Noggin (200 ng/ml) for 4 hr by Western blotting as described in Experimental Procedures. The pSmad1/5/8 and total Smad1 ran at 60kDa, while GAPDH (used as a loading control) ran at 38kDa.
BMP and Noggin overexpression in SZC and DZC
To elucidate the aspects of the chondrocyte phenotype that may be controlled by BMPs, SZC and DZC were genetically modified using adenovirus (Ad) vectors encoding BMP2 (AdBMP2) or BMP7 (AdBMP7) (Hidaka et al., 2001; Zhu et al., 2004) or Noggin (AdNoggin) (Lim et al, 2000), then maintained as pellet cultures for 7 days. As controls, cells were incubated with AdNull (encoding no transgene) or no virus (Naïve).
Treatment with AdBMP2 or -7 resulted in increased BMP protein production. Seven days after treatment, the AdBMP2-treated SZC and DZC pellets had accumulated a similar amount of BMP2 (p>0.05, Figure 4 A); however, the supernatant of the DZC cultures contained approximately 0.6 pg/cell more BMP2 than that of SZC cultures. The AdBMP7-treated cultures produced about 10-fold less BMP than AdBMP2-treated cultures. Also, while total BMP7 detected in the pellet and media together were similar in AdBMP7-treated SZC and DZC, the SZC pellets had approximately 50% less BMP7 than that which was associated with DZC pellets (Figure 4 B).
Figure 4.
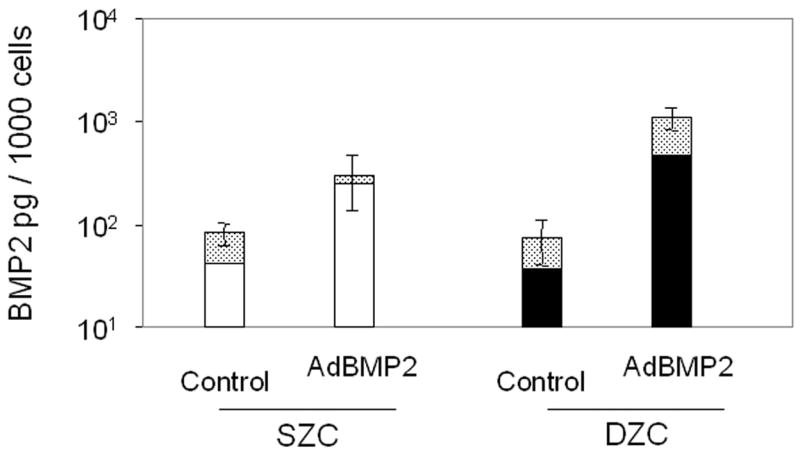
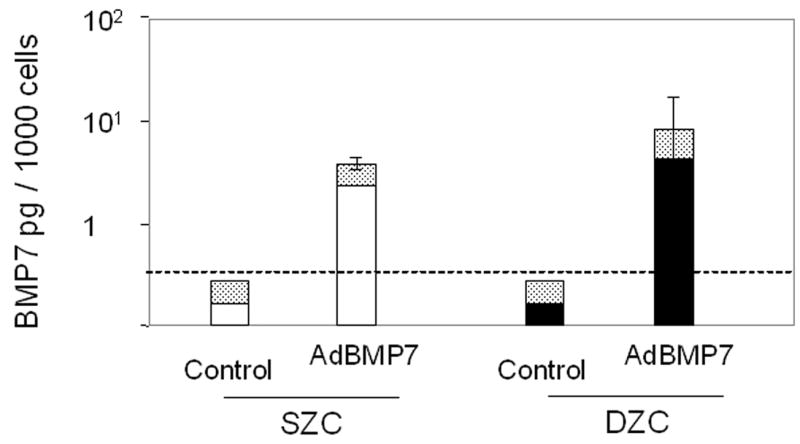
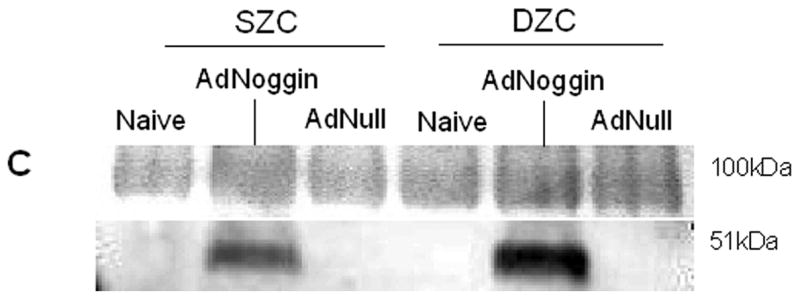
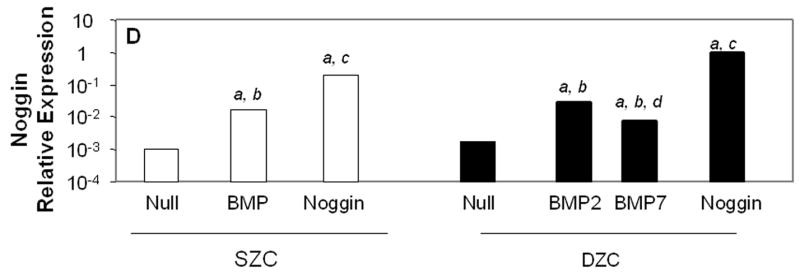
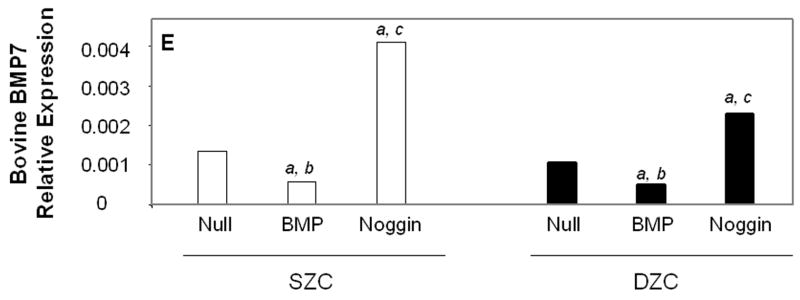
Transgene expression by Ad-modified chondrocytes. Amount of (A) human BMP2 or (B) human BMP7 was measured in lysates and supernatants of pellets formed from SZC and DZC treated with adenovirus encoding BMP2 (AdBMP2), AdBMP7 or as controls, adenovirus with no transgene (AdNull) days 7 of culture by enzyme linked immunosorbant assay (ELISA) and normalized for total pellet DNA as described in Experimental Procedures. White bars represent SZC and black bars represent DZC pellets. Shaded portion of each bar represents the amount of BMP in the supernatants associated with that culture. For BMP7, dotted line indicates the limit of detection. Each bar represents mean ± standard deviation (SD) for 3 – 6 samples per treatment group. Differences between AdBMP-treated and control cells were significant (p<0.01). (C) Presence of Noggin dimer (approximately 51kDa) was detected in the supernatants of SZC and DZC treated with AdNoggin on day 7 of culture by Western blotting as described in Experimental Procedures. A Ponceau stain-positive, 100kDa band served as a loading control. As expected, untreated and AdNull treated cells did not have detectable levels of Noggin. (D) Expression levels of Noggin were measured using primers that detected endogenous bovine Noggin as well as the transgene (murine Noggin), and levels of BMP7 were measured using primers recognizing (E) endogenous bovine BMP7 (bBMP7), but not hybridizing with the human cDNA transgene, in SZC and DZC 7 days after treatment with Adenovirus (Ad) vectors encoding no transgene (Null), BMP2, BMP-7 or Noggin by qRT-PCR. [a], [b] and [c] indicate statistical significance with p<0.02 compared to control, Noggin or BMP, respectively. For SZC, but not DZC, expression levels of Noggin in response to BMP2 and -7 overexpression were similar (p>0.01).
Noggin was detectable as a 51 kDa dimer in the supernatants of SZC and DZC 7 days after treatment with AdNoggin (Figure 4 C), and levels were similar between sub-populations as determined by densitometry (p>0.05). Homogenates of the pellet did not contain levels of Noggin that were detectable by Western blotting (data not shown). As expected, Noggin gene expression levels were increased in response to BMP overexpression (Figure 4 D). Gene expression levels of Noggin rose by 17-fold in response to either BMP2 or BMP7 overexpression in SZC (p<0.01, both comparisons) and in DZC in response to BMP2 overexpression (p<0.01). Noggin expression rose only 4.5-fold in response to BMP7 in DZC (p<0.01, both comparisons); however, this may have been due to the low level of BMP7 overexpression in DZC. In AdNoggin-treated SZC and DZC, Noggin expression levels were 200-fold or 500-fold greater, respectively, than their AdNull controls (p<0.01). These measurements indicate a continued robust transgene expression after 7 days, as our primers hybridized to mouse Noggin (transgene) as well as bovine Noggin (endogenous).
Endogenous, bovine BMP2 (bBMP2) and bBMP7 gene expression levels were measured using primers that did not cross hybridize with the human BMP transgenes. These measurements showed that, at baseline, bBMP2 was expressed at approximately 90-fold higher levels than bBMP7 (p<0.02) but that these levels did differ between SZC and DZC. Overexpression of BMP2 or -7 downregulated bBMP7 expression by 2.5-fold in SZC and DZC (p<0.05, Figure 4 D); but bBMP2 expression was not affected (data not shown). A surprising finding was the approximately 3-fold increase in bBMP2 and bBMP7 by Noggin overexpression in SZC and DZC (p<0.01, all comparisons, bBMP2 data not shown)
BMPs support matrix accumulation in SZC and DZC
After 7 days of culture, the appearance of pellets formed from AdNull (control vector)-treated cells were similar to those formed from untreated SZC and DZC (Figures 5 A – D). In SZC, but not DZC, overexpression of BMP2 increased matrix accumulation (Figures 5 E – H), but did not alter the extent of staining for type II collagen antibody. Despite differences in levels of BMP2 and -7 production, effects of BMP7 overexpression on matrix accumulation and pellet morphology were similar (p>0.05 all comparisons). Compared to AdNull-treated controls, BMP-2 or -7 overexpressing SZC pellets had 2.5-fold lower cellularity and 2-fold greater pellet diameter (p<0.05, both comparisons, Table 1). Assessment of matrix quality by FT-IRIS showed that BMP overexpression increased the PG:Am1 ratio by 3.7-fold in SZC (p<0.05); and that the ratio was, furthermore, similar to the matrix produced by BMP-treated or untreated DZC. In contrast to SZC, cellularity, pellet diameter and matrix quality of DZC pellets were not affected by BMP overexpression in DZC (p>0.05 all comparisons, Table 1). The Noggin overexpressing SZC and DZC formed pellets with open spaces that did not stain with alcian blue or anti-type II collagen antibody (Figures 5 I – L). Although matrix accumulation was apparently decreased, cellularity measurements were not different from AdNull-treated controls due to the spaces between cells (p<0.05, Table 1). These data indicate that BMPs are necessary for matrix accumulation, but that SZC are preferentially stimulated to increase PG accumulation by exogenous BMPs.
Figure 5.
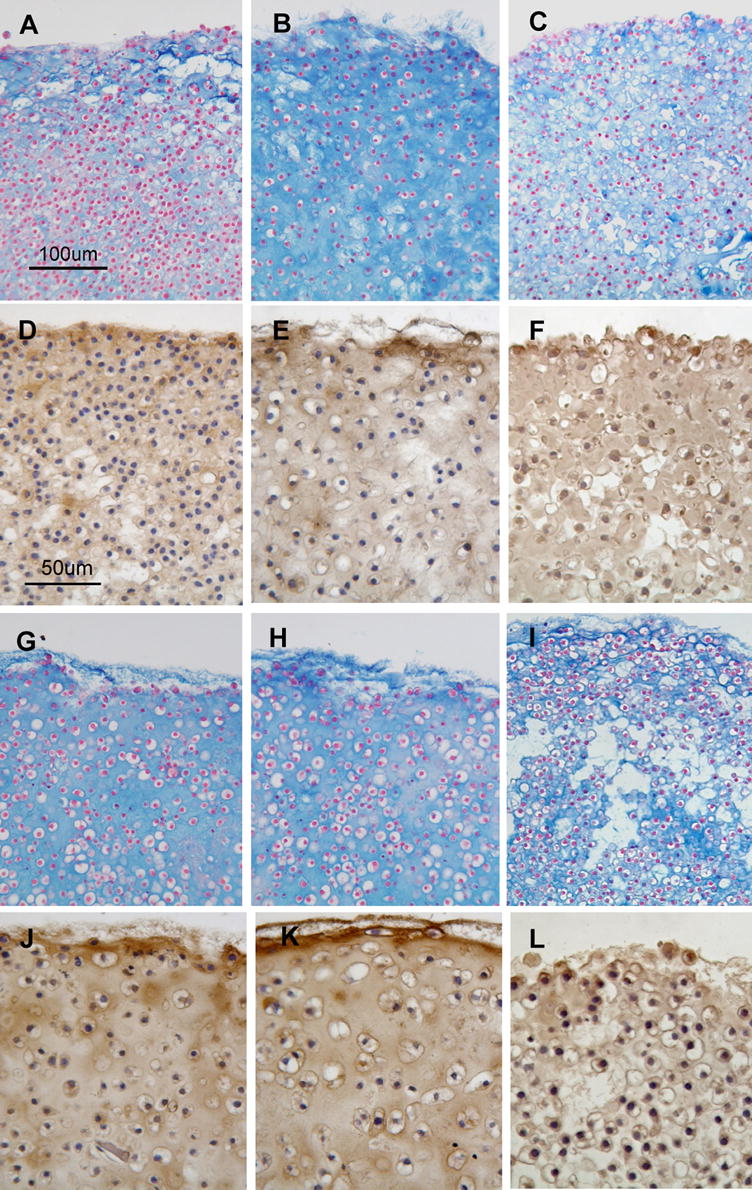
Appearance of cartilage-like tissue formed from SZC (A-F) and DZC (G-L) treated with Ad vectors encoding no transgene (AdNull, panels A, D, G, J), BMP2 (B, E, H, K) or Noggin (C, F, I, L) and stained with Alcian Blue (A – C, G - I) or anti-type II collagen antibody (D – F, J - L). Pellets formed from AdNull-treated SZC and DZC (A, D, G, J) were similar to those formed from untreated cells. Treatment of SZC with AdBMP increased the accumulation of Alcian Blue-positive matrix (B), but did not alter type II collagen staining (E). Treatment of DZC with AdBMP (H, K) had little effect. Treatment of SZC and DZC with Noggin (C, F, I, L) resulted in pellets with voids that lacked matrix. Noggin overexpressing SZC and DZC also had increased type II collagen staining intra-cellularly and decreased staining in the matrix (F, L).
Table 1.
Morphology, matrix accumulation and matrix quality in cartilage-like tissue formed by SZC and DZC overexpressing bone morphogenetic protein (BMP) or Noggin1
| Control | BMP | Noggin | |
|---|---|---|---|
| Cell Diameter (μm)2 | |||
| SZC | 12.8 ± 2.2 | 15.2 ± 0.7 | 10.0 ± 0.3* |
| DZC | 15.2 ± 2.0 | 20.9 ± 1.0 (BMP2)*
17.7 ± 0.6 (BMP7)* |
11.4 ± 0.5* |
| Cellularity (cells per field) | |||
| SZC | 1238 ± 423 | 520 ± 77* | 735 ± 97* |
| DZC | 898 ± 336** | 721 ± 316 | 899 ± 350 |
| Pellet Area (μm2) | |||
| SZC | 2.0 ± 0.7 | 4.6 ± 1.5* | 2.2 ± 0.3 |
| DZC | 3.3 ± 1.0 | 4.0 ± 1.2 | 1.9 ± 1.9 |
| PG:Am1 Ratio (×10−3)3 | |||
| SZC | 0.47 ± 0.17 | 1.67 ± 0.45* | NA |
| DZC | 0.96 ± 0.67 | 1.00 ± 0.52 | NA |
The SZC and DZC were treated with adenovirus vectors encoding no transgene (Control), BMP2, BMP7 or Noggin and maintained as pellet cultures for 7 days as described in Experimental Procedures. Tissues were harvested and fixed sections were analyzed by light microscopy and fourier-transform infra-red imaging spectroscopy (FT-IRIS). Where measurements for BMP2 and -7 overexpressing samples were similar, values were analyzed as a single group (BMP).
Histomorphometric measurements including cell diameter, cell number per field (cellularity) and pellet area were made on sections stained with alcian blue and nuclear fast red as described in Experimental Procedures. Measurements were made in at least 6 sections per pellet in 3 – 6 pellets per group. Mean ± standard deviation are shown. [*] indicates statistically significant differences with p<0.05 compared to its own Control. [**] indicates statistically significant difference with p<0.05 compared to SZC Control.
Matrix quality was assessed by FT-IRIS as described in Experimental Procedures. The ratio of peak area measurements for proteoglycan (PG) and Amide 1 (Am1, mostly collagen) was calculated and normalized to the number of cells per field. Measurements were made in 3 – 6 pellets per group. Mean ± standard deviation are shown. [*] indicates statistically significant differences with p<0.05 compared to Control. [**] indicates statistically significant differences with p<0.02 compared to all other groups.
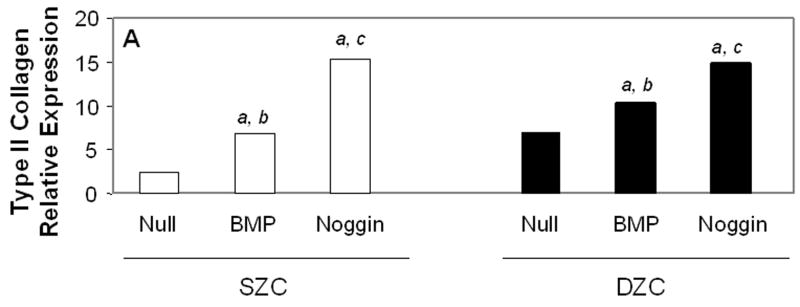
Measurements of matrix gene expression also showed a preferential responsiveness of SZC to BMP overexpression; however, effects of Noggin overexpression in SZC and DZC were surprising. Overexpression of BMP2 or -7 increased type II collagen gene expression in SZC by approximately 3-fold (p<0.02, Figure 6 A). In contrast, BMP2 overexpression by DZC increased type II collagen expression by only about 30% (p<0.05), and that of BMP7 had no significant effect (p>0.05). Surprisingly, Noggin overexpression also increased type II collagen gene expression by 6-fold and 2-fold in SZC and DZC, respectively (p<0.01). Aggrecan gene expression levels were increased by 2 – 2.5-fold in SZC and DZC by BMP2 or -7 and Noggin overexpression (p<0.02, all comparisons, Figure 6 B). Expression levels of Sox 9 were not affected by overexpression of BMPs in either sub-population, but was increased by about 2-fold in SZC and DZC in response to Noggin overexpression (p<0.02, both comparisons, Figure 6 C). This rise in Sox 9 expression correlated with a 20-fold increase in the ratio of type II: type I collagen gene expression that was induced in SZC and DZC by AdNoggin (p<0.01, both comparisons, Figure 6 C), but not by AdBMPs. Overexpression of BMPs did not affect SZP levels in SZC (p>0.05 versus AdNull or untreated control, Figure 6 E); however, overexpression of BMP7 (but not BMP2) decreased it 20-fold in DZC. An unexpected 3-fold increase in SZP was detected in Noggin overexpressing SZC, but not DZC (p>0.02 versus AdNull or untreated control). These data show a preferential increase in type II collagen gene expression by SZC in response to BMPs and an unexpected increase in matrix gene expression in SZC and DZC in response to Noggin.
Figure 6.
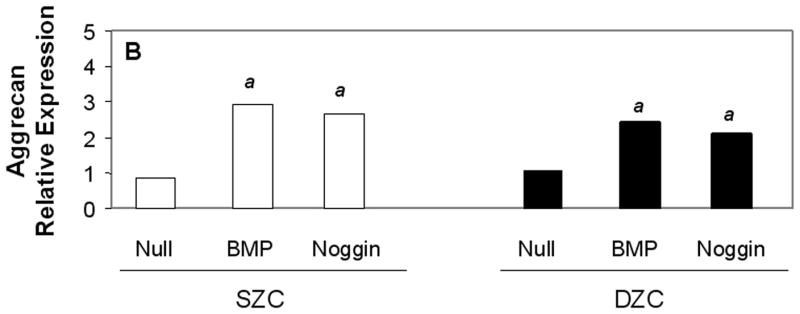
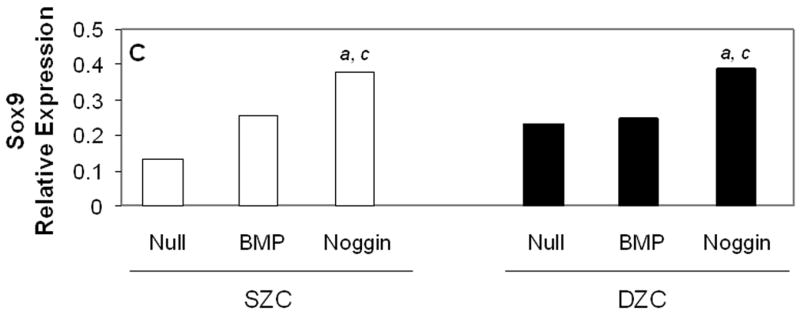
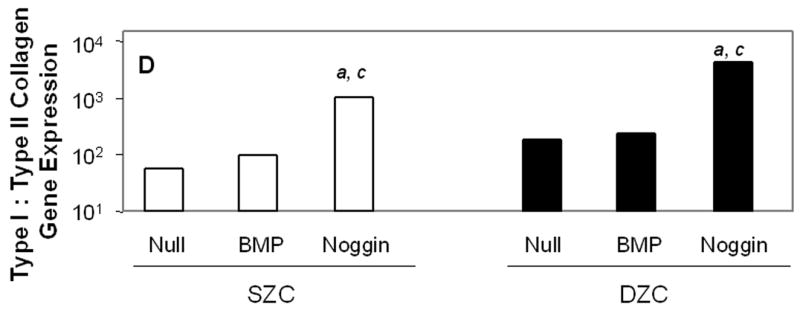
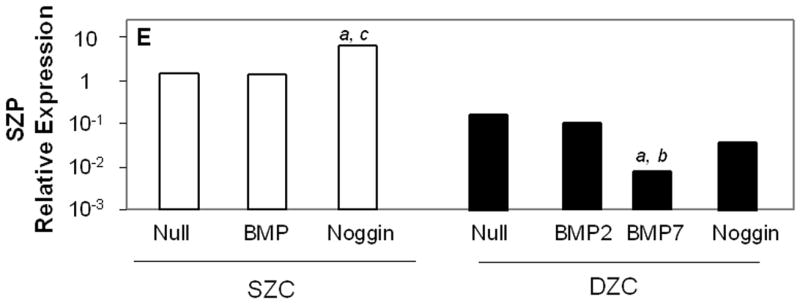
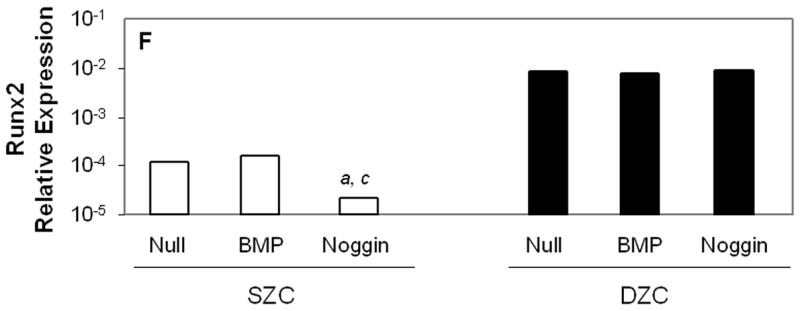
Gene expression patterns in SZC and DZC treated with Ad vectors encoding no transgene (Null), BMP2 or -7 (BMP) or Noggin. Levels of expression of (A) type II collagen, (B) aggrecan, (C) Sox9, (D) ratio of type II collagen:type I collagen gene expression, as well as expression levels of (E) superficial zone protein [SZP] and (F) Runx2 were measured after 7 days of culture by qRT-PCR and normalized to the expression level of β-actin gene as described in Experimental Procedures. White bars represent SZC and black bars represent DZC. Where differences were not found for BMP2 and BMP7 overexpressing cells, data were pooled and are represented as ‘BMP’. Each bar represents mean relative expression levels for 3 – 6 samples per group per time point. [a], [b] and [c] indicate statistical significance with p<0.02 compared to control, Noggin or BMP, respectively. Error bars are not included as statistical significance was tested on ∆CT values based on which relative expression was calculated.
BMPs support articular chondrocyte hypertrophy
Histomorphometric measurements and gene expression levels showed that BMP overexpression supported hypertrophy, while Noggin overexpression inhibited it. Average cell diameters were 5 μm or 2.5 μm greater in BMP2 or -7 overexpressing DZC than AdNull-treated control (p<0.05, Table 1). In contrast, Noggin overexpressing DZC were 4 μm smaller than controls (p<0.05). In SZC, treatment with AdNull increased cell diameter by about 2 μm (p<0.05), but overexpression of BMPs did not increase it further. The Noggin overexpressing SZC had smaller cell diameter than AdNull control (p<0.05), and similar to naïve (untreated) SZC. Expression of Runx2 was unaffected by BMP overexpression in SZC or DZC (p>0.05 all comparisons, Figure 6 F). Overexpression of Noggin prevented the 5-fold increase in Runx2 that occurred in untreated SZC between day 0 and day 7 (p<0.01), but had no effect on expression in DZC. Expression of ALP was increased approximately 5-fold in DZC, but not SZC, overexpressing BMP (p<0.02, all comparisons). Expression levels of Type X collagen were not affected by BMP or Noggin overexpression in either SZC or DZC. These data suggest that BMPs support enlargement of chondrocyte diameter, particularly in DZC, although perhaps not through Runx2 signaling.
Discussion
We have assessed gene expression, matrix accumulation and morphology in SZC and DZC overexpressing BMP2, - 7 or Noggin in a pellet culture system and report significant differences, including preferential effects of BMP overexpression on matrix accumulation by SZC and a hypertrophic phenotype supported by endogenous BMPs in DZC. Previous studies including our own have reported several differences between SZC and DZC (Aydelotte et al., 1988; Aydelotte and Kuettner, 1988; Darling and Athanasiou, 2005a; Darling and Athanasiou, 2005b; Darling et al., 2004; Dowthwaite et al., 2004; Eleswarapu et al., 2006; Marles et al., 1991; Siczkowski and Watt, 1990; Stephens et al., 1992; Waldman et al., 2003; Zanetti et al., 1985). In the current study, we have identified BMP as an important factor in the differential capacities of SZC and DZC to accumulate matrix and to hypertrophy.
BMPs and matrix accumulation
Our data are in agreement with previous studies that have reported a greater capacity for matrix accumulation by DZC than SZC (Aydelotte et al., 1988; Waldman et al., 2003). Furthermore, we have identified differences in endogenous BMP activity as an important factor in the phenotypic difference in SZC and DZC. Greater matrix accumulation in the DZC was associated with higher Noggin expression levels and a higher ratio of pSmad to total Smad, indicating higher BMP activation. Although BMP overexpression did not increase matrix accumulation in DZC, Noggin overexpression diminished it, leading to the formation of tissues with spaces that did not stain for PG or type II collagen. Conversely, SZC, which had a lower baseline matrix accumulation and BMP activation state, accumulated more PG-rich matrix, similar in quantity and quality to DZC matrix when modified to overexpress BMP2 or -7.
Soder et al. (Soder et al., 2005) have established the importance of endogenous BMP7 (also known as osteogenic protein-1 or OP-1) in PG homeostasis in articular cartilage. Our findings are in agreement with those previous reports and further indicate that the DZC, in particular, have a high level of baseline BMP activity which is associated with its ability to accumulate matrix. We did not find that endogenous BMP7 (or BMP2) levels were higher in DZC than SZC. As such, the higher activation levels in DZC are likely due to differences in protein processing, receptor expression levels, antagonist expression levels or other factors yet to be investigated. Additionally, differential expression of other members of the BMP family such as BMP6 or growth and differentiation factor-5 (GDF5) may be important (Semevolos et al., 2006; Semevolos et al., 2004).
We and others have reported that exogenous BMPs also increase matrix synthesis by chondrocytes (Flechtenmacher et al., 1996; Hidaka et al., 2003; Hidaka et al., 2001; Huch et al., 1997; Sailor et al., 1996). In the current study, we have identified SZC as the sub-population that is particularly responsive, even to low doses of BMPs. In the DZC, differences were detected between effects of BMP2 and BMP7, with BMP7 having smaller effects on cell diameter and Noggin upregulation, perhaps because of its lower (Ad-mediated) expression level compared to BMP2. In SZC, however, no differences were detected. This is particularly interesting as the level of BMP7 achieved by Ad-mediated overexpression was lower than endogenous BMP2 levels. A full dose-reponse comparison of the two BMPs will be required to address the question fully; meanwhile, our results are consistent with an increased potency of BMP7 over BMP2 in SZC.
The relatively low levels of BMPs produced by the chondrocytes was surprising, given the use of Ad vectors. This was likely due to our method, where infections were performed in suspension culture where expression of the integrins necessary for Ad entry may have been diminished. About half of the BMPs produced by the Ad-modified cells was detected in the pellet itself, suggesting that small quantities of BMPs may be highly effective in the context of appropriate carrier matrices. Another possibility, previously reported by Olmstead et al (Olmsted et al., 2001) is that BMPs are more effective when delivered by Ad-mediated gene transfer than by addition of recombinant protein.
Our gene expression data confirmed findings from previous reports that BMPs increase matrix gene expression in chondrocytes; but they also suggested that measurement of matrix gene expression, particularly 1 week after treatment with Ad vectors, does not correlate well with observed changes in matrix accumulation and quality. Whereas BMP overexpression preferentially increased PG accumulation in SZC, aggrecan gene expression increased only to the same degree as it did in DZC, in which no change in matrix accumulation was observed in response to BMP. Also, while type II collagen gene expression did increase to a greater degree in SZC than DZC in response to BMP, matrix changes did not reflect this increase. In fact, FT-IRI analysis showed an increase in the proportion of PG:Am1 in the matrix accumulated by BMP overexpressing SZC. In addition, despite decreases in matrix accumulation, Noggin overexpression increased the expression of type II collagen and aggrecan genes in SZC and DZC. This rise may have occurred due to a repair-like response by the chondrocytes, which upon sensing a relative lack of surrounding matrix, could have attempted to increase matrix production by increasing bBMP2 and -7 as well as type II collagen and aggrecan gene expression levels. Testing earlier time points may reveal other direct actions of Noggin on chondrocyte matrix gene expression.
Our data may also suggest that regardless of BMP or Noggin stimulation, upregulation of type II collagen and aggrecan genes is not sufficient to increase matrix accumulation. Tissue formation and matrix accumulation may, instead, depend on other factors, such as the expression of matrix degradation enzymes, expression of accessory matrix proteins or the presence of an existing matrix scaffold.
BMPs and articular chondrocyte hypertrophy
In addition to increased matrix accumulation, a hypertrophic phenotype was observed in DZC. Phenotypic changes associated with chondrocyte hypertrophy are reported in articular chondrocytes in the context of osteoarthritis (OA). Here we report that isolated DZC have a larger cell diameter than SZC, as well as higher expression levels of ALP, and Runx2, a transcription factor necessary for chondrocyte hypertrophy and endochondral ossification (Enomoto et al., 2000; Enomoto-Iwamoto et al., 2001; Iwamoto et al., 2003; Otto et al., 1997). Overexpression of BMP2 or -7 increased cell diameter while Noggin decreased it, indicating that BMP activity was important for DZC hypertrophy. Overexpression of BMP also increased ALP expression. Despite previous reports that BMPs can regulate Runx2 expression, we did not observe changes in Runx2 expression in DZC regardless of BMP or Noggin overexpression (Jeon et al., 2006; Wang et al., 2007). However, our data do not rule out the possibility that even without gene upregulation, that Runx2 activity might have been increased by increased BMP activity.
Expression of Runx2 has been implicated in the pathogenesis of OA; however, its function in articular chondrocytes is not well understood (Kamekura et al., 2006; Wang et al., 2004). In growth plate chondrocytes, Runx2 regulates several genes related to chondrocyte hypertrophy including type X collagen and matrix metalloproteinase-13 (MMP13) in growth plate chondrocytes; and is a good candidate for such regulation in DZC (Enomoto et al., 2000; Enomoto-Iwamoto et al., 2001; Inada et al., 1999; Komori et al., 1997; Otto et al., 1997). A recent study has shown that in developing perichondrium Runx2 can also prevent chondrocyte hypertrophy through interaction with another transcription factor Twist-1, suggesting an alternate role for the factor (Hinoi et al., 2006). During development, Runx2 expression is thus reported in perichondrium, growth plate chondrocytes and osteoblasts, with different roles in each. Because our isolation method for DZC is by dissection, we cannot preclude the presence of osteoblasts in our culture. Future investigation of the function of Runx2 in DZC will clarify these questions.
The significance of increased cell diameter in articular chondrocytes also requires further investigation. Whereas the hypertrophic appearance was associated with increased ALP and Runx2, two markers of hypertrophy of growth plate chondrocytes, other markers such as type X collagen were not expressed at higher levels in DZC than SZC. In the growth plate, hypertrophy occurs in the final stages of endochondral ossification, a process not usually associated with articular cartilage. Isolation of DZC in vitro may have revealed a behavior not normally seen in situ. Indeed, our recent data indicate that mineralization occurs in DZC in isolation, but not in co-culture with SZC (Jiang et al., accepted). Similarly, hypertrophy may also be a behavior that occurs only when DZC are not in contact with SZC. Still another possibility is that, as in the growth plate, hypertrophy precedes apoptosis and that longer culture periods would lead to the formation of tissue with fewer cells (secondary to apoptosis) but abundant matrix, similar to articular cartilage tissue, particularly in DZC pellets. Long term studies in our model will examine this possibility.
Whatever the significance of articular chondrocyte hypertrophy may be, it did not occur in SZC regardless of BMP activity. In SZC, BMP overexpression did not cause cell enlargement or Runx2 upregulation, even while inducing the accumulation of a similar quality and quantity of PG-rich matrix as DZC. Previous studies have reported on the presence of stem like cells within neonatal bovine SZC (Dowthwaite et al., 2004). One possibility is that BMP increased PG accumulation in less mature cells without inducing hypertrophy. Conclusions regarding the relative maturation levels of SZC versus DZC cannot be made based on the differential effects of BMPs on the sub-populations found in our study. However, our findings do underscore the significant phenotypic differences between SZC and DZC and present potentially important implications for the use of chondrocytes or BMPs for cartilage repair and regeneration. In so far as aspects of the hypertrophic phenotype are associated with the pathological changes of OA, avoiding DZC and using SZC may be a good strategy to improve cell based cartilage tissue engineering. Furthermore, targeting BMP therapy to SZC may be important in avoiding possible effects of BMPs on chondrocyte hypertrophy.
Experimental Procedures
Preparation of SZC and DZC Pellets
Superficial and deep zone chondrocytes (SZC and DZC) were harvested from the femoral chondyles of young adult steer (18 – 36 mo) (Hidaka et al., 2006). Briefly, the SZ cartilage was harvested from the 100 μm of tissue closest to the articular surface using a scalpel, while DZ cartilage was harvested from the 45% of the tissue (by wet weight) closest to the sub-chondral bone. Chondrocytes were isolated by overnight digestion in 0.1% bacterial collagenase (type II, Worthington Biochemical, Lakewood, N.J.) in Dulbecco’s modifiend essential medium (DMEM) and 5% fetal bovine serum (FBS; both from Gibco Invitrogen, Carlsbad, C.A.). Aliquots of 5×10⁵ cells were transfected by incubation with either AdBMP2, AdBMP7, AdNoggin or as controls, AdNull (with no transgene) or no virus (naïve) for two hours at 37°C (Hidaka et al., 2001; Lim et al., 2000). Cells were then pelleted by centrifugation and maintained in 0.5 ml ‘complete media’ consisting of DMEM with 10% FBS, 1x antibiotic/antimycotic solution (Gibco Invitrogen, Carlsbad, C.A.), and 50 μg/ml ascorbate (Sigma, St Louis, M.O.) for seven days at 37°C.
Assessment of Bone Morphogenetic Protein and Noggin Production
Supernatants and pellets were collected after 7 days of culture, and pellets were lysed and homogenized in RIPA buffer (150mM NaCl, 10mM Tris, 0.1% SDS, 1% Triton X-100, 1% Deoxycholate and 5mM EDTA) containing protease inhibitors. Supernatants and homogenates were analyzed for human BMP2 and human BMP7 protein production using the human BMP2 Enzyme-Linked Immunosorbent Assay (ELISA) and the human BMP7 DuoSet® ELISA, respectively, (both from R&D Systems, Inc., Minneapolis, M.N.) and normalized to the amount of DNA in the homogenates as detected by picoGreen assay. Supernatants precipitated with Trichloroacetic acid (TCA; Sigma, St Louis, M.O.) and pellet homogenates were also analyzed for Noggin protein production by Western blotting. Equal concentrations of protein were loaded into each lane of the gel (NuPAGE Bis-Tris gel systems, Invitrogen, Carlsbad, CA). After electrophoresis and transfer, filters for supernatant samples were stained with Ponceau solution for 3 minutes and imaged using a Molecular Imager Gel Doc XR system (Bio-Rad, Hercules, CA) before probing with a rabbit anti-human full length Noggin primary antibody (Santa Cruz Biotechnology, Santa Cruz, C.A.). Filters containing pellet homogenate samples were directly probed with antibody after transferring. Antibody labeling was visualized using horseradish peroxidase conjugated goat anti-rabbit and goat anti-mouse IgG secondary antibodies (both from Santa Cruz Biotechnology) followed by exposure to ECL reagent (Amersham Biosciences Piscataway, N.J.) for 1 minute at room temperature. Exposed films were scanned and band densities were quantified using NIH Image J software.
Determining Smad phosphorylation after treatment with BMP and Noggin
The SZC and DZC pellets were treated with either recombinant human BMP2 (rhBMP2; R&D Systems) or rhNoggin (R&D Systems, Minneapolis, M.N.) at 200 ng/ml or as control, media alone for 4 hr then lysed using RIPA buffer containing protease and phosphatase inhibitors. Westerns were performed and analyzed as described above except that filters were probed with rabbit anti-human phospho-Smad1/5/8 (Chemicon, Billerica, M.A), rabbit anti-human total Smad1 (Cell Signaling Technology, Danvers, M.A.), and mouse anti-human GAPDH (Santa Cruz Biotechnology). Ratio of pSmad to total Smad were determined by measuring band densities from two independent experiments.
Quantitative Real Time Polymerase Chain Reaction
Total RNA was isolated from cell pellets harvested on days 0 and 7 post transfection using the Trizol® method (Sigma, St Louis, M.O.). Equal concentrations of RNA were then reverse transcribed using the iScript cDNA synthesis kit (Bio-Rad, Hercules, C.A.). Quantitative Real Time polymerase chain reaction (PCR) was performed by using a MyiQ Single-color Real Time PCR detection system (Bio-Rad, Hercules, C.A.). Primers were designed by using the Custom Primers-Oligo Perfect™ Designer software (Invitrogen, Carlsbad, C.A.) and were based on bovine sequences (GenBank); homology was comfirmed against the bovine genome. Primer sets included: type II collagen (5′-GCA TTG CCT ACC TGG ACG AA-3′ forward; 5′-GAA CCT GCT GTT GCC CTC AG-3′ reverse), type IA collagen (5′-ATC CCA GTC AAG AAC TGG TAC AGA A-3′ forward; 5′-CTG GGT ACC ACC GTT GAT AGT TT-3′ reverse), aggrecan (5′-GTG AAT CCC AAA ACG CCA CT-3′ forward; 5′-CGG CGT AGC ACT TGT CCA G-3′ reverse), superficial zone protein (5′-TGC AAC GGT AGG CCA GTA GAT-3′ forward; 5′-CAT CCA GAA ATA ATG ACC TCG AAA T-3′ reverse), bovine BMP2 (5′-CGA AAA GAA GTT GGG AAA ACA-3′ forward; 5′-GGG GCT GAA CCC ATA TAA AA-3′ reverse), bovine BMP7 (5′-CAG ACC ACC TGC ATT TTG TG-3′ forward; 5′-ATC GGA TCA AAA GCC ATC TG-3′ reverse), Noggin (5′-GAT CAA AGC GCT GGA GTT CT-3′ forward; 5′-TGT AAC TTC CTC CGC AGC TT-3′ reverse), Indian hedgehog (5′-AGA GTG GCA GCT GTC TCC A-3′ forward; 5′-ACA TCC TCC ACC ACC AGT GT-3′ reverse), parathyroid hormone-related protein (5′-ACC TCG GAG GTG TCC CCT AA-3′ forward; 5′-GCC CTC ATC ATC AGA CCC AA-3′ reverse), Runx2 (5′-AAT CCT CCC CAA GTT GCC A-3′ forward; 5′-TTC TGT CTG TGC CTT CTG GGT-3′ reverse), alkaline phosphatase (5′-TGC GAC TGA CCC TTC ACT CTC-3′ forward; 5′-CAC CAG CAG GAA GAA GCC TTT-3′ reverse), and the housekeeping gene β-actin (5′-CTG CGG CAT TCA CGA AAC TA-3′ forward; 5′-ACC GTG TTG GCG TAG AGG TC-3′ reverse). Relative expression levels were calculated based on ∆CT, the difference in threshold cycle between the gene of interest and the housekeeping gene β-actin. Statistical analyses were performed on the raw threshold cycle numbers for each gene of interest for each sample.
Morphology, Histomorphometry, and Immunohistochemistry
For histomorphometric and immunohistochemistry studies, pellets harvested on day 7 were fixed overnight in formalin with 10% cetyl pyridinium chloride (Sigma, St Louis, M.O.) to prevent leaching of PGs. Fixed pellets were processed, embedded, and sectioned at 7μm and were stained with alcian blue to visualize PGs and counterstained with nuclear fast red to visualize cell nuclei. Sections were also stained for type II collagen using a goat polyclonal antibody raised against the N-terminus of type II collagen of human origin (Santa Cruz Biotechnology, Santa Cruz, C.A.). Primary antibody was detected using an anti goat horseradish peroxidase-streptavidin antibody complex, provided in a goat ImmunoCruz™ Staining System (Santa Cruz Biotechnology, Santa Cruz, C.A.), and visualized with diaminobenzidine (DAB) chromogen (DakoCytomation, Carpinteria, CA).
Cellularity, average of cell bodies in the pellets, and average area of the pellets were measured histomorphometrically (Bioquant Osteo II 8.0, Nashville, TN). Cellularity was defined as the average number of nuclei present in five 500μm by 380μm fields per sample. Nuclei were selected from background by setting a threshold based on the color of several sample nuclei. Average diameter of cell bodies was measured by sampling 25 chondrocyte diameters per field. Average area of each pellet was measured by manually outlining the area of at least 6 sections per pellet at low power (1X). Data were collected for 3 – 6 pellets per group.
Fourier-Transform Infrared Imaging Spectroscopy
Matrix quality was examined in paraffin-embedded sections by Fourier transform infrared imaging spectroscopy. For each pellet, a 7-μm section was cut onto a barium fluoride (BaF2) infrared window and the section allowed to air dry. A Spectrum Spotlight (Perkin-Elmer, UK) FT-IR imaging spectrometer coupled with an optical microscope and 16 linear detectors with spatial resolution 6.25-μm and spectral resolution 8 cm−1 was used to acquire IR images of the entire pellet cross-section. Data were analyzed with Isys4.0 software (Spectral Dimensions Inc., Olney, MD). The primary components of the cartilage extracellular matrix, collagen and proteoglycan, give rise to specific absorbances in the infrared region of the electro-magnetic spectrum as previously described (Camacho et al. 2001a, West et al. 2004). The primary absorbance bands in the 1720–1596 cm−1 (collagen amide I), and the 1180–980 cm−1 (proteoglycan sugar) regions were measured. Images were created based on the integrated area under the amide I region to assess collagen type II quantity and distribution. The ratio of the integrated area of PG absorbance to collagen (Am1) absorbance was determined in order to obtain relative quantity and distribution of the proteoglycan component (PG:Am1) of the ECM, and adjusted for cell number by dividing the ratio by the average cell number per high power field for each specimen. Histograms were created from each image to obtain the mean relative absorbance (Camacho et al. 2001b).
Acknowledgments
This work was supported, in part by the NIH [1RO3ARO49062-01A1] and the National Chapter of the Arthritis Foundation. We thank Mary Goldring, PhD for her thorough and insightful editorial input.
Footnotes
Publisher's Disclaimer: This is a PDF file of an unedited manuscript that has been accepted for publication. As a service to our customers we are providing this early version of the manuscript. The manuscript will undergo copyediting, typesetting, and review of the resulting proof before it is published in its final citable form. Please note that during the production process errors may be discovered which could affect the content, and all legal disclaimers that apply to the journal pertain.
References
- Aydelotte MB, Greenhill RR, Kuettner KE. Differences between sub-populations of cultured bovine articular chondrocytes. II. Proteoglycan metabolism. Connect Tissue Res. 1988;18:223–234. doi: 10.3109/03008208809016809. [DOI] [PubMed] [Google Scholar]
- Aydelotte MB, Kuettner KE. Differences between sub-populations of cultured bovine articular chondrocytes. I. Morphology and cartilage matrix production. Connect Tissue Res. 1988;18:205–222. doi: 10.3109/03008208809016808. [DOI] [PubMed] [Google Scholar]
- Chang SC, Hoang B, Thomas JT, Vukicevic S, Luyten FP, Ryba NJ, Kozak CA, Reddi AH, Moos M., Jr Cartilage-derived morphogenetic proteins. New members of the transforming growth factor-beta superfamily predominantly expressed in long bones during human embryonic development. J Biol Chem. 1994;269:28227–28234. [PubMed] [Google Scholar]
- Chubinskaya S, Kuettner KE. Regulation of osteogenic proteins by chondrocytes. Int J Biochem Cell Biol. 2003;35:1323–1340. doi: 10.1016/s1357-2725(03)00035-9. [DOI] [PubMed] [Google Scholar]
- Chubinskaya S, Merrihew C, Cs-Szabo G, Mollenhauer J, McCartney J, Rueger DC, Kuettner KE. Human articular chondrocytes express osteogenic protein-1. J Histochem Cytochem. 2000;48:239–250. doi: 10.1177/002215540004800209. [DOI] [PubMed] [Google Scholar]
- Darling EM, Athanasiou KA. Growth factor impact on articular cartilage subpopulations. Cell Tissue Res. 2005a;322:463–473. doi: 10.1007/s00441-005-0020-4. [DOI] [PubMed] [Google Scholar]
- Darling EM, Athanasiou KA. Retaining zonal chondrocyte phenotype by means of novel growth environments. Tissue Eng. 2005b;11:395–403. doi: 10.1089/ten.2005.11.395. [DOI] [PubMed] [Google Scholar]
- Darling EM, Hu JC, Athanasiou KA. Zonal and topographical differences in articular cartilage gene expression. J Orthop Res. 2004;22:1182–1187. doi: 10.1016/j.orthres.2004.03.001. [DOI] [PubMed] [Google Scholar]
- Dowthwaite GP, Bishop JC, Redman SN, Khan IM, Rooney P, Evans DJ, Haughton L, Bayram Z, Boyer S, Thomson B, et al. The surface of articular cartilage contains a progenitor cell population. J Cell Sci. 2004;117:889–897. doi: 10.1242/jcs.00912. [DOI] [PubMed] [Google Scholar]
- Eleswarapu SV, Leipzig ND, Athanasiou KA. Gene expression of single articular chondrocytes. Cell Tissue Res. 2006 doi: 10.1007/s00441-006-0258-5. [DOI] [PubMed] [Google Scholar]
- Enomoto H, Enomoto-Iwamoto M, Iwamoto M, Nomura S, Himeno M, Kitamura Y, Kishimoto T, Komori T. Cbfa1 is a positive regulatory factor in chondrocyte maturation. J Biol Chem. 2000;275:8695–8702. doi: 10.1074/jbc.275.12.8695. [DOI] [PubMed] [Google Scholar]
- Enomoto-Iwamoto M, Enomoto H, Komori T, Iwamoto M. Participation of Cbfa1 in regulation of chondrocyte maturation. Osteoarthritis Cartilage. 2001;9(Suppl A):S76–84. doi: 10.1053/joca.2001.0448. [DOI] [PubMed] [Google Scholar]
- Flechtenmacher J, Huch K, Thonar EJ, Mollenhauer JA, Davies SR, Schmid TM, Puhl W, Sampath TK, Aydelotte MB, Kuettner KE. Recombinant human osteogenic protein 1 is a potent stimulator of the synthesis of cartilage proteoglycans and collagens by human articular chondrocytes. Arthritis Rheum. 1996;39:1896–1904. doi: 10.1002/art.1780391117. [DOI] [PubMed] [Google Scholar]
- Francis-West PH, Parish J, Lee K, Archer CW. BMP/GDF-signalling interactions during synovial joint development. Cell Tissue Res. 1999;296:111–119. doi: 10.1007/s004410051272. [DOI] [PubMed] [Google Scholar]
- Hidaka C, Cheng C, Alexandre D, Bhargava M, Torzilli PA. Maturational differences in superficial and deep zone articular chondrocytes. Cell Tissue Res. 2006;323:127–135. doi: 10.1007/s00441-005-0050-y. [DOI] [PubMed] [Google Scholar]
- Hidaka C, Goodrich LR, Chen CT, Warren RF, Crystal RG, Nixon AJ. Acceleration of cartilage repair by genetically modified chondrocytes over expressing bone morphogenetic protein-7. J Orthop Res. 2003;21:573–583. doi: 10.1016/S0736-0266(02)00264-4. [DOI] [PubMed] [Google Scholar]
- Hidaka C, Quitoriano M, Warren RF, Crystal RG. Enhanced matrix synthesis and in vitro formation of cartilage-like tissue by genetically modified chondrocytes expressing BMP-7. J Orthop Res. 2001;19:751–758. doi: 10.1016/S0736-0266(01)00019-5. [DOI] [PubMed] [Google Scholar]
- Hinoi E, Bialek P, Chen YT, Rached MT, Groner Y, Behringer RR, Ornitz DM, Karsenty G. Runx2 inhibits chondrocyte proliferation and hypertrophy through its expression in the perichondrium. Genes Dev. 2006;20:2937–2942. doi: 10.1101/gad.1482906. [DOI] [PMC free article] [PubMed] [Google Scholar]
- Huch K, Wilbrink B, Flechtenmacher J, Koepp HE, Aydelotte MB, Sampath TK, Kuettner KE, Mollenhauer J, Thonar EJ. Effects of recombinant human osteogenic protein 1 on the production of proteoglycan, prostaglandin E2, and interleukin-1 receptor antagonist by human articular chondrocytes cultured in the presence of interleukin-1beta. Arthritis Rheum. 1997;40:2157–2161. doi: 10.1002/art.1780401209. [DOI] [PubMed] [Google Scholar]
- Inada M, Yasui T, Nomura S, Miyake S, Deguchi K, Himeno M, Sato M, Yamagiwa H, Kimura T, Yasui N, et al. Maturational disturbance of chondrocytes in Cbfa1-deficient mice. Dev Dyn. 1999;214:279–290. doi: 10.1002/(SICI)1097-0177(199904)214:4<279::AID-AJA1>3.0.CO;2-W. [DOI] [PubMed] [Google Scholar]
- Iwamoto M, Kitagaki J, Tamamura Y, Gentili C, Koyama E, Enomoto H, Komori T, Pacifici M, Enomoto-Iwamoto M. Runx2 expression and action in chondrocytes are regulated by retinoid signaling and parathyroid hormone-related peptide (PTHrP) Osteoarthritis Cartilage. 2003;11:6–15. doi: 10.1053/joca.2002.0860. [DOI] [PubMed] [Google Scholar]
- Jeon EJ, Lee KY, Choi NS, Lee MH, Kim HN, Jin YH, Ryoo HM, Choi JY, Yoshida M, Nishino N, et al. Bone morphogenetic protein-2 stimulates Runx2 acetylation. J Biol Chem. 2006;281:16502–16511. doi: 10.1074/jbc.M512494200. [DOI] [PubMed] [Google Scholar]
- Kamekura S, Kawasaki Y, Hoshi K, Shimoaka T, Chikuda H, Maruyama Z, Komori T, Sato S, Takeda S, Karsenty G, et al. Contribution of runt-related transcription factor 2 to the pathogenesis of osteoarthritis in mice after induction of knee joint instability. Arthritis Rheum. 2006;54:2462–2470. doi: 10.1002/art.22041. [DOI] [PubMed] [Google Scholar]
- Kim TK, Sharma B, Williams CG, Ruffner MA, Malik A, McFarland EG, Elisseeff JH. Experimental model for cartilage tissue engineering to regenerate the zonal organization of articular cartilage. Osteoarthritis Cartilage. 2003;11:653–664. doi: 10.1016/s1063-4584(03)00120-1. [DOI] [PubMed] [Google Scholar]
- Klein TJ, Schumacher BL, Blewis ME, Schmidt TA, Voegtline MS, Thonar EJ, Masuda K, Sah RL. Tailoring Secretion of Proteoglycan 4 (PRG4) in Tissue-Engineered Cartilage. Tissue Eng. 2006 doi: 10.1089/ten.2006.12.1429. [DOI] [PubMed] [Google Scholar]
- Klein TJ, Schumacher BL, Schmidt TA, Li KW, Voegtline MS, Masuda K, Thonar EJ, Sah RL. Tissue engineering of stratified articular cartilage from chondrocyte subpopulations. Osteoarthritis Cartilage. 2003;11:595–602. doi: 10.1016/s1063-4584(03)00090-6. [DOI] [PubMed] [Google Scholar]
- Komori T, Yagi H, Nomura S, Yamaguchi A, Sasaki K, Deguchi K, Shimizu Y, Bronson RT, Gao YH, Inada M, et al. Targeted disruption of Cbfa1 results in a complete lack of bone formation owing to maturational arrest of osteoblasts. Cell. 1997;89:755–764. doi: 10.1016/s0092-8674(00)80258-5. [DOI] [PubMed] [Google Scholar]
- Lim DA, Tramontin AD, Trevejo JM, Herrera DG, Garcia-Verdugo JM, Alvarez-Buylla A. Noggin antagonizes BMP signaling to create a niche for adult neurogenesis. Neuron. 2000;28:713–726. doi: 10.1016/s0896-6273(00)00148-3. [DOI] [PubMed] [Google Scholar]
- Marles PJ, Hoyland JA, Parkinson R, Freemont AJ. Demonstration of variation in chondrocyte activity in different zones of articular cartilage: an assessment of the value of in-situ hybridization. Int J Exp Pathol. 1991;72:171–182. [PMC free article] [PubMed] [Google Scholar]
- Masuda K, Pfister BE, Sah RL, Thonar EJ. Osteogenic protein-1 promotes the formation of tissue-engineered cartilage using the alginate-recovered-chondrocyte method. Osteoarthritis Cartilage. 2006;14:384–391. doi: 10.1016/j.joca.2005.10.006. [DOI] [PubMed] [Google Scholar]
- Merrihew C, Soeder S, Rueger DC, Kuettner KE, Chubinskaya S. Modulation of endogenous osteogenic protein-1 (OP-1) by interleukin-1 in adult human articular cartilage. J Bone Joint Surg Am. 2003;85-A(Suppl 3):67–74. doi: 10.2106/00004623-200300003-00012. [DOI] [PubMed] [Google Scholar]
- Olmsted EA, Blum JS, Rill D, Yotnda P, Gugala Z, Lindsey RW, Davis AR. Adenovirus-mediated BMP2 expression in human bone marrow stromal cells. J Cell Biochem. 2001;82:11–21. doi: 10.1002/jcb.1106. [DOI] [PubMed] [Google Scholar]
- Otto F, Thornell AP, Crompton T, Denzel A, Gilmour KC, Rosewell IR, Stamp GW, Beddington RS, Mundlos S, Olsen BR, et al. Cbfa1, a candidate gene for cleidocranial dysplasia syndrome, is essential for osteoblast differentiation and bone development. Cell. 1997;89:765–771. doi: 10.1016/s0092-8674(00)80259-7. [DOI] [PubMed] [Google Scholar]
- Rosen V. BMP and BMP inhibitors in bone. Ann N Y Acad Sci. 2006;1068:19–25. doi: 10.1196/annals.1346.005. [DOI] [PubMed] [Google Scholar]
- Rountree RB, Schoor M, Chen H, Marks ME, Harley V, Mishina Y, Kingsley DM. BMP receptor signaling is required for postnatal maintenance of articular cartilage. PLoS Biol. 2004;2:e355. doi: 10.1371/journal.pbio.0020355. [DOI] [PMC free article] [PubMed] [Google Scholar]
- Sailor LZ, Hewick RM, Morris EA. Recombinant human bone morphogenetic protein-2 maintains the articular chondrocyte phenotype in long-term culture. J Orthop Res. 1996;14:937–945. doi: 10.1002/jor.1100140614. [DOI] [PubMed] [Google Scholar]
- Semevolos SA, Nixon AJ, Fortier LA, Strassheim ML, Haupt J. Age-related expression of molecular regulators of hypertrophy and maturation in articular cartilage. J Orthop Res. 2006;24:1773–1781. doi: 10.1002/jor.20227. [DOI] [PubMed] [Google Scholar]
- Semevolos SA, Nixon AJ, Strassheim ML. Expression of bone morphogenetic protein-6 and -2 and a bone morphogenetic protein antagonist in horses with naturally acquired osteochondrosis. Am J Vet Res. 2004;65:110–115. doi: 10.2460/ajvr.2004.65.110. [DOI] [PubMed] [Google Scholar]
- Siczkowski M, Watt FM. Subpopulations of chondrocytes from different zones of pig articular cartilage. Isolation, growth and proteoglycan synthesis in culture. J Cell Sci. 1990;97(Pt 2):349–360. doi: 10.1242/jcs.97.2.349. [DOI] [PubMed] [Google Scholar]
- Soder S, Hakimiyan A, Rueger DC, Kuettner KE, Aigner T, Chubinskaya S. Antisense inhibition of osteogenic protein 1 disturbs human articular cartilage integrity. Arthritis Rheum. 2005;52:468–478. doi: 10.1002/art.20856. [DOI] [PubMed] [Google Scholar]
- Stephens M, Kwan AP, Bayliss MT, Archer CW. Human articular surface chondrocytes initiate alkaline phosphatase and type X collagen synthesis in suspension culture. J Cell Sci. 1992;103(Pt 4):1111–1116. doi: 10.1242/jcs.103.4.1111. [DOI] [PubMed] [Google Scholar]
- Sun Y, Kandel R. Deep zone articular chondrocytes in vitro express genes that show specific changes with mineralization. J Bone Miner Res. 1999;14:1916–1925. doi: 10.1359/jbmr.1999.14.11.1916. [DOI] [PubMed] [Google Scholar]
- Waldman SD, Grynpas MD, Pilliar RM, Kandel RA. The use of specific chondrocyte populations to modulate the properties of tissue-engineered cartilage. J Orthop Res. 2003;21:132–138. doi: 10.1016/S0736-0266(02)00105-5. [DOI] [PubMed] [Google Scholar]
- Wang Q, Wei X, Zhu T, Zhang M, Shen R, Xing L, O'Keefe RJ, Chen D. Bone Morphogenetic Protein 2 Activates Smad6 Gene Transcription through Bone-specific Transcription Factor Runx2. J Biol Chem. 2007;282:10742–10748. doi: 10.1074/jbc.M610997200. [DOI] [PMC free article] [PubMed] [Google Scholar]
- Wang X, Manner PA, Horner A, Shum L, Tuan RS, Nuckolls GH. Regulation of MMP-13 expression by RUNX2 and FGF2 in osteoarthritic cartilage. Osteoarthritis Cartilage. 2004;12:963–973. doi: 10.1016/j.joca.2004.08.008. [DOI] [PubMed] [Google Scholar]
- Zanetti M, Ratcliffe A, Watt FM. Two subpopulations of differentiated chondrocytes identified with a monoclonal antibody to keratan sulfate. J Cell Biol. 1985;101:53–59. doi: 10.1083/jcb.101.1.53. [DOI] [PMC free article] [PubMed] [Google Scholar]
- Zhu W, Rawlins BA, Boachie-Adjei O, Myers ER, Arimizu J, Choi E, Lieberman JR, Crystal RG, Hidaka C. Combined bone morphogenetic protein-2 and -7 gene transfer enhances osteoblastic differentiation and spine fusion in a rodent model. J Bone Miner Res. 2004;19:2021–2032. doi: 10.1359/JBMR.040821. [DOI] [PubMed] [Google Scholar]


