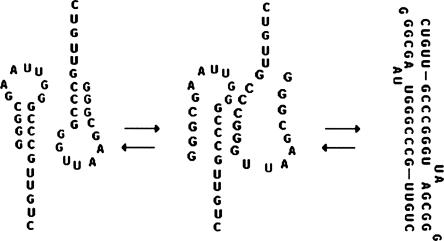
Abstract
Previous studies employing a 79-nucleotide (nt) RNA indicated that this RNA could form two bands in a native polyacrylamide gel while one band was observed in a denaturing gel. This report describes an investigation on the nature of the two corresponding structures and the segment responsible for forming the slower mobility band. Sedimentation equilibrium of the 79-nt RNA was consistent with the two gel bands corresponding to monomer and dimer forms. The portion of the RNA required for dimer formation was explored using a secondary structure prediction algorithm of two 79-nt RNAs linked in a head-to-tail fashion. The predicted structure suggested that the first 21-nt at the 5′ end of each RNA formed a self-complementary duplex. A ribonuclease H assay carried out with RNA prepared as monomer (M), or a mixture of monomer and dimer (M/D), gave results consistent with the predicted M and D structures. Gel mobility experiments on 5′ and 3′ segments of the 79-nt RNA also indicated that dimer formation was due to the 21-nt 5′ end. Studies on the 21-nt RNA molecule and sequence variants showed that this sequence can form a hairpin and a dimer complex. Unexpectedly, the hairpin to dimer conversion was shown to occur at high efficiency in frozen solution, although little or no conversion was observed above 0°C. The results indicate that a freezing environment can promote formation of intermolecular RNA complexes from stable RNA hairpins, supporting the notion that this environment could have played a role in the evolution of RNA complexity.
Keywords: RNA dimerization, frozen solution RNA folding
INTRODUCTION
The competition between intramolecular folding of a RNA molecule and its intermolecular interaction with other RNAs play important functional roles in a number of biological processes. RNA folding and RNA–RNA interactions are involved in pre-mRNA splicing (Green 1986), retroviral RNA packaging (Badorrek and Weeks 2006), RNA editing (Koslowsky 2004), mRNA-regulated expression by RNAi or antisense RNA (Lavorgna et al. 2004), and ribo-regulation of mRNA by specific small RNAs (Storz et al. 2004).
RNA dimerization is a special case of RNA–RNA interaction. It has been shown to be essential for retrovirus function where two homologous RNA molecules form a dimer complex (Paillart et al. 1996). Retroviral RNA sequences referred to as DIS1, SL-B′ (Hibbert et al. 2004) or PAL1 (Oroudjev et al. 1999), and DIS2, SL- (D'Souza et al. 2001), H1 (De Tapia et al. 1998), or PAL2 (Badorrek and Weeks 2006) have been proposed to be dimerization initiation sites interacting through self-complementary loop–loop interactions. Recent work indicates that the PAL2 sequence does not appear to form the stable stem–loop structure previously assumed but is within a flexible domain that may make dimerization more favorable thermodynamically and/or kinetically. Dimerization of RNA molecules has also been documented for tRNAs (Grosjean et al. 1976; Wittenhagen and Kelley 2002), a 75-nucleotide (nt) segment of the ϕ29 viral encoded pRNA (Chen et al. 2000), and potato spindle tuber viroid RNA (Gast et al. 1998). In these examples, complementary base-pairing of loop–loop “kissing complexes” was proposed to initiate dimerization. Recent studies suggest that conversion of short RNA hairpins to a duplex may also occur through cruciform intermediates initiated by coaxial stacking of helical stems (Bernacchi et al. 2005). The latter study highlights the existence of novel, not-well-understood mechanisms by which small RNAs may form higher order complexes.
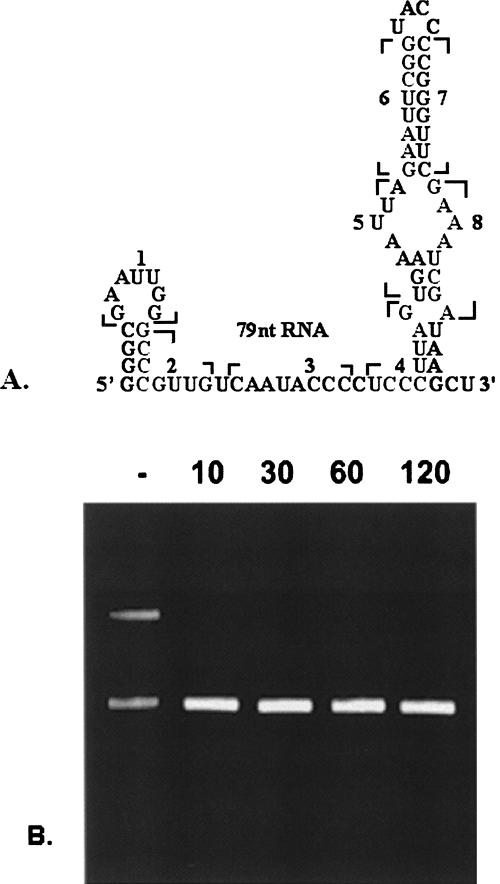
During studies on an in vitro transcribed 79-nt RNA (Fig. 1A), it was observed that this molecule, which formed a single band in a denaturing polyacrylamide gel (PAG), formed two bands in a native PAG at ∼1 μM concentration. The upper band was of similar or greater intensity than the lower band (Fig. 1B; Li and Wartell 1998). This observation was consistent with the notion of either two conformations of different mobility or monomer and dimer forms. Since the upper band was not observed after a heat and quick-cool step (Fig. 1B), it was tentatively assigned to a dimer form.
FIGURE 1.
(A) Predicted secondary structure of the 79-nt RNA. The numbered and bracketed seven or eight base long segments indicate the sites complimentary to eight DNA oligomers used in the RNase H assay. (B) 12% native PAG of 79-nt RNA at 1 μM. Left lane shows RNA monomer and dimer bands. Lanes labeled 10, 30, 60, and 120 correspond to samples heated and quick-cooled and then incubated for the specified minutes at 23°C prior to loading.
Observation of what are assumed to be RNA dimer bands is not uncommon in characterization of RNA transcripts (Ferrandon et al. 1997; Lease and Woodson 2004). Although the 79-nt RNA has no known biological function—it was transcribed from a plasmid region that was a fusion of a multiple cloning site and a HIV viral segment (Li and Wartell 1998)—its ability to readily form two bands with similar intensity at low μM concentrations suggested further investigation.
In this article, we describe results that indicate that the 79-nt RNA does indeed form a dimer. A secondary structure prediction algorithm and two experimental approaches indicate that the first 21 nt at the 5′ end of the 79-nt RNA is the essential element in dimer formation. Melting curve and gel mobility analysis of the 21-nt RNA sequence also provide evidence that this RNA can form a monomer hairpin and intermolecular dimer. The lowest energy structure predicted for the hairpin has four G•C base pairs (bp) in the stem, a seven-base loop, and a six-base dangling end. The lowest energy self-complimentary duplex structure is predicted to have 18 bp with two internal two-base bulge loops.
Studies on the conversion of the 21-nt RNA from its hairpin to dimer form produced unexpected results. Following a heating and quick-cool step to produce the hairpin conformation, little or no conversion to the dimer form (<10%) was observed at 2–20 μM strand concentration by slow cooling through the dimer melting region (∼35°C) or from extended incubations at 0°C or 23°C. However, freezing RNA solutions at ∼2 μM concentration converted over 60% of hairpin to the dimer conformation even though the RNA has a Tm ∼82°C in the solvent employed. The affect of base sequence changes on the RNA's ability to form a dimer indicated that loop–loop pairing between hairpins is not required.
The microenvironment of frozen aqueous solutions has been previously shown to be conducive to several potential prebiotic reactions including formation of dinucleosides from adenosine 2′,3′ cyclic phosphate (Renz et al. 1971), synthesis of polynucleotides from imidazole-activated mononucleotides (Monnard et al. 2003), and ligation of RNA oligomers by a hairpin ribozyme (Vlassov et al. 2004). The current study shows that frozen solutions can promote formation of intermolecular RNA structures from small stable hairpin RNAs. The results support the notion that freezing and/or freeze–thaw cycles could enable small RNA molecules to form more complex structures in a frozen environment where RNA degradation is minimized. The freezing-induced concentration of solute molecules and the interaction of water and ions with RNA in this environment apparently provide a conformational rearrangement pathway not readily available in liquid solution.
RESULTS AND DISCUSSION
The purified 79-nt RNA transcript showed different band patterns under different conditions. In a 12% denaturing PAG containing 8 M urea, only one band was detected (not shown). However, the same RNA sample at concentrations of 0.5–2 μM showed two bands in a 12% native PAG using a TBE buffer with 5 mM Mg2+ (Fig. 1B). The observation of two bands was unchanged if one maintained the RNA samples at 23°C for several hours prior to loading. The intensity of the upper band was equal to or greater than the intensity of the lower band. After heating the RNA to 65°C or 85°C for 2 min and quickly cooling in ice, only the lower band was observed. Figure 1B illustrates this result up to 120 min after the cooling step. A similar outcome occurred when TBE buffer was employed except that a lower fraction of RNA formed the upper band.
Sedimentation equilibrium studies
The PAG patterns described above indicated that the 79-nt RNA transcript formed two different structures, most likely monomer and dimer forms. A sedimentation equilibrium method was employed to test this interpretation (see Materials and Methods). The average molecular weight of an RNA sample that produced two gel bands was evaluated first. Three DNA molecules were used as molecular weight markers: a 25-nt DNA strand, a 47-nt DNA strand, and a 47-bp DNA duplex. The three DNAs and the RNA sample were run in separate tubes at 20,000 rpm for 20 h at 5°C. The average molecular weight of the RNA was 1.6±0.15 times the molecular weight of the 79-nt RNA monomer. When the RNA was prepared under conditions that produced one band in a native PAG, its average molecular weight was 1.1±0.1 times the RNA monomer. These results are consistent with the interpretation that the two gel bands are the monomer and dimer forms of the RNA.
Predicted RNA secondary structures
In order to gain insight on the structure of the 79-nt RNA monomer and dimer, low-energy secondary structures were predicted using the Mfold and RNA Structure 4.5 algorithms and parameters (Zuker 2003; Mathews et al. 2004). The lowest energy structure of the 79-nt RNA monomer is shown in Figure 1A. This structure, which has two hairpins sandwiching a 17-nt single stranded region, has a calculated ΔGo 37 of −20.2 kcal/mol. The next lowest energy structure has ΔGo 37=17.7 kcal/mol. In the latter structure, the longer stem–loop in Figure 1A was unchanged, but the stem–loop close to the 5′ end rearranged to form a hairpin with a 3:2 internal mismatch loop in the stem.
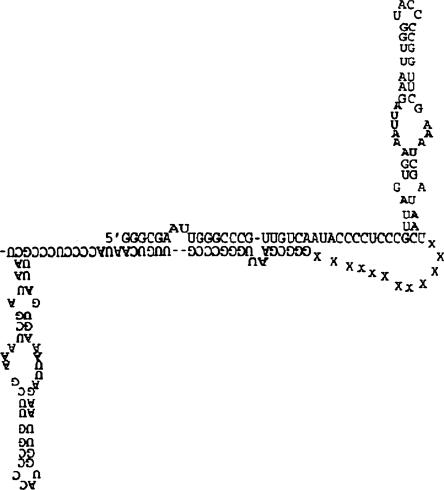
To explore what intermolecular interactions may give rise to dimer formation the Mfold secondary structure prediction algorithm was employed using a linker consisted of 10–20 unspecified nucleotides (X) to connect two 79-nt monomer sequences in a 5′-3′ to 5′-3′ fashion. The X nucleotides were constrained to be single stranded and the sequence submitted for energy minimization. The low energy structure produced for this sequence is shown in Figure 2. The free energy was –47.7 kcal/mol. The first 21-nt from the 5′ end of the 79-nt RNA is predicted to be the essential element for dimerization. The stem–loop at the 5′ end of two RNAs convert to an intermolecular duplex. The 3′ end stem–loop structure remains the same in both monomer and dimer forms.
FIGURE 2.
Predicted secondary structure of a dimer of the 79-nt RNA sequence using Mfold.
RNase H assay
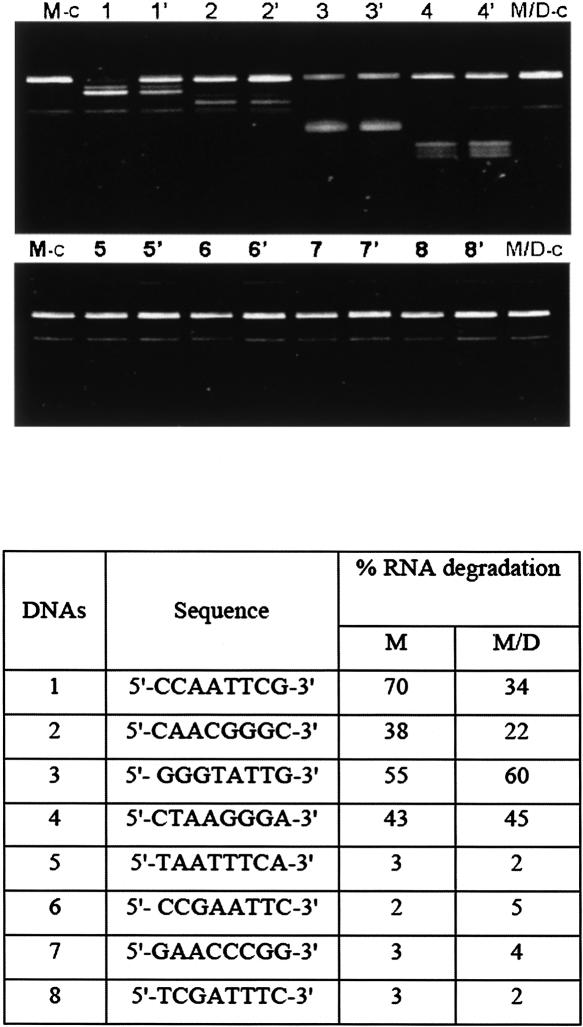
The above results provide structural models to test by experiment. An RNase H assay was carried out to probe the secondary structures of the 79-nt RNA sequence in the monomer and dimer forms using DNA oligonucleotides. RNA was prepared to give the monomer gel band (M) or a mixture of monomer and dimer bands (M/D). Figure 1A shows the location of the target sequences within the 79-nt RNA for eight DNA probes. Figure 3 shows the results from incubating 0.5 unit (U) of RNase H at 23°C for 30 min with 1.5 μM RNA and 9 μM of each DNA probe.
FIGURE 3.
RNA degradation assay using RNase H. (M-c) Control of monomer 79-nt RNA with no DNA probes; (M/D-c) Control of monomer/dimer 79-nt RNA with no DNA probes. (Lanes 1–8) Assay results of monomer 79-nt RNA incubated with numbered DNA probes given in the table below. (Lanes 1′– 8′) Assay results of the monomer/dimer sample incubated with numbered DNA probes given in the table. The table shows percent degradation of RNA in assay.
The major difference between the digestions of M and M/D samples are observed with the first two DNA oligomers. If no DNA probe was added, the 79-nt RNA band in control lanes M-c and M/D-c gave similar intensities and a faint band of faster mobility that resulted from the 2 min 90°C heating step to stop the reaction. This faint band was observed in nearly all lanes. In this assay, the intensity of the 79-nt RNA band for the M and M/D samples were measured relative to the intensity of this band in their respective control lanes. Results are tabulated in Figure 3 below the gel image. For DNA oligomer 1, the M sample (lane 1) showed twofold greater RNA degradation compared with the M/D sample in lane 1′. The RNA target sequence is the 7-nt hairpin loop at the 5′ end of the 79-nt RNA monomer (Fig. 1A). The predicted dimer structure places this target sequence in an intermolecular duplex consistent with reduced RNase H cleavage (Fig. 2). Incubating the RNA with DNA oligomer 2, the M/D sample (Fig. 3, lane 2′) exhibited 16% less degradation than incubating this DNA with the monomer or M sample (Fig. 3, lane 2). DNA oligomer 2 is complementary to a sequence predicted to be single stranded in the monomer but partially base paired in the predicted dimer structure. The six other DNA probes targeted segments further toward the 3′ end of the 79-nt RNA sequence. They showed little difference in degradation between M and M/D samples (Fig. 3). DNA probes 3 and 4 gave ∼50% degradation for both M and M/D samples. This is consistent with the prediction that these target sites have the same secondary structure in monomer and dimer, predominantly single stranded. Similarly, negligible degradation was observed for target sites 5–8, predicted to be the same in monomer and dimer forms, and part of duplex regions. The results are in qualitative agreement with expectations from the predicted secondary structures of the corresponding target regions for the monomer and dimer forms of the 79-nt RNA.
Properties of 5′ and 3′ segments of the 79-nt RNA
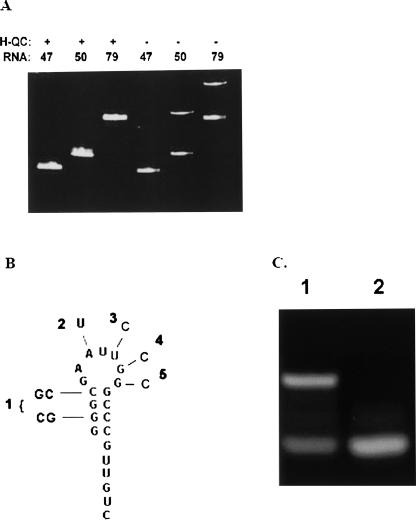
To further assess the hypothesis that the 5′ end of the RNA is responsible for dimer formation, RNA sequences containing 5′ and 3′ portions of the 79-nt RNA were examined. Figure 4A shows a native polyacrylamide gel of the 50-nt 5′-end of the 79-nt RNA, the 47-nt 3′end of the 79-nt RNA, and the 79-nt RNA. The first three lanes show the mobility of the three RNAs after they were heated and quickly cooled. All three RNAs produced only one band after this heat and cool step. Samples in the last three lanes were loaded after simply diluting from stock solutions and equilibrating at 23°C. The 50-nt and 79-nt RNAs showed dimer bands while the 47-nt RNA did not form a dimer. These results indicate that dimer formation is due to a sequence within the 50-nt 5′ portion of the 79-nt RNA.
FIGURE 4.
(A) Native polyacrylamide gel of 47-nt RNA, 50-nt RNA, and 79-nt RNA heated and quickly cooled (H-QC) prior to loading in each of first three lanes, or loaded in lanes without a heat and quick-cool step (last three lanes). (B) Predicted hairpin structure of 21-nt RNA sequence and the base changes of the five mutant 21-nt RNAs examined. (C) Native PAG of 21-nt RNA. (Lane 1) Sample diluted from stock solution and equilibrated prior to loading in lane; (lane 2) sample heated and quickly cooled prior to loading in lane.
The 5′-end 21-nt RNA sequence can form a dimer
In order to delineate the dimer forming region further, the 21-nt RNA sequence at the 5′-end of the 79-nt RNA suggested by the predicted structure of the 79-nt RNA dimer was examined. Figure 4B shows the predicted hairpin structure for the 21-nt RNA molecule. Gel electrophoresis characterization of this RNA at 2 μM strand concentration is shown in Figure 4C. The sample in lane 1 was diluted from stock solution and equilibrated for an hour at 23°C before loading. The sample in lane 2 was heated to 65°C for 2 min and quickly cooled in ice prior to loading. Two bands are observed for the untreated sample and one band for the heated and quickly cooled sample. These results indicate that the 21-nt RNA can form two conformations, which we attribute to hairpin and dimer structures. The 21-nt sequence appears to be responsible for dimer formation of the 79-nt RNA.
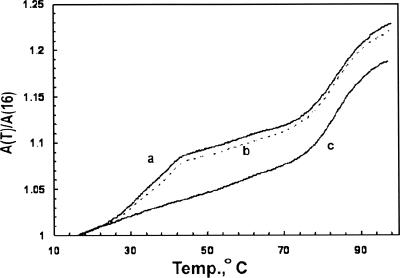
Additional evidence indicating that the 21-nt RNA can assume hairpin and dimer conformations was obtained from optical melting curves. Figure 5 shows ultraviolet (UV) absorbance versus temperature curves of the 21-nt RNA at 2 μM strand concentration without (Fig. 5, curve a) and with (Fig. 5, curve c) prior heating and quick cooling. Curve a displays a two-step absorbance increase with midpoint temperatures of Tm1=34.5 ± 0.7°C and Tm2=82.5 ± 0.5°C. Curve c exhibits only the high-temperature absorbance increase. Curve b shows the melting curve of a sample that was melted and then treated in a manner that reformed the hairpin and dimer structures (described below).
FIGURE 5.
Melting curves of 2 μM solutions of 21-nt RNA in 0.1 M KCl+5 mM NaPO4 (pH 7.5). (Curve a) First melting curve of sample after diluting from stock solution; (curve b) melting curve of sample after its denaturation and then treated as described in text; (curve c) melting curve of RNA sample following heat and quick-cool procedure.
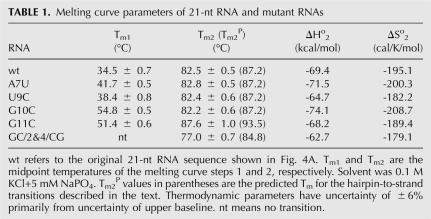
Several features of the melting curve data indicate that the high-temperature melting curve step corresponds to the hairpin to disordered single-strand transition, while the low-temperature absorbance increase corresponds to the dimer-to-hairpin conversion. The absence of the low-temperature transition after the heat and quick-cooling procedure (Fig. 5, curve c) coincides with the absent dimer band in the polyacrylamide gel experiment (Fig. 4C). The high-temperature transition was reversible as expected for a monomolecular transition, and its Tm was in good agreement with the Tm predicted for the hairpin to single-strand transition of the 21-nt sequence (Table 1, Tm2 P=87.2°C). Tm2 P was calculated from the equation Tm2 P=ΔHo H/ΔSo H, where ΔHo H and ΔSo H (the enthalpy and entropy changes, respectively) were determined from empirical thermodynamic parameters (Mathews et al. 2004; Lu et al. 2006). Although these parameters are for 37°C in a 1 M Na+ solvent, adjustments to our experimental conditions do not significantly alter the relative agreement. If one extrapolates ΔHo H and ΔSo H to ∼80°C based on an estimated heat capacity change of ΔCp=−280 cal/mol K (Bourdelat-Parks and Wartell 2005) and corrects for ionic strength (Shkel and Record 2004), the predicted Tm2 P is reduced by 6–10°C.
TABLE 1.
Melting curve parameters of 21-nt RNA and mutant RNAs
Influence of base changes on dimer formation of 21-nt RNA
The AAUU sequence in the loop of the 21-nt RNA (Fig. 4B) has the potential to form a loop–loop kissing complex of four A•U pairs that could initiate or form the dimer. To explore this possibility and examine the influence of other base changes on dimer formation, the properties of five variants of the 21-nt RNA were examined. Figure 4B illustrates the base changes that were investigated. The A at position 7 from the 5′ end was changed to a U (RNA-A7U), U at position 9 was changed to a C (RNA-U9C), G at position 10 was changed to a C (RNA-G10C), G at position 11 was changed to C (RNA-G11C), and the G•C and C•G base pairs at the second and fourth base pairs of the stem were transposed (RNA-GC/2&4/CG). All sequence variants are predicted to form a stable hairpin stem–loop structure. Predicted lowest energy self-complimentary duplex structures are illustrated in Figure 6 along with their predicted free energies at 37°C in 1 M Na+ (Mathews et al. 2004). Calculated ΔHo values for the predicted hairpin and duplex structures at 37°C are available upon request as Supplemental material.
FIGURE 6.
Predicted self-complementary duplex structures of the 21-nt RNAs examined. The predicted ΔGo 37 in kcal/mol (Mathews et al. 2004) are listed for each structure.
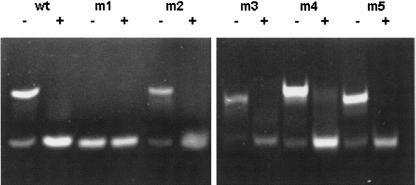
Figure 7 shows polyacrylamide gel electrophoresis (PAGE) results that characterize the influence of the base changes on the ability of the 21-nt RNA to form the hairpin and dimer bands. RNA-GC/2&4/CG produced the hairpin band whether untreated or heated and quickly cooled. The other four RNA variants, with single base changes in the loop, displayed both hairpin and dimer bands in the gel after dilution from stock solution to 2 μM. Only the hairpin band was observed after the heat and quick-cooling procedure. Melting curves of the RNAs were similar to those in Figure 5 and completely consistent with the PAGE results (data not shown). All RNAs showed two step forward melting curves except for RNA-GC/2&4/CG. The latter RNA exhibited one melting transition with a Tm of 77.0°C. The inability of RNA-GC/2&4/CG to form a dimer appears to correlate with the relatively unfavorable higher free-energy value predicted for its duplex conformation compared with the other RNAs (Fig. 6).
FIGURE 7.
Polyacrylamide gel of 21-nt RNA (wt) and the five mutant 21-nt RNA sequences (m1, m2, m3, m4, m5) with (+) and without (−) the heat and quick-cool procedure. Different intensities for sequences reflect differences in concentration (2.0–2.5 μM) and/or differences in ethidium bromide staining. The numbers of the mutant RNA sequences correspond to the identifying number of the associated base change(s) shown in Fig. 4B, e.g., m2 is RNA-A7U.
Table 1 lists the experimental Tm values of the melting curve steps for the six 21-nt RNAs as well as thermodynamic parameters evaluated from the reversible high temperature (>70°C) transition. The original 21-nt RNA or wild-type (wt) sequence, RNA-A7U, RNA-U9C, and RNA-G10C have different Tm values for their low-temperature transitions but very similar values for their high-temperature transitions. RNA-G11C exhibited the highest Tm value for the second transition. This RNA has 5 bp in its predicted hairpin stem whereas the other RNAs have 4 bp. The experimental Tm2 values of the RNAs track with the predicted Tm2 P values based on the 1 M Na+ parameters (see above). This agreement supports the assignment of the high-temperature melting curve step to the hairpin to single strand transition.
Excluding RNA-GC/2&4/CG, which produced only the high temperature transition, the first melting steps of the 21-nt RNA and its variants were not reversible upon cooling. Since this first melting step corresponds to the dimer to hairpin transition and the dimer does not reform upon cooling, we conclude that the hairpin conformations are more thermodynamically stable than the dimers at room temperature. The dimer structures represent kinetically trapped states. They were not in reversible equilibrium with the hairpin under the solution conditions employed. Although this transition is expected to be concentration dependent, the forward melting curve of the 21-nt RNA at 10-fold higher concentration (20 μM) was the same as curve a of Figure 5. Slow cooling of this sample also did not exhibit reformation of the dimer.
Freezing can induce hairpin-to-dimer conversion
The presence or absence of dimer and/or monomer forms of the 21-nt RNA and most of its variants was similar to the 79-nt RNA. Samples diluted to ∼2 μM from frozen stock solutions exhibited both hairpin and dimer conformations by PAGE with the exception of RNA-GC/2&4/CG. The dimer band dominated and the intensity ratio of dimer vs. hairpin bands remained stable at 23°C for extended periods (little or no change was observed after 120 h for 2 μM of 21-nt RNA). Following the heat and quick-cool procedure however, only the monomer hairpin band dominated even after extended incubation at 0°C or 23°C (see below). Since the dimer conformation was only observed in significant amounts following dilution from thawed stock solutions, the influence of freezing on the temperature dependent optical transition of the 21-nt RNA was examined. Curve b of Figure 5 shows the melting curve of a 21-nt RNA sample that had been previously melted (curve a) and then frozen at −10°C for over 120 h. The two-step transition closely followed the initial melting curve. If once-melted RNA was maintained at 23°C for a similar period of time, the second melting curve was the same as curve c. Freezing the RNA solution produced the dimer conformation.
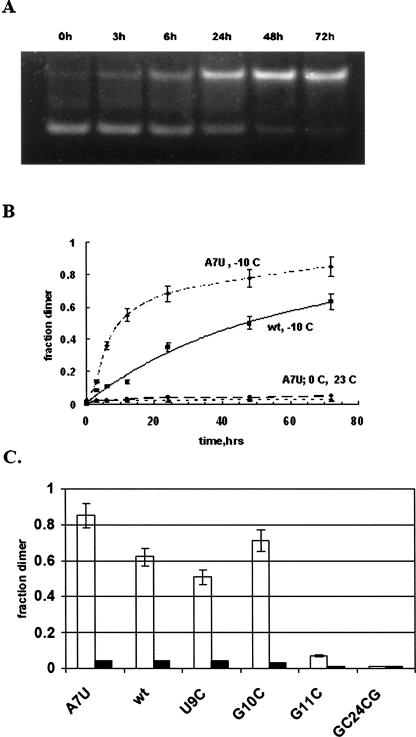
Figure 8A shows the rate of formation of dimer from hairpin for RNA-A7U at −10°C. Samples (2 μM) were heated and quickly frozen, and then incubated at −10°C for the times indicated. Samples were simultaneously thawed and analyzed on a polyacrylamide gel. The fraction of strands as dimer vs. time was evaluated from the gel image as described in Materials and Methods and plotted in Figure 8B. Approximately 85% of the RNA-A7U hairpin was converted to dimer following a 72 h incubation at −10°C. Figure 8B also plots results obtained using the original or wt sequence. Conversion to dimer in this case was ∼63% after 72 h. Samples of the wt RNA or RNA-A7U prepared in the same manner but incubated at 23°C or 0°C gave only 5% conversion to dimer. If 10-fold higher concentration of the wt RNA was incubated for 72 h at these temperatures following the heat and quick-cool procedure, about 9% of the dimer band was observed (data not shown).
FIGURE 8.
(A) 10% polyacrylamide gel of 2 μM RNA-A7U samples incubated for different times at −10°C after heat and quick-freeze procedure. (B) Plot of fraction of total strand in dimer band as a function of incubation time from gel data such as A; 2 μM RNA-A7U at −10°C (–•–), 0°C (– • –), and 23°C (- -▲- -), as well as for 2 μM RNA-wt at −10°C (–■–). (C) Fraction of strand in dimer band for all 21-nt RNAs 72 h after incubation at −10°C (open bars) or 23°C (solid bars) following heat and quick-freeze procedure. RNA concentrations were 2 μM.
Figure 8C shows the fraction of total strand in dimer conformation following the heat and quick-freeze procedure for all 21-nt RNAs at 2 μM concentration at −10°C and 23°C after 72 h. RNA-GC/2&4/CG shows essentially no dimer band at either temperature while RNA-U9C and RNA-G10C display 51% and 70% dimer band, respectively, at −10°C and 5% or less at 23°C. RNA-G11C only recovered 8% of the dimer conformation after 72 h at −10°C. We note that this RNA forms a more stable hairpin than the other RNAs. Preliminary experiments indicate that higher concentrations of this RNA are needed to promote significant dimer formation in frozen solution in this time frame. Figure 7 shows ∼75% dimer band for an RNA-G11C sample that had been diluted in two steps from its stock solution (500 μM) stored at −20°C. The results indicate that the extent of hairpin to dimer conversion in frozen solution depends on the specific RNA sequence. As indicated in Table 1 and Figure 6, the sequence of the variants can be expected to affect the relative thermodynamic stability of dimer versus hairpin forms.
A frozen solution of RNA and other solutes can be described by a solid phase of pure water (ice) in equilibrium with a spatially distributed liquid phase containing nearly all of the solutes (Franks 1985; Strambini and Gonnelli 2007). Freezing concentrates the ions as well as the RNA in the liquid phase. As noted in the introduction, a number of reactions that could potentially have been involved in the prebiotic evolution of an RNA world can occur in frozen microenvironments. The current finding demonstrates that freezing solutions of short stable RNA hairpins can drive the formation of intermolecular RNA complexes.
The ability of RNA-A7U and RNA-U9C to readily form dimer conformations argues against a loop–loop complex being either the dimer structure or an intermediate in hairpin-to-dimer conversion. It is more likely that the dimers of the 21-nt RNAs correspond to duplex secondary structures such as the ones illustrated in Figure 6. A proposed pathway for hairpin-to-dimer conversion is sketched in Figure 9. It involves the juxtaposition of two hairpin molecules that enable fluctuational base pair opening in the stems to initiate intermolecular base pairs that propagate into a duplex form. Previous studies on blunt end RNA hairpins in liquid solution suggested that duplex formation may occur by coaxial stacking of hairpin stems, partial end melting, intermolecular base pairing, followed by cruciform extrusion (Bernacchi et al. 2005; Liu et al. 2005). The single-stranded tails of the 21-nt RNA mitigate against this pathway for the RNA sequences examined. While more detailed thermodynamic, kinetics, and structural studies are required to determine the structures, pathway(s), and biophysical factors that are involved in formation of intermolecular RNA complexes in a frozen environment, the results illustrate the surprising nature of RNA conformational rearrangements that are possible in subzero temperatures.
FIGURE 9.
Proposed conformational pathway for conversion of two hairpin monomers of 21-nt RNA to the duplex dimer form.
MATERIALS AND METHODS
RNA molecules
The pGEM7Zf(+) plasmid from Promega Inc. was modified as described by Li and Wartell (1998) to provide templates for run-off transcription from a T7 RNA polymerase promoter. The modified plasmid is referred to as pN1. RNA transcripts 79-nt long were produced using HindIII-cut pN1 plasmid as template. Figure 1A shows the predicted secondary structure of the 79-nt RNA sequence using Mfold (Zuker 2003). RNA molecules corresponding to the first 50-nt of the 79-nt RNA were transcribed using EcoRI-cut pN1 plasmid as the template. Transcription reactions employed volumes of 0.25–1.0 mL containing 10 mM dithiothreitol; 500 μM of ATP, CTP, GTP and UTP; 1× transcription buffer (50 mM Tris-HCl at pH 7.5, 10 mM NaCl, 6mM MgCl2, and 2mM spermidine); 25 units/mL of RNase inhibitor; 100 μg/mL of BSA; 120 units/mL of T7 RNA polymerase; and 100 μg/mL of digested pN1 plasmid DNA. Transcription reactions were carried out in a 37°C water bath for 3 h. RNA transcripts were purified from the DNA template and small reaction components using serial filtration steps with 100-kD and 10-kD filtration units. A 47-nt RNA corresponding to the 47 nt from the 3′ end of the 79-nt RNA was produced by site-specific RNase H cleavage of the 79-nt RNA using a 2′-O′-methyl-RNA/DNA chimera (5′-CmUmAmAmGmGGATGmGmGmUm-3′) (Inoue et al. 1988). The RNA was purified by 12% denaturing PAGE and elution (Sambrook and Russell 2001). Concentration of the transcribed RNAs and its products were estimated from UV absorbance at 260 nm assuming 1.0 OD at 23°C equals 40 μg/mL. The 21-nt RNA sequence corresponding to the 5′ end of the 79-nt RNA and its sequence variants were obtained commercially. Their concentrations were estimated based on the amounts stated by the manufacturer, as well as from extinction coefficients calculated for each single strand based on dinucleotide frequencies (Bourdelat-Parks and Wartell 2005) and the 260 nm absorbance value linearly extrapolated to 25°C from absorbance vs. temperature plots in the single stranded region. Values obtained by these two methods were ±10%. RNA stock solutions were stored at −20°C at concentrations of 20–100 μM for the transcribed RNAs and 200–500 μM for the 21-nt RNA oligomers.
Sedimentation equilibrium experiments
Sedimentation equilibrium analysis was carried out using a method developed for a preparative ultracentrifuge (Bothwell et al. 1978) with minor modifications (Dripps and Wartell 1987). Three 32P 5′-end-labeled DNA molecules were used as molecular weight markers. Two DNAs were single-stranded oligomers, 25- and 47-nt long, and the third DNA was a 47-bp duplex. The three DNAs along with the RNA sample were centrifuged in separate tubes at 20,000 rpm for 22–24 h. RNA was labeled by an in vitro transcription reaction using 32P[UTP] (Sambrook and Russell 2001). Labeled nucleic acids were combined with unlabeled ones to provide the desired concentration. Each nucleic acid sample was at a concentration of 5–10 μg/mL. The RNA concentration was ∼0.5 to 1 μM. The solvent was TBM buffer (90 mM Tris-borate at pH 8.2, 0.1 mM EDTA, and 5 mM MgCl2) containing 5 μg/μL ficol to stabilize convection. Some experiments also contained RNase inhibitor (0.4 units/μL) to prevent RNA degradation. Each tube contained 100 μL. After centrifugation, the uppermost 40 μL and the remaining 60 μL at the bottom were removed from each tube. The amount of nucleic acid in each aliquot was determined using scintillation counting. The fraction of the total initial nucleic acid in the upper 40 μL after centrifugation, F, was determined. The average molecular weight of the RNA sample was interpolated from the linear plot of log F vesrsus molecular weight of the DNA standards (Dripps and Wartell 1987).
RNase H Assay
“Master mixture” (40 μL) solutions were made containing 0.5 units of Escherichia coli RNase H1 (USB) and the 79-nt RNA prepared in either the M form or M/D mixture. The solutions were incubated for 15 min at 23°C in 1X RNase H buffer (20mM Tris-HCl at pH 7.8, 40 mM KCl, 8 mM MgCl2, 1 mM DTT) with 0.15 unit of RNase inhibitor. From this mixture, 7 μL was added to each reaction tube with 3 μL of a given DNA oligomer to give final concentrations of 1.5 μM RNA and 9 μM DNA oligomer. The reactions were incubated at 23°C for 30 min and then heated at 90°C for 2 min and quickly cool on ice. They were mixed with ficol loading buffer, and immediately run into a 12% native PAG using TBE buffer. Nucleic acid bands were visualized by staining the gels with ethidium bromide. Gel images were captured with an AlphaImager 2000 gel documentation system (Alpha Innotech Inc.). Exposure times were adjusted to produce images of the uncut RNA band in a linear intensity range. The relative intensities of the 79-nt RNA bands were determined using the documentation image analysis program. The evaluated percentages of digested 79-nt RNA were reproducible within ±5%.
Polyacrylamide gel characterization of RNAs
The RNAs were characterized using a 10% or 12% native polyacrylamide gel (37.5:1 polyacrylamide:bisacrylamide) with TBE buffer or TBE buffer with 5 mM MgCl2 for the transcribed RNAs or 1 or 2 mM MgCl2 for the 21-nt RNAs. Transcribed RNAs were also characterized in 12% denaturing polyacrylamide gels contained 8 M urea. RNA samples loaded into gel lanes were 10–15 μL in volume with concentrations of 0.5–2 μM for most experiments. One microliter of loading solution (0.025% bromophenol blue and 50% glycerol) was added prior to loading samples. Electrophoresis was carried out at 23°C at 90–100 volts, and the gels visualized by staining with ethidium bromide. Samples that were heated and quickly cooled prior to gel characterization were placed in an 85°C or 65°C bath. The higher temperature was employed in studies on the 79-nt RNA while 65°C was employed with the 21-nt RNAs. After heating for 2 min, samples were immediately placed in ice water for 5 min.
Quantification of dimer and monomer bands for the 21-nt RNAs was made on gel images obtained using an AlphaImager 2000 following ethidium bromide staining, and analyzed using the Multigauge V 3.0 software (Fujifilm). In order to convert band intensities of hairpin and dimer to concentrations, normalization factors were determined. Identical amounts of RNA were loaded in adjacent lanes. One lane contained an untreated sample and exhibited dimer and hairpin bands, while the other lane contained a sample that had been heated and quickly cooled to produce only hairpin band. The relation of [moles strand in hairpin]/[band intensity], ρh, to [moles strand in dimer]/[band intensity], ρd, were determined from the two equations that expressed the known amount of RNA of each lane in terms of band intensities and the unknowns ρh, ρd. We found ρh=(1.25 ± 0.20) ρd for the RNAs. The average corresponds to the dimer molecule binding 2.5 times more ethidium bromide than the hairpin molecule.
Freezing reaction assays
The effect of freezing on the conformational properties of the 21-nt RNA and its sequence variants was carried out as follows. RNA samples were prepared typically at 2 μM strand concentration in a solvent of 0.1 M KCl and 5 mM NaPO4 (pH 7.5). Samples (10 μL) in 0.5-mL conical microcentrifuge tubes were heated and quickly cooled in ice as described above. They were then immediately immersed in a −70°C ethanol bath for 5 min and transferred to a freezer set at −10°C and incubated for different lengths of time. Experiments in which samples were incubated at 0°C or 23°C were frozen in the ethanol bath as above, and then transferred to the stated temperatures. Figure 8 plots were based on two or more experiments. In other experiments, 10 mM Tris-HCl (pH 8.0) replaced the 5 mM NaPO4 buffer component. No major differences in outcome were noted.
UV absorbance melting curves
UV absorbance was employed to monitor the melting curves of the 21-nt RNAs. RNA samples were prepared at 2 μM strand concentration in 0.1 M KCl and 5 mM NaPO4 (pH 7.5). They were placed in a 1-cm path length quartz cuvette, and a Cary 100 spectrophotometer (Varian Inc.) was used to monitor absorbance vs. temperature at 268 nm with a heating rate of 1.0°C/minute and cooling rates of 0.5°C or 0.2°C/min. Temperature was measured with a platinum resistance probe inserted into an adjacent solvent cell. Two or more melting curves were obtained for each sample. A van't Hoff analysis was used to evaluate the enthalpy, ΔHo, and entropy, ΔSo, change of the hairpin to single strand transitions as described previously (Bourdelat-Parks and Wartell 2005). A two-state transition was assumed and a nonlinear least squares regression was employed to evaluate ΔHo and ΔSo pairs that best fit the shape of the normalized melting transitions.
SUPPLEMENTAL DATA
All Supplemental Materials are available by sending an e-mail request, entitled “RNA Enthalpies,” to rwartell@gatech.edu.
ACKNOWLEDGMENTS
This work was supported by funds from the College of Sciences, Georgia Institute of Technology.
Footnotes
Article published online ahead of print. Article and publication date are at http://www.rnajournal.org/cgi/doi/10.1261/rna.433307.
REFERENCES
- Badorrek, C.S., Weeks, K.M. Architecture of a γ retroviral genomic RNA dimer. Biochemistry. 2006;45:12664–12672. doi: 10.1021/bi060521k. [DOI] [PubMed] [Google Scholar]
- Bernacchi, S., Ennifar, E., Toth, K., Walter, P., Langowski, J., Dumas, P. Mechanism of hairpin-duplex conversion for the HIV-1 dimerization initiation site. J. Biol. Chem. 2005;280:40112–40121. doi: 10.1074/jbc.M503230200. [DOI] [PubMed] [Google Scholar]
- Bothwell, M.A., Howlett, G.J., Schachman, H.K. A sedimentation equilibrium method for determining molecular weights of proteins with a tabletop high speed air turbine centrifuge. J. Biol. Chem. 1978;253:2073–2077. [PubMed] [Google Scholar]
- Bourdelat-Parks, B.N., Wartell, R.M. Thermodynamics of RNA duplexes with tandem mismatches containing a uracil–uracil pair flanked by C•G/G•C or G•C/A•U closing base pairs. Biochemistry. 2005;44:16710–16717. doi: 10.1021/bi051659q. [DOI] [PubMed] [Google Scholar]
- Chen, C., Sheng, S., Shao, Z., Guo, P. A dimer as a building block in assembling RNA. A hexamer that gears bacterial virus phi29 DNA-translocating machinery. J. Biol. Chem. 2000;275:17510–17516. doi: 10.1074/jbc.M909662199. [DOI] [PubMed] [Google Scholar]
- D'Souza, V., Melamed, J., Habib, D., Pullen, K., Wallace, K., Summers, M.F. Identification of a high affinity nucleocapsid protein binding element within the Moloney murine leukemia virus ψ-RNA packaging signal: Implications for genome recognition. J. Mol. Biol. 2001;314:217–232. doi: 10.1006/jmbi.2001.5139. [DOI] [PubMed] [Google Scholar]
- De Tapia, M., Metzler, V., Mougel, M., Ehresmann, B., Ehresmann, C. Dimerization of MoMuLV genomic RNA: Redefinition of the role of the palindromic stem–loop H1 (278-303) and new roles for stem–loops H2 (310-352) and H3 (355-374) Biochemistry. 1998;37:6077–6085. doi: 10.1021/bi9800303. [DOI] [PubMed] [Google Scholar]
- Dripps, D., Wartell, R.M. DNA bending induced by the catabolite activator protein allows ring formation of a 144 bp DNA. J. Biomol. Struct. Dyn. 1987;5:1–13. doi: 10.1080/07391102.1987.10506370. [DOI] [PubMed] [Google Scholar]
- Ferrandon, D., Koch, I., Westhof, E., Nusslein-Volhard, C. RNA-RNA interaction is required for the formation of specific bicoid mRNA 3′ UTR-STAUFEN ribonucleoprotein particles. EMBO J. 1997;16:1751–1758. doi: 10.1093/emboj/16.7.1751. [DOI] [PMC free article] [PubMed] [Google Scholar]
- Franks, F. Biophysics and biochemistry at low temperatures. Cambridge University Press; Cambridge, UK: 1985. [Google Scholar]
- Gast, F.U., Kempe, D., Sanger, H.L. The dimerization domain of potato spindle tuber viroid, a possible hallmark for infectious RNA. Biochemistry. 1998;37:14098–14107. doi: 10.1021/bi980830d. [DOI] [PubMed] [Google Scholar]
- Green, M.R. Pre-mRNA splicing. Annu. Rev. Genet. 1986;20:671–708. doi: 10.1146/annurev.ge.20.120186.003323. [DOI] [PubMed] [Google Scholar]
- Grosjean, H., Soll, D.G., Crothers, D.M. Studies of the complex between transfer RNAs with complementary anticodons. I. Origins of enhanced affinity between complementary triplets. J. Mol. Biol. 1976;103:499–519. doi: 10.1016/0022-2836(76)90214-x. [DOI] [PubMed] [Google Scholar]
- Hibbert, C.S., Mirro, J., Rein, A. mRNA molecules containing murine leukemia virus packaging signals are encapsidated as dimers. J. Virol. 2004;78:10927–10938. doi: 10.1128/JVI.78.20.10927-10938.2004. [DOI] [PMC free article] [PubMed] [Google Scholar]
- Inoue, H., Hayase, Y., Iwai, S., Ohtsuka, E. Sequence-specific cleavage of RNA using chimeric DNA splints and RNase H. Nucleic Acids Symp. Ser. 1988;19:135–138. [PubMed] [Google Scholar]
- Koslowsky, D.J. A historical perspective on RNA editing: How the peculiar and bizarre became mainstream. Methods Mol. Biol. 2004;265:161–197. doi: 10.1385/1-59259-775-0:161. [DOI] [PubMed] [Google Scholar]
- Lavorgna, G., Dahary, D., Lehner, B., Sorek, R., Sanderson, C.M., Casari, G. In search of antisense. Trends Biochem. Sci. 2004;29:88–94. doi: 10.1016/j.tibs.2003.12.002. [DOI] [PubMed] [Google Scholar]
- Lease, R.A., Woodson, S.A. Cycling of the Sm-like protein Hfq on the DsrA small regulatory RNA. J. Mol. Biol. 2004;344:1211–1223. doi: 10.1016/j.jmb.2004.10.006. [DOI] [PubMed] [Google Scholar]
- Li, J., Wartell, R.M. RNase H1 can catalyze RNA/DNA hybrid formation and cleavage with stable hairpin or duplex DNA oligomers. Biochemistry. 1998;37:5154–5161. doi: 10.1021/bi9730801. [DOI] [PubMed] [Google Scholar]
- Liu, H.W., Cosa, G., Landes, C.F., Zeng, Y., Kovaleski, B.J., Mullen, D.G., Barany, G., Musier-Forsyth, K., Barbara, P.F. Single-molecule FRET studies of important intermediates in the nucleocapsid-protein-chaperoned minus-strand transfer step in HIV-1 reverse transcription. Biophys. J. 2005;89:3470–3479. doi: 10.1529/biophysj.105.065326. [DOI] [PMC free article] [PubMed] [Google Scholar]
- Lu, Z.J., Turner, D.H., Mathews, D.H. A set of nearest neighbor parameters for predicting the enthalpy change of RNA secondary structure formation. Nucleic Acids Res. 2006;34:4912–4924. doi: 10.1093/nar/gkl472. [DOI] [PMC free article] [PubMed] [Google Scholar]
- Mathews, D.H., Disney, M.D., Childs, J.L., Schroeder, S.J., Zuker, M., Turner, D.H. Incorporating chemical modification constraints into a dynamic programming algorithm for prediction of RNA secondary structure. Proc. Natl. Acad. Sci. 2004;101:7287–7292. doi: 10.1073/pnas.0401799101. [DOI] [PMC free article] [PubMed] [Google Scholar]
- Monnard, P.A., Kanavarioti, A., Deamer, D.W. Eutectic phase polymerization of activated ribonucleotide mixtures yields quasiequimolar incorporation of purine and pyrimidine nucleobases. J. Am. Chem. Soc. 2003;125:13734–13740. doi: 10.1021/ja036465h. [DOI] [PubMed] [Google Scholar]
- Oroudjev, E.M., Kang, P.C., Kohlstaedt, L.A. An additional dimer linkage structure in Moloney murine leukemia virus RNA. J. Mol. Biol. 1999;291:603–613. doi: 10.1006/jmbi.1999.2984. [DOI] [PubMed] [Google Scholar]
- Paillart, J.C., Marquet, R., Skripkin, E., Ehresmann, C., Ehresmann, B. Dimerization of retroviral genomic RNAs: Structural and functional implications. Biochimie. 1996;78:639–653. doi: 10.1016/s0300-9084(96)80010-1. [DOI] [PubMed] [Google Scholar]
- Renz, M., Lohrmann, R., Orgel, L.E. Catalysts for the polymerization of adenosine cyclic 2′,3′-phosphate on a poly (U) template. Biochim. Biophys. Acta. 1971;240:463–471. doi: 10.1016/0005-2787(71)90703-9. [DOI] [PubMed] [Google Scholar]
- Sambrook, J., Russell, D. Molecular Cloning: A Laboratory Manual. 3rd ed. Cold Spring Harbor Laboratory Press; Cold Spring Harbor, NY: 2001. [Google Scholar]
- Shkel, I.A., Record M.T., Jr Effect of the number of nucleic acid oligomer charges on the salt dependence of stability (ΔG37°) and melting temperature (Tm): NLPB analysis of experimental data. Biochemistry. 2004;43:7090–7101. doi: 10.1021/bi036225e. [DOI] [PubMed] [Google Scholar]
- Storz, G., Opdyke, J.A., Zhang, A. Controlling mRNA stability and translation with small, noncoding RNAs. Curr. Opin. Microbiol. 2004;7:140–144. doi: 10.1016/j.mib.2004.02.015. [DOI] [PubMed] [Google Scholar]
- Strambini, G.B., Gonnelli, M. Protein stability in ice. Biophys. J. 2007;92:2131–2138. doi: 10.1529/biophysj.106.099531. [DOI] [PMC free article] [PubMed] [Google Scholar]
- Vlassov, A.V., Johnston, B.H., Landweber, L.F., Kazakov, S.A. Ligation activity of fragmented ribozymes in frozen solution: Implications for the RNA world. Nucleic Acids Res. 2004;32:2966–2974. doi: 10.1093/nar/gkh601. [DOI] [PMC free article] [PubMed] [Google Scholar]
- Wittenhagen, L.M., Kelley, S.O. Dimerization of a pathogenic human mitochondrial tRNA. Nat. Struct. Biol. 2002;9:586–590. doi: 10.1038/nsb820. [DOI] [PubMed] [Google Scholar]
- Zuker, M. Mfold web server for nucleic acid folding and hybridization prediction. Nucleic Acids Res. 2003;31:3406–3415. doi: 10.1093/nar/gkg595. [DOI] [PMC free article] [PubMed] [Google Scholar]


