Fig. 6.

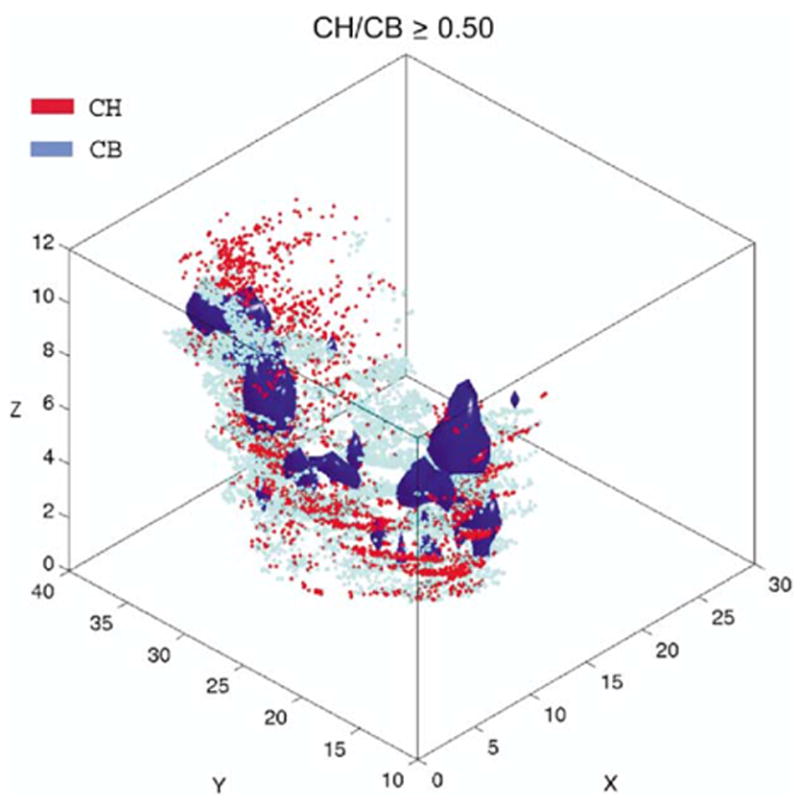
The iso-relational volumes of CH/CB rendered with violet surfaces (d ≥ 5 cells/250 × 250 × 50 μm unit spaces) were superimposed with scatter plot maps of all cells from the two neuronal populations.

The iso-relational volumes of CH/CB rendered with violet surfaces (d ≥ 5 cells/250 × 250 × 50 μm unit spaces) were superimposed with scatter plot maps of all cells from the two neuronal populations.