Abstract
The application of multiple-stage ion-trap (IT) mass spectrometric methods for the structural characterization of cardiolipin (CL), a 1,3-bisphosphatidyl-sn-glycerol that consists of four fatty acyl chains and three glycerol backbones (designated as A, B, and central glycerol, respectively), as the sodiated adduct ions in the positive-ion mode was evaluated. Following collisionally activated dissociation (CAD), the [M − 2H + 3Na]+ ions of CL yield two prominent fragment ion pairs that consist of the phosphatidyl moieties attached to the 1′- and 3′-position of the central glycerol, respectively, resulting from the differential losses of the diacylglycerol moieties containing A and B glycerol, respectively. The results are consistent with those previously described for the [M − H]− and [M − 2H + Na]− ions in the negative-ion mode, thus permitting assignment of the two phosphatidyl moieties attached to the 1′- or 3′-position of the central glycerol. The identities of the fatty acyl substituents and their positions on the glycerol backbones (glycerol A and B) are deduced from further degradation of the above ion pairs that give the fragment ions reflecting the fatty acid substituents at the sn-1 (or sn-1′) and sn-2 (or sn-2′) positions. The ions that arise from losses of the fatty acid substituents at sn-1 and sn-1′, respectively, are prominent, but the analogous ions from losses of the fatty acid substituents at sn-2 and sn-2′, respectively, are of low abundance in the MS2 product-ion spectra. This feature further confirms the assignment of the positions of the fatty acid substituents. The similar IT multiple-stage mass spectrometric approaches including MS2 and MS3 for structural characterization of CL using its [M + Na]+and the [M − H + 2Na]+ ions are also readily applicable. However, their uses for structural characterization are less desirable because formation of the [M + Na]+ and the [M − H + 2Na]+ ions for CL is not predictable.
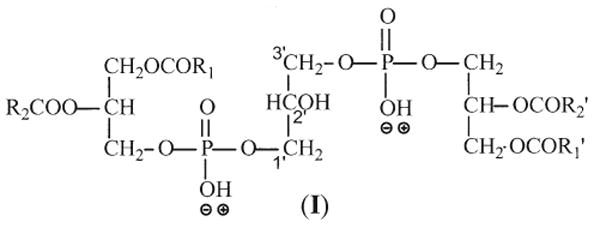
Cardiolipin (CL) (I) is a 1,3-bisphosphatidyl-sn-glycerol, which consists of a phosphatidylglycerol linked to a phosphoglyceride skeleton [1, 2]. Because the molecular species of cardiolipin are complex due to the diversity of different chain lengths and the varying degrees of unsaturation for the fatty acid substituents, as well as due to the permutations of the four fatty acyl substituents that result in a large number of potential combinations, unraveling the structure of cardiolipin has been a very difficult task [3–5].
ESI with tandem mass spectrometry including tandem quadrupole [6], quadrupole time-of-flight (Q-TOF) [7], and ion-trap [8] instruments has emerged as a powerful tool in the characterization of cardiolipin and glucosylcardiolipin as the [M − H]− and [M − 2H + Na]− ions in the negative-ion mode, as well as the [M − 2H + 3Na]+ ion in the positive-ion mode. The subclasses of cardiolipin of glucosyl-, alanyl-, and lysocardiolipins, also were previously characterized by FAB with sector mass spectrometer [9]. These methods are useful for identification of the fatty acyl substituents but are not useful for determination of their positions on the glycerol backbone.
Recently, we described the approaches using multiple- stage ion-trap mass spectrometric methods for the characterization of CLs as their [M − H]− [10] and [M − 2H + Na]− ions [11] generated by ESI in the negative-ion mode. The methods permit the structure of complex cardiolipins, including the identities of the fatty acyl substituents and their positions on the glycerol backbone to be unveiled in detail. In this report, we describe the positive-ion multiple-stage IT mass spectrometric approach for characterization of CL as the sodiated ions in the forms of [M − 2H + 3Na]+, [M − H + 2Na]+, and [M + Na]+.
Materials
Cardiolipins (received as disodium salts) isolated from E. coli were purchased from Avanti Polar Lipid (Alabaster, AL). All chemicals used in the analysis were purchased from Fisher Scientific (Pittsburgh, PA).
Methods
Mass Spectrometry
Low-energy CAD tandem mass spectrometry experiments were conducted on a Finnigan (San Jose, CA) LCQ DECA ion-trap mass spectrometer (ITMS) with the X-Calibur operating system. The methanolic CL mixture from E. coli (10 pmol/uL) was continuously infused (3 uL/min) to the ESI source, where the skimmer was set at ground potential, the electrospray needle was set at 4.5 kV, and temperature of the heated capillary was 260 °C. The automatic gain control of the ion trap was set to 5 × 10⁷, with a maximum injection time of 400 ms. Helium was used as the buffer and collision gas at a pressure of 1 × 10⁻³ mbar. A enhanced resolution scan (defined as zoom scan by the vendor) was used to acquire the baseline resolved full-scan mass spectra. The MSn experiments were carried out with a relative collision energy ranged from 30 to 40% and with an activation q value at 0.25. The activation time was set at 100 ms. Mass spectra were accumulated in the profile mode, typically for 3–5 min for MS2- and MS3-spectra. The mass resolution of the instrument was tuned to 0.6 Da at half peak height.
Nomenclature
To simplify data interpretation, we adopt the rules recommended by IUPAC with modification for designation of CL. Briefly, the three glycerol moieties are designated as A, B, and central glycerol (Scheme 1). The stereospecific numbering (sn) of the C1A and C2A (A glycerol) carbons are designated as sn-1 and sn-2, respectively. The C1B and C2B (B glycerol) carbons are designated as sn-1′ and sn-2′, respectively. The carbon number of the central glycerol is designated as C-1′, C-2′, and C-3′ with the C-1′ attached to the phosphatidic moiety with glycerol A. Abbreviation of cardiolipin, such as (16:0/16:1)(18:0/18:1)-CL signifies that the 16:0-, 16:1-, 18:0-, and 18:1-fatty acyl substituents attach to C1A, C2A, C1B, and C2B, respectively. The product-ion spectra from MSn (n = 2, 3, 4) experiments are denoted as the MSn-spectra (n = 2, 3, 4).
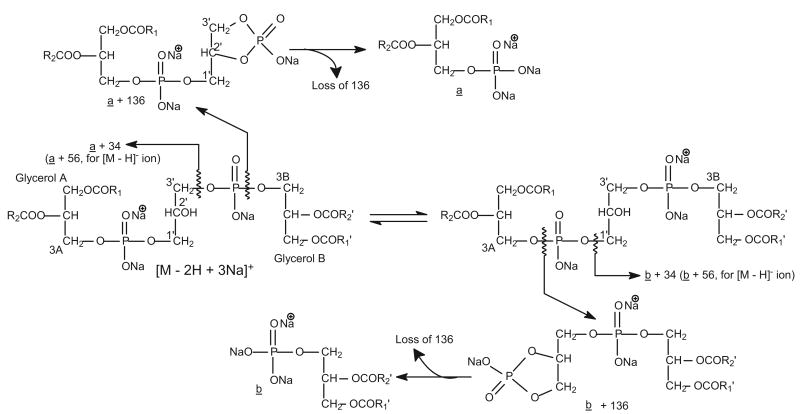
Scheme 1.
The fragmentation processes proposed for formation of the [a + 136] (or [b + 136]), [a + 34] (or [b + 34]), and [a] (or [b]) ions for the [M − 2H + 3Na]+ ions of CL. The fragmentation pathways are consistent with those observed for the [M − H]− and [M − 2H + Na]− ions.
Results and Discussion
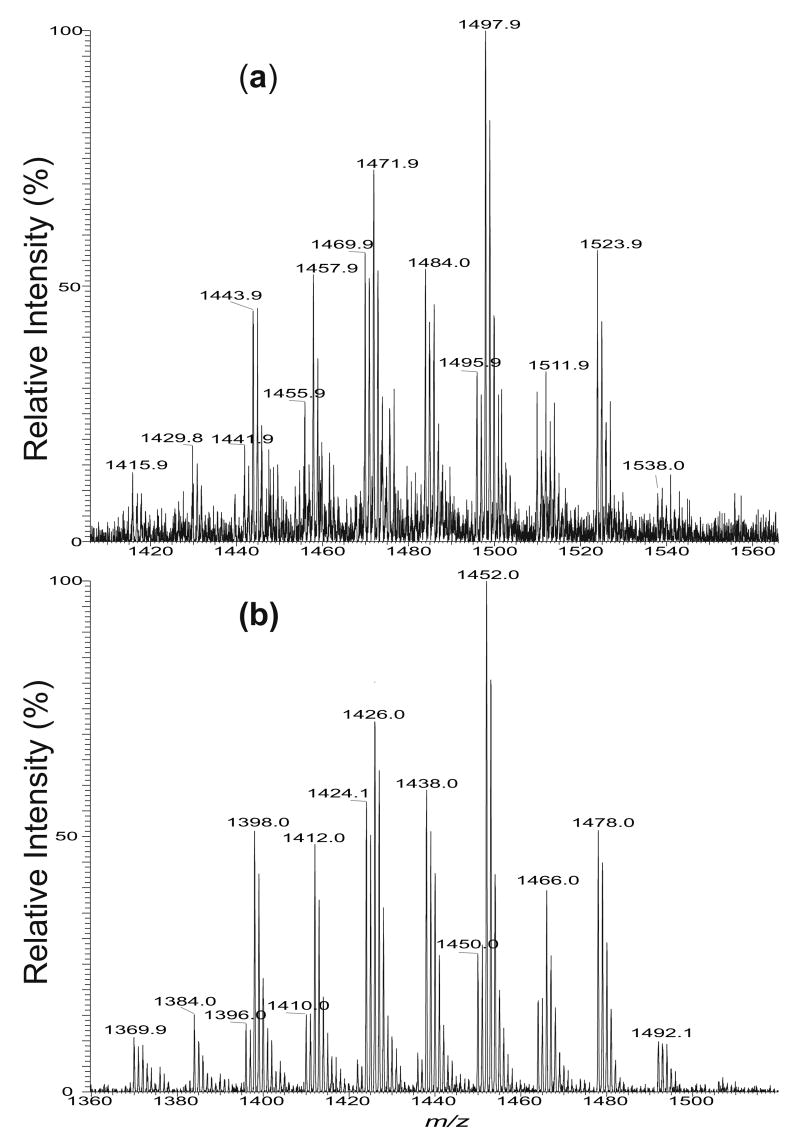
In the positive-ion mode, the methanolic solution of disodium salt of cardiolipin mixture, for example, from E. coli, forms mainly the [M − 2H + 3Na]+ ions (Figure 1a), but the sensitivity is nearly one order less than that observed as the [M − 2H + Na]− ion in the negative-ion mode (Figure 1b). The profiles of the enhanced resolution ESI mass spectra of the [M − 2H + 3Na]+ ions (Panel a) and the [M − 2H+ Na]− ions (Panel b) are similar, and are also identical to that obtained as the [M − H]− ions from the same mixture in which Na+ has been removed (data not shown). The ions in the forms of [M − H + 2Na]+ and [M + Na]+ were observed in the positive-ion mode when Na+ was not completely removed from the solution (data not shown). The characterization of cardiolipins as the sodiated adduct ions using multiple-stage IT mass spectrometry is described below.
Figure 1.
The zoom scan ESI/MS spectra of (a) the [M − 2H + 3Na]+ ions and (b) the [M − 2H + Na]− ions of the cardiolipin mixture isolated from E. coli.
The Fragmentation Processes of the [M − 2H+ 3Na]+ ions of Cardiolipins
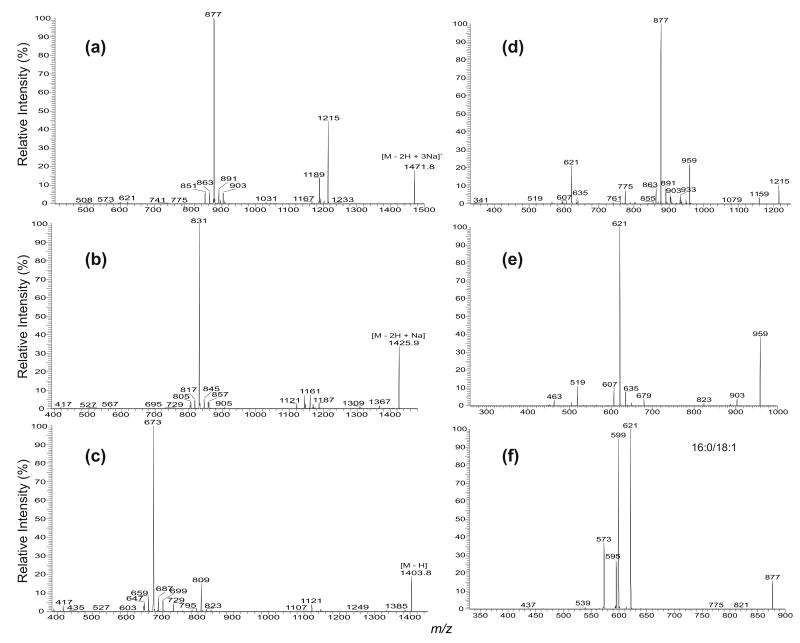
Similar to the major fragmentation processes that were previously reported for the [M − 2H + Na]− and [M − H]− ions of CL [10, 11], the [M − 2H + 3Na]+ ions of CL mainly undergo cleavages of the C(3B)O–P and the C(3A)O–P bonds, following resonance excitation in an ion-trap. As shown in Figure 2, the MS2-spectrum of the [M − 2H + 3Na]+ ion of (16:0/18:1)(16:0/18:1)-CL at m/z 1471.9 (Panel a) is dominated by the (a + 136) and (b + 136) ions at m/z 877 (Scheme 1), analogous to the ion at m/z 831 observed for the [M − 2H + Na]− ion at m/z 1425.9 (Panel b) [11]. The ion is also analogous to the m/z 809 ion observed for the [M − H]− ion at m/z 1403 (Panel c). However, the ion at m/z 809 gives rise to a prominent phosphatidic anion at m/z 673 (a and b) by further loss of 136 [10]; while the analogous ion at m/z 741 (877 – 136) from consecutive loss of 136 is of low abundance in the MS2-spectrum of m/z 1471 (Figure 2a). The ions at m/z 775 ([a + 34] and [b + 34]), arising from loss of a glycerophosphatidic acid as a sodium salt and analogous to the ion at m/z 729 observed for the [M − 2H + Na]− ion at m/z 1425.9 (Figure 2b) [11] and the [M − H]− ion at m/z 1403 (Figure 2c) [10] are also of low abundance.
Figure 2.
The IT MS2-spectra of (16:0/18:1)(16:0/18:1)-CL from (a) the [M − 2H + 3Na]+ ion at m/z 1471.9, (b) the [M − 2H + Na]− ion at m/z 1425.9, and (c) the [M − H]− ion at m/z 1403.9. The IT MS3-spectra of the m/z 1215 ion (1471→ 1215) (d), the IT MS4-spectrum of the m/z 959 ion (1471→1215 → 959) (e), and the IT MS3-spectrum of the m/z 877 ion (1471 → 877) (f) identify the phosphatidyl moieties. Ions at m/z 850, 851, 903, 904 in (a), ions at m/z 804, 805, 857, 858 in (b), and ions at m/z 646, 647, 699, 700 in (c) are from second isotopic contribution of the m/z 1469.9 ([M − 2H + 3Na]+), 1423.9 ([M − 2H + Na]−), and 1401.9 ([M − H]−) ions, respectively, which give the same nominal masses as the precursor ions.
In Figure 2a, the m/z 1215 (1471 – 256) ion reflecting loss of the 16:0-fatty acid substituent at sn-1 (or sn-1′ ) is more abundant than the m/z 1189 (1471 – 282) ion, arising from loss of the 18:1-fatty acid substituent at sn-2 (or sn-2′). The results indicate that the 18:1- and 16:0-fatty acyl substituents are located at sn-2 (or sn-2′) and sn-1 (or sn-1′) of the glycerol A (or B), respectively. This is in agreement with the notion that when the alkali adduct ions of glycerophospholipids were subjected to low-energy CAD in the positive-ion mode, the dissociation leading to loss of the fatty acid substituent at sn-1 is more facile than that at sn-2, because the α-hydrogen of the fatty acyl substituent at sn-2 (or sn-2′) that participates in the loss of R1CO2H (or R1′CO2H) is more labile than that at sn-1 (or sn-1′) [12–15]. This differential loss of the fatty acid substituents dependent on their position on the glycerol backbone provides a simple means for assignment of the position of the fatty acid substituents.
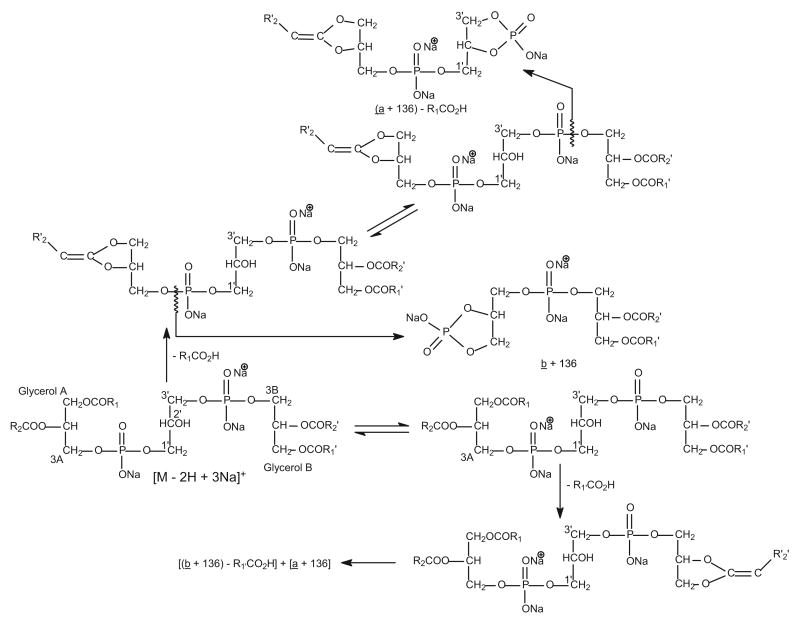
The major fragmentation processes that cleave the C(3B)O–P and the C(3A)O–P bonds are also seen for the ions that undergo primary loss of the fatty acid substituent. This is shown by the MS3-spectrum of the ion at m/z 1215 (1471 → 1215, Figure 2d), following loss of one of the 16:0-fatty acid substituent, as well as by the MS4-spectrum of the ion at m/z 959 (1471 → 1215 → 959, Figure 2e), following losses of the two 16:0-fatty acid substituents. The former spectrum (Figure 2d) shows the ion-pair at m/z 877 ([a + 136] or [b + 136] ion) and 621 ([b + 136 - C15H31CO2H] or [a + 136 - C15H31CO2H] ion); while the latter spectrum (Figure 2e) is dominated by the ion at m/z 621 ([b + 136 - C15H31CO2H] or [a + 136 - C15H31CO2H] ion) (Scheme 2). In Figure 2d, the ions arising from loss of a glycerophosphatidic acid as the sodium salt are seen at m/z 775 ([a + 34] or [b + 34]) and 519 ([b + 34] − C15H31CO2H or [a + 34] − C15H31CO2H). The ion at m/z 959, arising from loss of the remaining 16:0-fatty acid substituent at sn-1 (or sn-1′) is also more abundant than the ion at m/z 933 arising from loss of the 18:1-fatty acid substituent at sn-2 (or sn-2′), consistent with the notion that loss of the fatty acid substituent at sn-1 (or sn-1′) is more facile than that at sn-2 (or sn-2′).
Scheme 2.
The fragmentation pathways proposed for the [M − 2H + 3Na − R(or 2)CO2H]+ ions, arising from primary loss of the R1(or 1′)CO2H substituent from the [M − 2H + 3Na]+ ions of CL.
Further dissociation of the m/z 877 ion (1471 → 877, Figure 2f) leads to the formation of the ions at m/z 621 and 599, arising from losses of 16:0-fatty acid substituent as an acid (loss of C15H31CO2H, 256 Da) and as a sodium salt (loss of C15H31CO2Na, 278 Da), respectively; while the ions at m/z 595 (877 – C17H33CO2H) and 573 (877 – C17H33CO2Na) correspond to the analogous losses of the 18:1-fatty acid substituent. The ions at m/z 621 (877 – C15H31CO2H), and 599 (877 – C15H31CO2Na) are, respectively, more abundant than the analogous ions at m/z 595 (877 – C17H33CO2H), and 573 (877 – C17H33CO2Na), indicating that the 16:0- and 18:1-fatty acyl substituents are located at sn-1 (or sn-1′) and sn-2 (or sn-2′) of the glycerol A (or B), respectively. The results, again, agree with the notion that loss of the fatty acid substituent at sn-1 is more favorable than that at sn-2, as described earlier. The structural assignment is also consistent with that deduced from the IT MS2- and MS3-spectra of the [M − 2H + Na]− ion at m/z 1425 [11], and of the [M − H]− ion at m/z 1403 [10].
In addition to the ions that arises from the (18:1/16:0)(18:1/16:0)-CL isomer, the spectrum (Figure 2a) also contains another (a + 136) and (b + 136) ion pair at m/z 891 and 863, indicating the presence of an additional (16:0/19:1)(16:0/17:1)-CL structure. Structural characterization of the cardiolipin molecules consisting of multiple isomeric structures will be described later.
The IT MS2 product-ion spectrum of the [M − 2H + 3Na]+ ion at 1471.9 from M. bovis BCG [10] with a isomeric structure of (18:1/16:0)(18:1/16:0)-CL also consists of a prominent ion at m/z 877 ([a + 136] + [b + 136] ions) along with the ion at m/z 1189 (1471 − 282), arising from loss of the 18:1-fatty acid substituent at sn-1 (Figure 3a). The MS3 product-ion spectra of the ions at m/z 1189 (1471 → 1189) (Figure 3b) and at m/z 877 (1471 → 877) (Figure 3c) contain ions analogous to those observed in Figure 2d and f, respectively, and clearly demonstrated that the 18:1- and 16:0-fatty acid substituents are located at sn-1 (or sn-1′) and sn-2 (or sn-2′), respectively.
Figure 3.
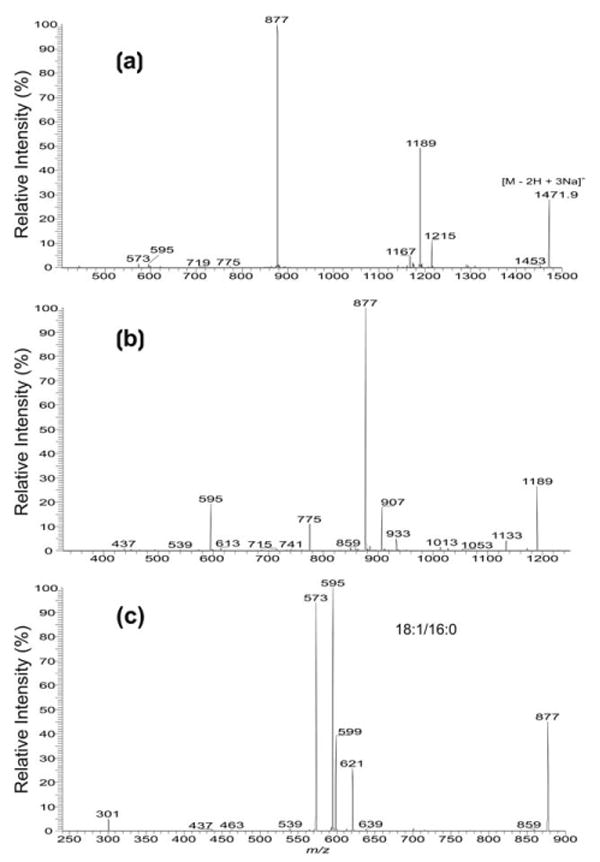
The IT MS2-spectra of (a) the [M − 2H + 3Na]+ ion at m/z 1471.9, and the IT MS3-spectra of (b) the m/z 1189 (1471 → 1189) and (c) the m/z 977 (1471 → 877) ions from the (18:1/16:0)(18:1/16:0)-CL isomer isolated from Mycobacterium bovis BCG. The spectra are in contrast with those observed in Figure 2 that arise from a (16:0/18:1)(16:0/18:1)-CL isomer.
Structural Characterization of Cardiolipin Molecules Consisting of Two Various Phosphatidyl Moieties
The formation of two distinct (a + 136) and (b + 136) ions by the cleavages of the C(3B)O–P and the C(3A)O–P bonds, respectively, is seen in the MS2-spectra of the [M − 2H + 3Na]+ ions of cardiolipins that consist of two various phosphatidyl moieties. As illustrated in Figure 4a, the product-ion spectrum from MS2 of the [M − 2H + 3Na]+ ion at m/z 1495.9 is dominated by the ion at m/z 903 (a + 136), which is more abundant than another prominent ion at m/z 875 (b + 136). The results are similar to those observed for the corresponding [M − 2H + Na]− ion at m/z 1449.9, which shows a higher abundance of the m/z 857 (a ion) ion than the m/z 829 (b ion) ion [11], and are consistent with the notion that CL contains two chemically distinct phosphatidyl moieties [2, 5, 16, 17] that may be liberated by the differential cleavage of the C(3A)O–P and C(3B)O–P bonds upon CAD. The finding that the (a + 136) ion is more abundant than the (b + 136) ion may indicate that the two ions correspond to the phosphatidyl moieties containing glycerol A and glycerol B, respectively [10, 11].
Figure 4.
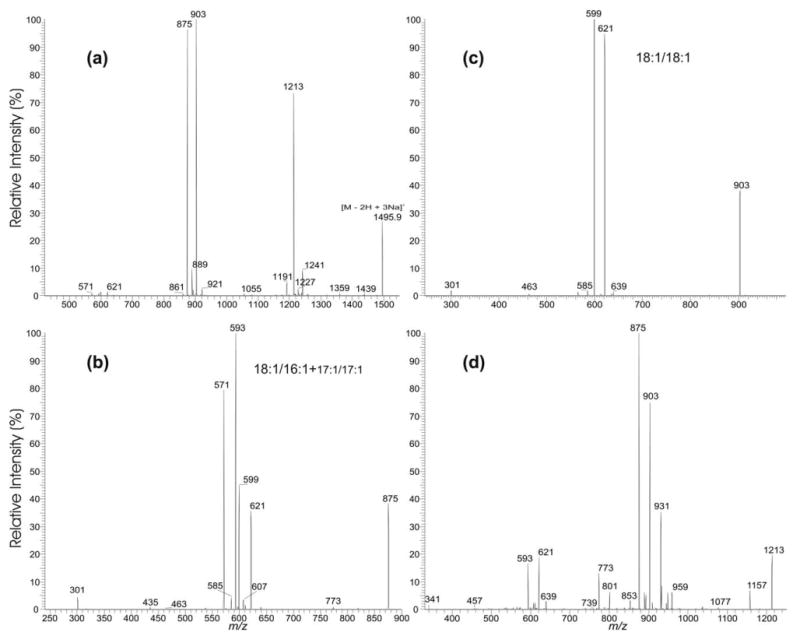
The IT MS2-spectrum of (a) the [M − 2H + 3Na]+ ion at m/z 1495.9, and the MS3-spectra of (b) the m/z 875 ion (1495 → 875), (c) of the m/z 903 (1495 → 903) ion, and (d) of the m/z 1213 ion (1495 → 1213). These spectra reveal a major (18:1/18:1)(18:1/16:1)-CL isomer and two minor (18:1/18:1)(17:1/17:1)-CL and (18:1/17:1)(18:1/17:1)-CL structures.
In the MS3-spectrum of the m/z 875 ion (1495 → 875) (Figure 4b), the m/z 593 (875 − C17H33CO2H) and 571 (875 − C17H33CO2Na) ions arising from further losses of the 18:1-fatty acyl substituent as an acid and as a sodium salt, respectively, are respectively more abundant than the ions at m/z 621 (875 − C15H29CO2H) and 599 (875 − C15H29CO2Na) arising from the analogous losses of the 16:1-fatty acyl substituent, suggesting that the 18:1- and 16:1-fatty acyl moieties reside at sn-1′ and sn-2′ of glycerol B, respectively. The MS3-spectrum of the m/z 903 ion (1495 → 903) (Figure 4c) is dominated by the ions at m/z 621 (903 − C17H33CO2H) and 599 (903 − C17H33CO2Na), arising from losses of the 18:1-fatty acyl substituent as an acid and as a sodium salt, respectively, indicating that the m/z 903 ion consists of a 18:1/18:1-structure. The above results demonstrate that the m/z 1495 ion is a (18:1/18:1)(18:1/16:1)-CL. This structural assignment is also consistent with the presence of a prominent ion at m/z 1213, arising from loss of the fatty acid substituent at sn-1 (or sn-1′); while the ion at m/z 1241 from loss of the 16:1-fatty acid at sn-2′ is of low abundance (Figure 4a). The structural assignment is also in agreement with the fact that the ion at m/z 931 (1213 − 282) arising from further loss of the 18:1-fatty acid substituent at sn-1 (or sn-1′) is more abundant than the ion at m/z 959 arising from further loss of the 16:1-fatty acid substituent at sn-2′ in the MS3 mass spectrum of the m/z 1213 ion (1495 → 1213) (Figure 4d). The observation of the abundant ion pairs of m/z 875/621 and 903/593 in Figure 4d is also consistent with the notion that the 18:1-fatty acid substituent at sn-1 (or sn-1′) was first cleaved from the ion at m/z 1495, followed by cleavages of the C(3B)O–P and the C(3A)O–P bonds, respectively. The IT MS4-spectrum of the m/z 931 ion (1495 → 1213 → 931) (data not shown) arising from consecutive losses of the 18:1-fatty acid substituents at sn-1 and sn-1′ is also dominated by ions at m/z 621 (903 − 282) and 593 (875 − 282), further supporting the pathways that cleave the C(3B)O–P and the C(3A)O–P bonds.
In Figure 4a, an ion at m/z 889, representing both a (b + 136) and a (a + 136) ions is also present. The MS3-spectrum of m/z 889 (1495 → 889) (shown later in Figure 5d) contains ions that are typical of an 18:1/17:1-structure. The results indicate that the m/z 1495 ion may also consist of a minor (18:1/17:1)(18:1/17:1)-CL structure. The MS3-spectrum of the m/z 875 ion (Figure 4b) contains two minor peaks at m/z 607 and 585, corresponding to losses of the 17:1-fatty acid substituent as an acid and as a sodium salt, respectively, in addition to the major ions arising from the 18:1/16:1-structure that has been identified. The presence of the ions at m/z 585 and 607 indicate that the m/z 875 ion may also consist of a minor 17:1/17:1-isomer and hence, the m/z 1495 ion may also consist of a minor (18:1/18:1)(17:1/17:1)-CL species. Indeed, a minor ion at m/z 1227 (1495 − 268), corresponding to loss of a 17:1-fatty acid substituent is also present in the MS2-spectrum of m/z 1495 (Figure 4a). The characterization of the cardiolipin species consisting of multiple isomeric structures is described below.
Figure 5.
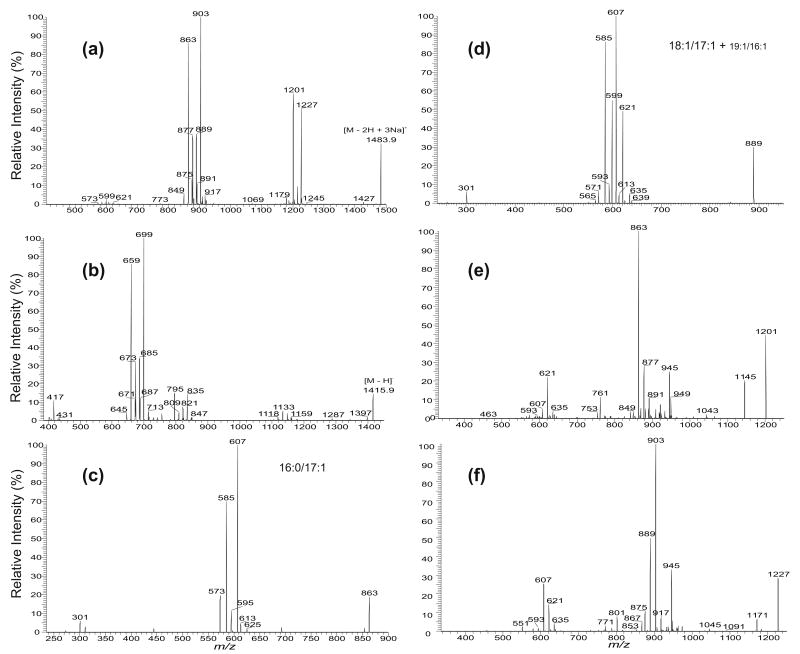
The IT MS2-spectra of (a) the [M − 2H + 3Na]+ ion at m/z 1483.9, (b) the [M − H]− ion at m/z 1415.9, and the IT MS3-spectra of the ions at m/z 863 (1483 → 863) (c), at m/z 889 (1483 → 889) (d), at m/z 1201 (1483 → 1201) (e), and at m/z 1227 (1483 → 1227) (f). These combined structural information identified the (18:1/18:1)(16:0/17:1)-CL, (18:1/17:1)(16:0/18:1)-CL, (18:1/16:1)(16:0/19:1)-CL, and (18:1/19:1)(16:0/16:1)-CL species. Because the m/z 889 ion also represent a minor 19:1/16:1 species (Figure 4d), a minor component with a (19:1/16:1)(16:0/18:1)-CL (or (16:0/18:1)(19:1/16:1)-CL) structure can also exist.
Characterization of Cardiolipin Molecules Consisting of Multiple Isomers
More than one isomeric structures were identified for all the CL molecular species isolated from E. coli [11]. The characterization of the complex structures is exemplified by revealing the m/z 1483.9 ion in the mixture. The MS2-spectrum (Figure 5a) contains two prominent ions at m/z 903 (a + 136) and 863 (b + 136) along with several sets of the ion pairs at m/z 889 (a + 136) and 877 (b + 136), at m/z 875 (a + 136) and 891 (b + 136), and at m/z 849 (a + 136) and 917 (b + 136), consistent with those derived from the [M − H]− ion at m/z 1415.9 (Figure 5b) and the [M − 2H + Na]− ion at m/z 1437.9 (data not shown) in the negative-ion mode. The MS3-spectrum of the m/z 903 ion (1483 → 903) is identical to that shown in Figure 4c, which represents an 18:1/18:1-structure. The MS3-spectrum of the m/z 863 ion (1483 → 863) (Figure 5c) represents a 16:0/17:1-structure, which is seen by a higher abundances of the ions at m/z 607 (863 − C15H31CO2H) and 585 (863 − C15H31CO2Na), arising from losses of the 16:0-fatty acid substituent as an acid and as a sodium salt, respectively, than the ions at m/z 595 (863 − C16H31CO2H) and 573 (863 − C16H31CO2Na), arising from the corresponding losses of the 17:1-fatty acid substituent. Therefore, a major species with a (18:1/18:1)(16:0/17:1)-CL structure can be assigned.
The MS3-spectrum of the m/z 877 ion in the m/z 889/877 ion pair is identical to that shown in Figure 2f, which represents a 16:0/18:1-structure; while the MS3-spectrum of the m/z 889 ion (1483 → 889) (Figure 5d) mainly consists of a 18:1/17:1-structure, which is identified by the observation of a greater abundance of the ions at m/z 607 (889 – C17H33CO2H) and 585 (889 – C17H33CO2Na) than the ions at m/z 621 (889 – C16H31CO2H) and 599 (889 – C16H31CO2Na). The spectrum also contains another two sets of minor ion pairs at m/z 593 (889 – C18H35CO2H) and 571 (889 – C18H35CO2Na) corresponding to the losses from the 19:1-fatty acid substituent and at m/z 635 (889 – C15H31CO2H) and 613 (889 – C15H31CO2Na), corresponding to the analogous losses of the 16:1-fatty acid substituent, indicating the presence of an additional 19:1/16:1-isomer. These results indicate that the 889/877 ion pair arises from a major (18:1/17:1)(16:0/18:1)-CL and a minor (19:1/16:1)(16:0/18:1)-CL. The MS3-spectra of the ions at m/z 875 (1483 → 875) (same as Figure 4b), 891 (1483 → 891) (not shown), 849 (1483 → 849) (not shown), and 917 (1483 → 917) (not shown) contain ions reflecting an 18:1/16:1-, 16:0/19:1-, 16:0/16:1-, and an 18:1/19:1-configurations, respectively. Because the m/z 875 ion is more abundant than the m/z 891 ion in the 875/891 set, the CL with a (18:1/16:1)(16:0/19:1)-CL structure can be assigned, while the 849/917 ion set may arise from a (16:0/16:1)(18:1/19:1)-CL structure.
The above structural assignments are further supported by the MS3-spectrum of the m/z 1201 ion (1483 → 1201) (Figure 5e), which contains a prominent ion at m/z 863, along with ions at m/z 877, 891, and 849. The presence of these ions is in agreement with the fact that the ion at m/z 1483 consists of a major (18:1/18:1)(16:0/17:1)-CL component along with the (18:1/17:1)(16:0/18:1)-CL, (18:1/16:1)(16:0/19:1)-CL, and (16:0/16:1)(18:1/19:1)-CL species. Upon CAD, ions from these species undergo preferential losses of the 18:1-fatty acid substituent at sn-1 (or sn-1′) to yield a variety of the ions at m/z 1201, which undergo further cleavages of the C(3A)O–P bonds to form a major ion at m/z 863 along with ions at m/z 877, 891, and 849 from the various isomers; while the ions at m/z 621, 607, 593, and 635 arise from cleavages of the C(3B)O–P bonds (Scheme 2). The MS3-spectrum of the m/z 1227 ion (1483 → 1227) (Figure 5f) also contains a prominent ion set at m/z 903/607, along with the ion pairs at m/z 889/621, 875/635, and 917/593, arising from consecutive cleavages of the C(3B)O–P and C(3B)O–P bonds, following primary losses of the 16:0-fatty acid substituents at sn-1′. The relative intensities of the aforementioned ions in Figures 5e and f are also in good agreement with those observed in Figure 5a, further supporting the fragmentation processes and the structural assignment for the m/z 1483 ion.
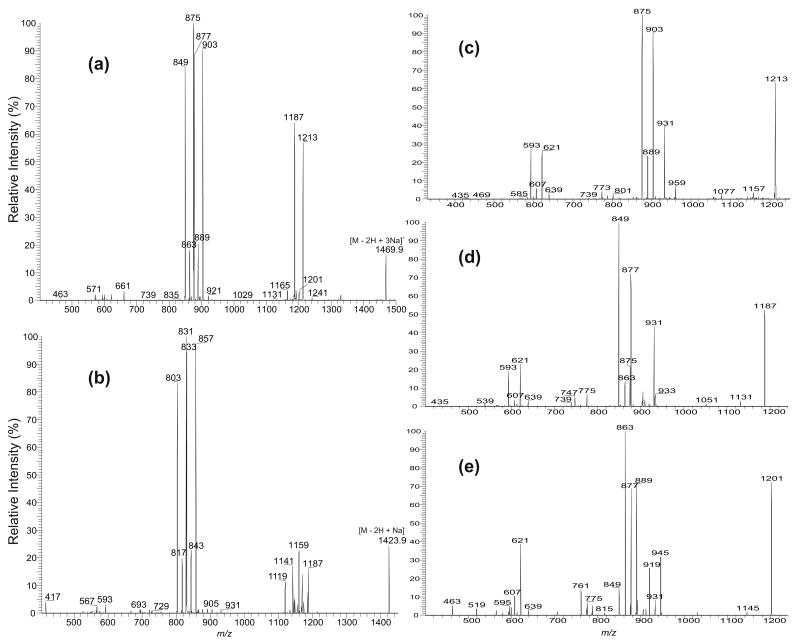
Another example that reveals the complex structures of CL is illustrated by the MS 2-spectrum of the m/z 1469 ion (Figure 6a), which contains three major sets of the (a + 136)/(b + 136) ion pairs at m/z 875/877, 903/849, and 889/863. The former ion is more abundant than the latter in each set and, thus, the position of the phosphatidyl group attached to 1′- or 3′-position of the central glycerol can be determined. The results are also in agreement with those observed for the [M − H]− ion at m/z 1401.9 (data not shown) and the [M − 2H + Na]− ion at m/z 1423.9 (Figure 6b) in the negative-ion mode. The MS3-spectra of the m/z 875, 877, 903, 849, 889, and m/z 863 ions are identical to those observed earlier and represent 18:1/16:1-, 16:0/18:1-, 18:1/18:1-, 16:0/16:1-, 18:1/17:1-, and 16:0/17:1-structures, respectively. These results indicate that the m/z 1469 ion is a mixture consisting of (18:1/16:1)(16:0/18:1)-CL, (18:1/18:1)(16:0/16:1)-CL, and (18:1/17:1)(16:0/17:1)-CL isomers. The presence of these isomeric structures is also consistent with the prominence of the ions at m/z 1187 (1469 − 282) and 1213 (1469 − 256), arising from losses of the 18:1- and 16:0-fatty acyl substituents at sn-1 and sn-1′, respectively, in the MS2 of m/z 1469.9 (Figure 6a). These structural assignments are further supported by the MS3-spectra of the ions at m/z 1213 (1469 → 1213) (Figure 6c) and at m/z 1187 (1469 → 1187) (Figure 6d). The former spectrum is dominated by the (a + 136)/(b + 136) ion pairs at m/z 903/593 and 875/621, arising from cleavages of the C(3B)O–P and C(3A)O–P bonds of the major (18:1/18:1)(16:0/16:1)-CL and (18:1/16:1)(16:0/18:1)-CL isomers, following primary loss of the 16:0-fatty acid substituent at sn-1′. The ion-pair arising from the similar cleavages of the minor (18:1/17:1)(16:0/17:1)-CL isomer, following loss of the 16:0-fatty acid substituent is seen at m/z 889/607. The MS3-spectrum of the m/z 1187 ion (Figure 6d) consists of the prominent ion pairs at m/z 849/621 and 877/593, along with a minor ion pair at m/z 863/607. These ions, again, arise from cleavages of the C(3B)O–P and C(3A)O–P bonds from the (18:1/18:1)(16:0/16:1)-CL, (18:1/16:1)(16:0/18:1)-CL, and (18:1/17:1)(16:0/17:1)-CL isomers, respectively, following primary loss of the 18:1-fatty acid substituent at sn-1.
Figure 6.
The IT MS2-spectra of (a) the [M − 2H + 3Na]+ ion at m/z 1469.9 and (b) the [M − 2H + Na]− ion at m/z 1423.9. The consecutive fragmentations are shown in the MS3-spectra of (c) the m/z 1213 ion (1469 →1213), (d) the m/z 1187 ion (1469 → 1187), and (e) of the m/z 1201 ion (1469 → 1201). The m/z 1469 ion (a) consists of two major (18:1/16:1)(16:0/18:1)-CL (from 875/877 pair) and (18:1/18:1)(16:0/16:1)-CL (from 903/849 pair) species, along with the minor (18:1/17:1)(16:0/17:1)-CL and (17:1/17:1) (16:0/18:1)-CL species (from 889/863 pair), consistent with those observed in (b), in which the analogous ion pairs are also seen. Only the major structure in each pair is shown. For example, the m/z 889 ion consists of a major 18:1/17:1- and minor 19:1/16:1-structures and the m/z 849 ion consists of a major 16:0/16:1- and a minor 14:0/18:1-structures, but only the (18:1/17:1)(16:0/17:1)-CL and (18:1/18:1)(16:0/16:1)-CL structures are described.
As shown earlier (Figure 4b), the ion at m/z 875 represents both a 18:1/16:1 and a 17:1/17:1 isomers. Therefore, the ion-pair at m/z 875/877 may also arise from a minor (17:1/17:1)(16:0/18:1)-CL (or a (16:0/18:1) (17:1/17:1)-CL) species. Indeed, both the ions at m/z 877 and 607, arising from further cleavages of the C(3B)O–P and C(3A)O–P bonds are also present in the MS3-spectrum of the minor ion at m/z 1201 (1469 → 1201) (Figure 6e), arising from primary loss of a 17:1-fatty acid substituent. The spectrum also contains the ion-pairs at m/z 863/621, 889/595, arising from further cleavages of the C(3B)O–P and C(3A)O–P bonds, following primary loss of the 17:1-fatty acid substituent at sn-2 from the (18:1/17:1)(16:0/17:1)-CL isomer. The ions at m/z 945 and 919, arising from losses of the 16:0- and 18:1-fatty acid substituents, respectively, are abundant; while the ion at m/z 931, arising from further loss of a 17:1-fatty acid substituent is of low abundance. These results agree with the earlier findings that the ion at m/z 1201 also arises from a (18:1/17:1)(16:0/17:1)-CL isomer by loss of the 17:1-fatty acid substituent at sn-2 (or sn-2′).
Characterization of Cardiolipin as the [M + Na]+ and [M − H + 2Na]+ Ions
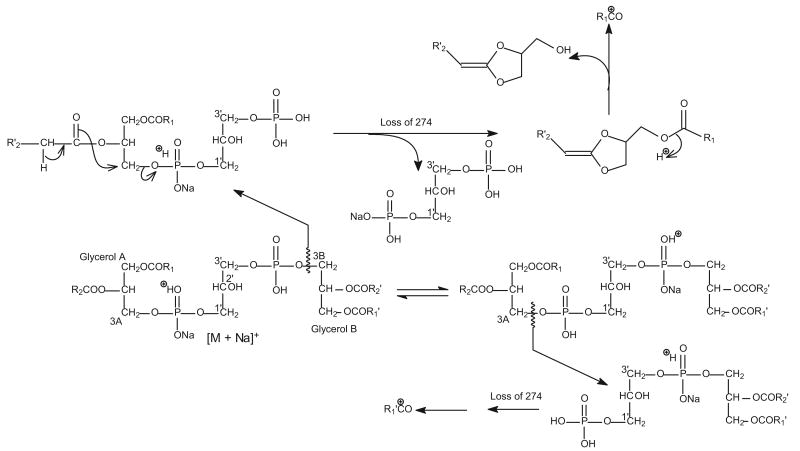
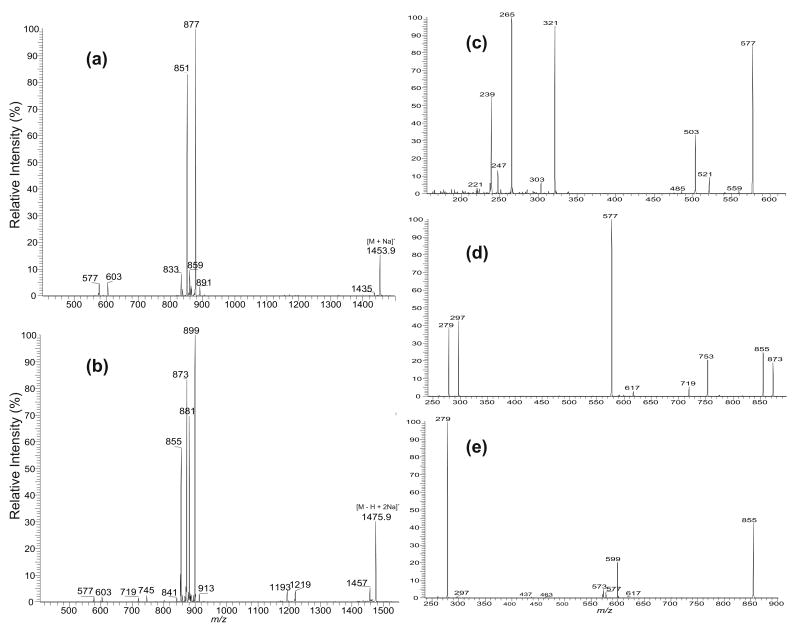
Interestingly, the major fragmentation processes for the [M + Na]+ and [M − H + 2Na]+ ions upon CAD arise from cleavages of the C(3B)–OP and C(3A)–OP bonds rather than the C(3B)O–P and C(3A)O–P bonds (Scheme 3), probably due to the presence of the acidic hydrogen that protonates the molecule of CL. The ion pairs arising from the cleavages are seen at m/z 877 and 851, for the [M + Na]+ ion of (18:1/18:1)(16:0/18:1)-CL at m/z 1453.9 (Figure 7a), which also yields the ions at m/z 859 (877 − H2O) and 833 (851 − H2O) via further loss of a water molecule. The analogous ions from the similar cleavages were observed at m/z 899, 873, 881 (889 − H2O), and 855 (873 − H2O) for the [M − H + 2Na]+ adduct ion of (18:1/18:1)(16:0/18:1)-CL at m/z 1475.9 (Figure 7b). Again, the abundances of the former ions in each pair are greater than those of the latter ions, respectively, indicating that the former ions correspond to the phosphatidyl moieties containing glycerol A and the latter ions correspond to the phosphatidylglycerol moieties that contain glycerol B. The results are consistent with those observed for the [M − H]− and [M − 2H + Na]− ions [10, 11]. The assignments of the fatty acid substituents at the glycerol backbone are determined by further dissociation of the ion pairs.
Scheme 3.
The fragmentation pathways proposed for the [M + Na]+ ion of CL. Similar pathways were also observed for the [M − H + 2Na]+ ion.
Figure 7.
The IT MS2-spectra of (a) the [M + Na]+ ion at m/z 1453.9 and (b) of the [M − H + 2Na]+ ion at m/z 1475.9. (c) The MS4-spectra of the m/z 577 ion (1453 → 851 → 577). (d) The MS3-spectra of the m/z 873 ion (1475 → 873), and (e) of the m/z 855 ion (1475 → 855). The combined spectral information indicates that ions at m/z 1453 and 1475 arise from (18:1/18:1)(16:0/18:1)-CL; while (c), (d), and (e) arise from a 16:0/18:1-structure.
The MS3-spectrum of the m/z 851 ion (data not shown) is dominated by the ion at m/z 577, reflecting loss of a sodium glycerol-1,3-diphosphate moiety (Scheme 3), and the spectrum is not sufficient for structural identification. However, further dissociation of the ion at m/z 577 (1453 → 851 → 577) (Figure 7c) gives the ion at m/z 321, reflecting loss of the 16:0-fatty acid substituent at sn-1. In contrast, the ion expected at m/z 295 arising from loss of the 18:1-fatty acid substituent at sn-2 is absent. The spectrum also contains a prominent ion at m/z 265, corresponding to a 18:1-fatty acyl cation, which is more abundant than the ion at m/z 239, corresponding to a 16:0-fatty acyl cation. The results indicate that the 16:0- and 18:1-fatty acyl substituents are located at sn-1 and sn-2, respectively [13]; whereas the analogous ion at m/z 603 arising from further dissociation of the ion at m/z 877 is composed of a 18:1/18:1-structure (data not shown). Therefore, a (18:1/18:1)(16:0/18:1)-CL structure can be assigned.
The MS3-spectra of the ions at m/z 873 (1475 → 873) (Figure 7d) and at m/z 899 (data not shown) are also dominated by the ions at m/z 577 and 603, respectively, and the spectra also do not provide the information regarding to the identities and the positions of the fatty acid substituents. However, further degradation of the ions at m/z 577 and 601 gives the identical spectra as described earlier (Figure 7c), consistent with the presence of a (18:1/18:1)(16:0/18:1)-CL. The MS3-spectrum of the ion at m/z 855 (1475 → 855) contains the ion at m/z 599, arising from loss of a 16:0-fatty acid substituent. The ion is more abundant than the ion at m/z 573, corresponding to loss of a 18:1-fatty acid substituent, indicating that the m/z 855 ion contains a 16:0/18:1- structure; while the MS3-spectrum of the ion at m/z 881 leads to the assignment of a 18:1/18:1-structure. The combined information confirms that the [M − H + 2Na]+ ion at m/z 1475 is a (18:1/18:1)(16:0/18:1)-CL, identical to that deduced from the [M + Na]+ ion at m/z 1453.
Conclusions
The structural assignments of CL and its fragmentation processes from the [M − 2H + 3Na]+ ions are consistent with those derived from the [M − 2H + Na]− and [M − H]− ions [10, 11]. The feature that the ions reflecting the losses of the fatty acid substituents at sn-1 and sn-1′ {i.e., the ([M − 2H + 3Na]+- R1CO2H) and the ([M − 2H + 3Na]+- R1′CO2H) ions} are prominent as seen in the MS2-spectra, as well as the structural information deduced from the MS3-spectra of the (a + 136) ion and the (b + 136) ions, along with those obtained from the MS3-spectra of the ([M − 2H + 3Na]+- R1CO2H) and the ([M − 2H + 3Na]+- R1′CO2H) ions readily permit confident assignments of complex CL structures. Because the [M − 2H + 3Na]+ ions of CL is readily formed from its methanolic solution of the disodium salts upon desorption by ESI, characterization of CL as a [M − 2H + 3Na]+ adduct ion in the positive-ion mode may be an alternative for its structural identification.
Although the IT multiple-stage mass spectrometric approaches for structural characterization using the [M + Na]+ and the [M − H + 2Na]+ ions of CL can be achieved, the formation of the mono- and the disodiated CL species, nevertheless, is not predictable. In addition, fragment ions informative for assignments of the fatty acid substituents relied on the spectra from MS4 experiments that result in a drastic decline in sensitivity. Hence, the approaches for structural characterization are not very useful.
Acknowledgments
This research was supported by U.S. Public Health Service grants P41-RR-00,954, R37-DK-34,388, P60-DK-20,579, P01-HL-57,278, P30-DK-56,341, and a grant (996003) from the Juvenile Diabetes Foundation.
References
- 1.LeCocq J, Ballou CE. On the Structure of Cardiolipin. Biochemistry. 1964;155:976–980. doi: 10.1021/bi00895a023. [DOI] [PubMed] [Google Scholar]
- 2.Powell GL, Jacobus J. The Nonequivalence of the Phosphorus Atoms in Cardiolipin. Biochemistry. 1974;13:4024–4026. doi: 10.1021/bi00716a032. [DOI] [PubMed] [Google Scholar]
- 3.Schlame M, Brody S, Hostetler KY. Mitochondrial Cardiolipin in Diverse Eukaryotes. Comparison of Biosynthetic Reactions and Molecular Acyl Species. Eur J Biochem. 1993;212:727–735. doi: 10.1111/j.1432-1033.1993.tb17711.x. [DOI] [PubMed] [Google Scholar]
- 4.Schlame M, Otten D. Analysis of Cardiolipin Molecular Species by High-Performance Liquid Chromatography of Its Derivative 1,3- Bisphosphatidyl-2-Benzoyl-sn-Glycerol Dimethyl Ester. Anal Biochem. 1991;195:290–295. doi: 10.1016/0003-2697(91)90332-n. [DOI] [PubMed] [Google Scholar]
- 5.Schlame M, Ren M, Xu Y, Greenberg ML, Haller I. Molecular Symmetry in Mitochondrial Cardiolipins. Chem Phys Lipids. 2005;138:38–49. doi: 10.1016/j.chemphyslip.2005.08.002. [DOI] [PubMed] [Google Scholar]
- 6.Valianpour F, Wanders RJA, Barth PG, Overmars H, van Gennip AH. Quantitative and Compositional Study of Cardiolipin in Platelets by Electrospray Ionization Mass Spectrometry: Application for the Identification of Barth Syndrome Patients. Clin Chem. 2002;48:1390–1397. [PubMed] [Google Scholar]
- 7.Beckedorf AI, Schaffer C, Messner P, Peter-Katalinic J. Mapping and Sequencing of Cardiolipins from Geobacillus stearothermophilus NRS 2004/3a by Positive and Negative Ion Nano-ESI-QTOF-MS and MS/MS. J Mass Spectrom. 2002;37:1086–1094. doi: 10.1002/jms.369. [DOI] [PubMed] [Google Scholar]
- 8.Lesnefsky ES, Stoll MSK, Minkler PE, Hoppel CL. Separation and Quantitation of Phospholipids and Lysophospholipids by High- Performance Liquid Chromatography. Anal Biochem. 2000;285:246–254. doi: 10.1006/abio.2000.4783. [DOI] [PubMed] [Google Scholar]
- 9.Peter-Katalinic J, Fischer W. α-D-Glucopyranosyl-, D-Alanyl-, and L-Lysylcardiolipin from Gram-Positive Bacteria: Analysis by Fast Bombardment Mass Spectrometry. J Lipid Res. 1998;39:2286–2292. [PubMed] [Google Scholar]
- 10.Hsu FF, Turk J, Rhoades ER, Russell DG, Shi Y, Groisman EA. Structural Characterization of Cardiolipin by Tandem Quadrupole and Multiple-Stage Quadrupole Ion-Trap Mass Spectrometry with Electrospray Ionization. J Am Soc Mass Spectrom. 2005;16:491–504. doi: 10.1016/j.jasms.2004.12.015. [DOI] [PubMed] [Google Scholar]
- 11.Hsu FF, Turk J. Structural Characterization of Cardiolipin from Escherichia coli by Electrospray Ionization with Multiple Stage Quadrupole Ion-Trap Mass Spectrometric Analysis of [M − 2H + Na]− Ions. J Am Soc Mass Spectrom. 2006;17:420–429. doi: 10.1016/j.jasms.2005.11.019. [DOI] [PMC free article] [PubMed] [Google Scholar]
- 12.Hsu FF, Turk J. Electrospray Ionization/Tandem Quadrupole Mass Spectrometric Studies on Phosphatidylcholines: The Fragmentation Processes. J Am Soc Mass Spectrom. 2003;14:352–363. doi: 10.1016/S1044-0305(03)00064-3. [DOI] [PubMed] [Google Scholar]
- 13.Hsu FF, Turk J. Structural Studies on Phosphatidylserine by Tandem Quadrupole and Multiple Stage Quadrupole Ion-Trap Mass Spectrometry with Electrospray Ionization. J Am Soc Mass Spectrom. 2005;16:1510–1522. doi: 10.1016/j.jasms.2005.04.018. [DOI] [PubMed] [Google Scholar]
- 14.Hsu FF, Turk J. Structural Characterization of Triacylglycerols as Lithiated Adducts by Electrospray Ionization Mass Spectrometry Using Low-Energy Collisionally Activated Dissociation on a Triple Stage Quadrupole Instrument. J Am Soc Mass Spectrom. 1999;10:587–99. doi: 10.1016/S1044-0305(99)00035-5. [DOI] [PubMed] [Google Scholar]
- 15.Hsu FF, Turk J. Electrospray Ionization with Low-Energy Collisionally Activated Dissociation Tandem Mass Spectrometry of Complex Lipids: Structural Characterization and Mechanisms of Fragmentation. In: Byrdwell WC, editor. Modern Methods for Lipid Analysis by Liquid Chromatography/Mass Spectrometry. AOCS Publication; Champaign, IL: 2005. pp. 61–178. [Google Scholar]
- 16.Henderson TO, Glonek T, Myers TC. Phosphorus-31 Nuclear Magnetic Resonance Spectroscopy of Phospholipids. Biochemistry. 13:1974. 623–628. doi: 10.1021/bi00700a034. [DOI] [PubMed] [Google Scholar]
- 17.Kates M, Syz JY, Gosser D, Haines TH. pH-Dissociation Characteristics of Cardiolipin and Its 2′-Deoxy Analog. Lipids. 1993;28:877–882. doi: 10.1007/BF02537494. [DOI] [PubMed] [Google Scholar]


