

Abstract
Intracellular transport of membrane organelles occurs along microtubules (MTs) and actin filaments (AFs). Although transport along each type of the cytoskeletal tracks is well characterized, the switching between the two types of transport is poorly understood because it cannot be observed directly in living cells. To gain insight into the regulation of the switching of membrane organelles between the two major transport systems, we developed a novel approach that combines live cell imaging with computational modeling. Using this approach, we measured the parameters that determine how fast membrane organelles switch back and forth between MTs and AFs (the switching rate constants) and compared these parameters during different signaling states. We show that regulation involves a major change in a single parameter: the transferring rate from AFs onto MTs. This result suggests that MT transport is the defining factor whose regulation determines the choice of the cytoskeletal tracks during the transport of membrane organelles.
Introduction
Intracellular transport of membrane organelles is critical for various processes such as endocytosis (Caviston and Holzbaur, 2006; Soldati and Schliwa, 2006), secretion (Caviston and Holzbaur, 2006), neuronal signaling (Guzik and Goldstein, 2004), and organization of endomembranes (Lane and Allan, 1998). The driving force for intracellular transport is provided by organelle-bound molecular motors, which move cargo organelles along microtubules (MTs; motors of kinesin and dynein families) or actin filaments (AFs; myosin family motors; Vale, 2003). Experimental evidence suggests that MTs and AFs play distinct transport roles (Atkinson et al., 1992; Langford, 1995). MTs generally serve as tracks for long-range transport, whereas AFs support the local movement of organelles (Atkinson et al., 1992; Langford, 1995).
It has been shown that membrane organelles use both types of cytoskeletal tracks for transport. In a pioneering study, Kuznetsov et al. (1992) showed that membrane organelles in the cytoplasm extruded from squid axon could switch from moving along an MT to moving along an AF. Later studies demonstrated that mitochondria (Morris and Hollenbeck, 1995), synaptic vesicles (Bridgman, 1999), and pigment granules (Rodionov et al., 1998; Rogers and Gelfand, 1998) use both AFs and MTs for various aspects of transport. Although multiple approaches have been developed to study the regulation of transport along individual cytoskeletal tracks (MTs or AFs), the question of how the switching between the two major transport systems is regulated remains unknown. Unlike organelle movement along individual tracks, these events are impossible to reliably detect on the light microscopy level because of the high densities of MTs and AFs in the cytoplasm.
A classic model system for studies of the transport of membrane organelles along the two types of cytoskeletal tracks is melanophores, pigment cells whose major function is the redistribution of membrane-bounded pigment granules to ensure color changes in the animal (Nascimento et al., 2003). Pigment granules are induced by intracellular signals to either aggregate at the cell center or redisperse uniformly throughout the cytoplasm. During these movements, pigment granules use both MT and AF tracks. It is believed that pigment aggregation occurs predominantly along MTs, whereas pigment dispersion involves a combination of MT- and AF-based transport, suggesting that the switching between the two types of cytoskeletal tracks has to be tightly regulated by signaling events. Because these types of movement occur uniformly in response to cell-wide stimuli, observation of pigment movements in these cells allows us to distinguish the contribution of each type of cytoskeletal tracks and to develop computational approaches to detect the events of switching between the two types of transport.
In this study, we used melanophores as a model system to develop a new approach to directly measure switching between AF- and MT-based transport using a combination of experimental measurements and computational modeling. This approach allowed us, for the first time, to measure the parameters that determine how fast pigment granules switch back and forth between the MTs and AFs (the transferring rate constants) and to determine how intracellular signals modify these parameters to control the predomination of one cytoskeletal transport system over the other.
Results and discussion
To measure switching rate constants between two types of cytoskeletal tracks, we developed a two-step computational approach for modeling pigment transport in melanophores. As the first step, we used experimental particle-tracking measurements of pigment granule movement separately along MTs and AFs in response to pigment aggregation and dispersion signals. For the modeling of MT-based transport, we measured pigment granule trajectories in the presence of dispersion and aggregation stimuli and calculated granule displacement along the cell radius by projecting the granule tracks onto the radial lines drawn from the cell center to the periphery. Measurements were performed in cells with intact AFs or with AFs disrupted with latrunculin (Rodionov et al., 1998). The radial displacements of individual granules in intact or latrunculin-treated cells were classified as three discrete states: movement to the MT plus end (to the cell periphery), to the MT minus end (to the cell center), or pause (Fig. 1, P +, P −, and P 0). This classification allowed us to develop the computational model of movement along the MTs during pigment aggregation and dispersion and to calculate the transition rate constants between the three granule states (defined as k 1 –k 6; Fig. 1 B). These constants define how many granules transfer from one state into another over a unit of time (1 s; see Materials and methods for a description of calculation methods). For the modeling of AF-based transport, we measured pigment granule trajectories in the presence of dispersion and aggregation stimuli in cells treated with nocodazole to disrupt MTs. Granule displacement was calculated as the linear displacement from the starting to the ending point of each granule trajectory. For modeling purposes, we assumed that AF-dependent transport could be quantitatively described as two-dimensional diffusion. The major parameters used for modeling of MT- and AF-based transport of pigment granules are summarized in Table S1 (available at http://www.jcb.org/cgi/content/full/jcb.200705146/DC1).
Figure 1.

Computational model for pigment transport. (A) Schematic representation of pigment granule movement used for the computational model; at any given moment of time, a pigment granule can move along an MT (radial lines; the MT-bound states are designated P +, P −, and P 0) or an AF (not depicted; the AF-bound state is designated P AF). The MT-based movement involves displacement to the plus end (P +), to the minus end (P −), or a pause (P 0). (B) Schematic representation of the switching events used for the computational model; pigment granules transfer between the MT-bound states with the switching rate constants k 1 –k 6 and between MTs and AFs with the switching rate constants k MA and k AM.
As the second step of modeling, we combined the computational models of the aforementioned individual MT and AF movements. The resulting combined model assumed that pigment granules can switch back and forth between the two cytoskeletal track types and allowed us to determine the switching rate constants between MTs and AFs (Fig. 1 B, k MA and k AM), which define how fast pigment granules transfer from MTs onto AFs and from AFs onto MTs. To determine these values, we compared experimentally obtained changes of pigment levels over time in five different points equidistant along the cell radius (shown as dots of different colors in Fig. 2 A) with the models of pigment redistribution at similar points of the virtual melanophore using different k MA and k AM values. The values for k MA and k AM in computational simulations were systematically changed (see Materials and methods) to fit the reference plots obtained in the experiment (Fig. 2 B). This data-fitting analysis established the ranges of k MA and k AM values for pigment aggregation and dispersion, which reproduced the redistribution of pigment density observed in an experiment. The values for k MA and k AM were found to be in the range of 5–7 min−1 and 0–0.005 min−1 for dispersion and 3–5 min−1 and 8.5–12 min−1 for aggregation, respectively. The computational results shown in Fig. 2 C that were the closest match to the experimental data were obtained using the k MA and k AM values during dispersion and aggregation: k MA (disp) = 6.5 min−1, k AM (disp) = 0.0025 min−1, k MA (aggr) = 4.5 min−1, and k AM (aggr) = 10.7 min−1. As seen in Fig. 2, the curves representing the dynamics of pigment redistribution in experiments (Fig. 2 B) and simulations (Fig. 2 C) closely match each other.
Figure 2.

Measurement of the switching rate constants kMA and kAM. (A) Phase-contrast images of pigment dispersion in a melanophore, with the five points along the cell radius used for the measurements of pigment density marked as dots of different colors. (B) Changes in pigment levels during dispersion (left) or aggregation (right) measured in the selected points along the cell radius; the color of each curve matches the color of the point shown in A. (C) Computed changes in pigment levels over time in a simulated melanophore at the points along the cell radius similar to those shown in A. Computational data were generated to fit the results of experimental measurements shown in B by systematically changing the values for k MA and k AM. Left, pigment dispersion; right, pigment aggregation. Error bars represent SD.
Comparison of the switching rate constants during aggregation and dispersion reveals several remarkable aspects of regulation of the switching between organelle transport along the two types of cytoskeletal tracks. First, the k MA value that reflects the switching from MTs to AFs is similar during pigment aggregation and dispersion, suggesting that this type of switching is not affected by the pigment aggregation and dispersion stimuli. Second, although the values of the three switching rate constants are similar to each other, the value of one constant, k AM (disp), is extremely low, suggesting that during dispersion, the transfer of pigment granules from AFs to MTs is negligible, and, thus, the transfer onto AFs is essentially irreversible. Finally, the value for k AM undergoes a dramatic (∼10,000 fold) increase during aggregation, suggesting that the transfer from AFs onto the MTs is the major regulating factor that determines which cytoskeletal track will be used by each organelle for motility. Therefore, we conclude that transferring of pigment granules between MTs and AFs is regulated through a change in a single parameter, the rate for transfer onto MTs (Fig. 3).
Figure 3.
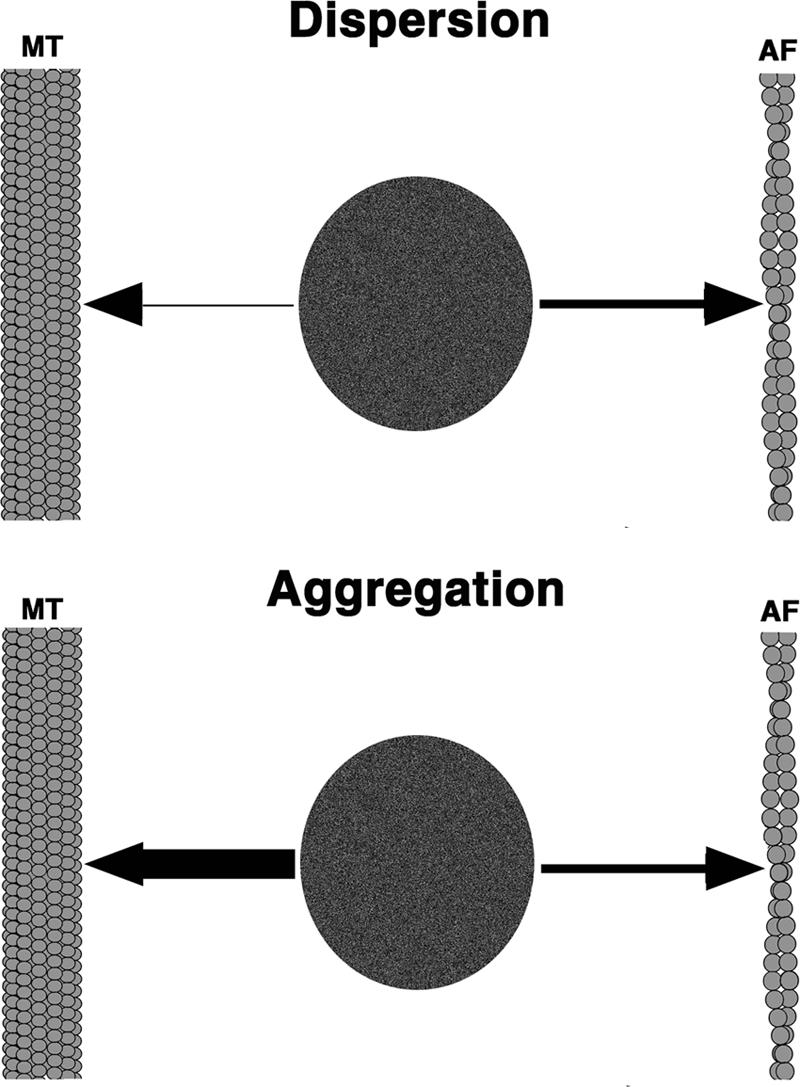
A model for regulation of the transferring of pigment granules between MTs and AFs. During dispersion (top), the rate of transferring onto MTs is insignificant, and, therefore, pigment granules preferentially move along AFs. During aggregation (bottom), transferring onto AFs continues with the rate similar to that during dispersion, but an increase in the rate of transferring onto MTs determines the predomination of the MT transport system.
We hypothesize that such an overwhelming increase or decrease in the transferring onto MTs is achieved by the cooperation of two independent mechanisms. The first mechanism involves control over the activities of pigment granule–bound molecular motors (Gross et al., 2002), which move pigment granules along MTs (plus end–directed kinesin; Rodionov et al., 1991; Tuma et al., 1998) and minus end–directed dynein (Nilsson and Wallin, 1997) or AFs (myosin V; Rogers and Gelfand, 1998). An increase in the activity of each motor type should drag pigment granules onto a specific cytoskeletal track and, therefore, lead to an increase of a corresponding switching rate constant. Because our data show that pigment granules transfer onto AFs with similar rates during aggregation and dispersion, we suggest that myosin V activity does not play a substantial role in the transferring regulation. We further suggest that a primary role in this process is played by the regulation of cytoplasmic dynein, whose activity sharply increases during aggregation and decreases during dispersion (Rodionov et al., 2003) and, therefore, correlates with the MT switching rate constant changes.
The second hypothetical mechanism implicates regulation of the properties of the cytoskeletal tracks. For the pigment aggregation to happen, pigment granules that move along AFs must be captured by MTs to begin the centripetal movement. Because pigment aggregation involves a striking increase in the switching onto MTs, it is possible that the properties of MT tracks themselves are changed to enhance their ability to bind pigment granules. These changes may involve changes in the MT dynamics, an increase in the MT density, or both. Another possibility involves regulation of the binding to MTs of the dynactin subunit p150Glued, whose presence at the growing (plus) ends of MTs has been shown to play an important role in the interaction of MTs with membrane organelles such as pigment granules (Vaughan et al., 2002). Multiple changes in the MT tracks may be combined to enhance the capturing of pigment granules.
The results of our study have global implications in the regulation of a wide variety of intracellular transport events that involve switching between MTs and AFs, including secretion, endocytosis, axonal transport, and positioning of membrane organelles in the cytoplasm (Lane and Allan, 1998; Hollenbeck and Saxton, 2005; Caviston and Holzbaur, 2006; Soldati and Schliwa, 2006). This suggests that during these transport events, regulation of switching onto MTs may also play a critical part in determining the type of cytoskeletal track that will be used by each particular organelle. Although at present it is impossible to directly observe these events in living cells, future development of live cell imaging and improved resolution of in vivo microscopy will enable the detailed studies that will shed light on this important problem.
Materials and methods
Experimental procedures
Fish melanophores were cultured from the scales of Black tetra (Gymnocorymbus ternetzi) onto carbon-coated glass coverslips as described previously (Rodionov et al., 1994). Pigment aggregation was induced with 5 × 10⁻⁷ M adrenalin. Pigment dispersion was induced by washing out adrenalin via five to six changes of fish tissue culture medium. In some experiments, 5 mM caffeine was introduced into the last washing solution to facilitate dispersion.
The movement of individual pigment granules was recorded using an inverted microscope (TE300; Nikon) equipped with a 100× NA 1.25 plan Achromat objective lens. During the recording, cells were kept in serum-free L15 cell culture medium at 24°C. Time series (15 s long) of phase-contrast images of pigment granules were acquired at a video rate (30 frames/s) with a CCD video camera (902B;Watec Corp.) via the stream acquisition option of MetaMorph image acquisition and analysis software (MDS Analytical Technologies). To increase the spatial resolution of images, an additional projection lens (2×) was placed in front of the camera chip. Pigment granules were tracked with the particle-tracking module of MetaMorph software. Tracking was performed at the edge of expanding (dispersion) or retracting (aggregation) pigment mass, where individual granules could be observed. To avoid artifacts introduced by the interaction of pigment granules with each other, only trajectories of granules that never collided with their neighbors were used for the analysis.
MT- and AF-dependent components of the motion were examined in separate sets of experiments. To examine the MT component, we tracked pigment granules in cells lacking AFs, which were obtained by treatment with the actin-disrupting drug latrunculin (Rodionov et al., 1998), or we obtained MT-based movement parameters by tracking pigment granules in intact AF-containing cells by fitting a granule movement trajectory by a straight line to determine the MT axis (Zaliapin et al., 2005). Movement of a pigment granule along the MT axis was then analyzed by breaking the displacement into periods of uninterrupted runs to the MT minus end (to the cell center), to the plus end (to the cell periphery), and pauses using multiscale trend analysis algorithm, which was previously described (Zaliapin et al., 2005). The AF-dependent component of the motion was examined by measuring the distance between the initial and the final position on the pigment granule trajectory in cells with disrupted MTs (Rodionov et al., 2003).
Changes in pigment levels over time were quantified from time sequences of bright-field images of melanophores stimulated to aggregate or redisperse pigment granules by measuring gray levels at five points distributed along the cell radius. Points were chosen by dividing the distance between the margin of the pigment aggregate and the cell margin into five equal intervals. Changes in pigment densities over time were calculated from percentages of gray levels between 0 (pigment level at the cell periphery in the dispersed state) and 1 (pigment level at the cell periphery in the aggregated state) averaged over 10 cells (Fig. 2 B).
Computational model for pigment transport in melanophores
General description.
The model is formulated in a continuous approximation in terms of a two-dimensional pigment density, P(r, t) (here and below, bold font is used to indicate vector quantities). If normalized to unity,
 |
it can also be regarded as a probability density function that determines the probability, P(r, t)d 2 r, to find a granule at location r at time t. This full granule density, which was compared with the experimental data, is the sum of densities of granules bound to MTs and AFs: P(r, t) = P MT(r, t) + P AF(r, t). P MT(r, t), in turn, consists of densities of states with a plus or minus MT motor activity or pauses: P MT(r, t) = P +(r, t) + P −(r, t) + P 0(r, t).
Overall pigment dynamics is governed by granule transport along MTs and AFs and, therefore, by the dynamics of individual states. The corresponding governing equations can be derived from granule mass conservation (Nedelec et al., 2001; Smith and Simmons, 2001) or as a probability master equation (Gardiner, 2004). The formulation is based on assumptions outlined in the following paragraphs.
Dilute solution approximation.
In the model, the granules do not interact with one another. Obviously, this can be true only for the lamella and does not apply to the cell body, where the granule density is high at the beginning of dispersion or at the end of aggregation. Therefore, the model is solved only for the two-dimensional part of the cell. In the idealized cell geometry of Fig. S2 A (available at http://www.jcb.org/cgi/content/full/jcb.200705146/DC1), the domain for which the equations were solved is represented by the annulus delimited by two concentric circumferences. The inner circumference delineates the high-density region in a cell body of the size of the pigment aggregate, whereas the outer circumference outlines the cell contour.
Markov approximation.
According to this approximation (Gardiner, 2004), the rates of transitions between the states of a granule depend entirely on its most recent condition (the granule does not have a memory of its history). Therefore, the transition rate is a product of the corresponding rate constant (see the diagram in Fig. 1) and the density of the state from which the transition occurs. The rate constants k 1, k 2, k 3, k 4, k 5, and k 6 describe transitions between the MT-bound states, whereas k MA and k AM are the rate constants at which granules switch between MTs and AFs.
MT organization.
MTs form an ideal radial array. The transport along MTs is therefore described by advective flows with the radially symmetric velocities v + = v + r 0 and v − = −v − r 0, where v + and v − are the velocities of plus end and minus end runs, respectively, and r 0 = r/|r| is the unit vector. It is also important to take into account the distribution of MT ends, n(r), with r ε [a, R] (see notation in Fig. S2 A). This distribution is important for the correct description of the local MT density and therefore determines how the rate constant, k AM (r), varies in space. In the conditions of aggregation, the function rn(r) can be well approximated by n(r)r = A(l + α exp(−(R − r)/λ)), with α = 5.35 and λ = 10.5 μm (Vorobjev et al., 1999). The normalization factor, A, is determined by the total number of MTs, N, in the lamella:
 |
Then, the local MT density is
 |
where N 0 is the number of MTs that reach the cell periphery, and the spatial dependence of the rate constant k AM (r) is given by
 |
(1) |
where φ(x) = R −x + αλ(1 − exp(−(R − x)/λ) and γ = N 0/N is the fraction of MTs that reach the cell periphery. The distribution of MT ends may also contribute to the transition of granules from MT to AF (see next paragraph).
MT→AF transitions.
In line with the experimental findings (Rodionov et al., 2003), switching from MTs to AFs is assumed to occur from the minus-run state, and reverse transition brings the granule back to this state. The latter assumption is not essential because of the separation of time scales, which is discussed in the next section. In addition to these transitions, we assume that the granules in P + states, which fall off the MT ends, also switch to AF. The corresponding rate is k MTends P + with the rate constant k MTends, a function of r:
 |
where φ(x) is defined above.
Transport along AF.
Given randomness in filament directionality and frequent switching from one filament to another, transport along AFs is described as diffusion, with the effective diffusion coefficient D eff (Snider et al., 2004).
Based on these assumptions, the mathematical model is described by the following set of differential equations:
 |
(2) |
It follows from the above equations (Eq. 2) that the dynamics of pigment density are determined by the transport terms, ∂P(r, t)/∂t = −div(v + P + + v − P − − D effgradP AF), whereas other terms represent rates of transitions of the granule between the states shown schematically in Fig. 1 (the term k MTends P + describes the rate with which the granules in state P + fall off the MT ends). All rate constants are modeled as spatially invariant, except for k AM and k MTends, the values of which are determined by the spatial organization of MTs. The time dependence of rate constants is limited to short (∼1 min) time intervals, during which the system switches from aggregation to dispersion or vice versa. The rate constants are assumed to have changed their values from initial to final after these short transients. Note that the transients occurring with the onset of dispersion are somewhat longer than those associated with the beginning of aggregation (Fig. S1 B, available at http://www.jcb.org/cgi/content/full/jcb.200705146/DC1).
The system of governing equations (Eq. 2) is subject to boundary conditions at the inner and outer boundaries (the computational domain is depicted in Fig. S2 A). At the inner boundary, there is a net influx (outflow) of pigment granules into (out of) the lamella during dispersion (aggregation), whereas at the outer boundary, the net flux is zero. Therefore, in the case of dispersion, the boundary conditions are as follows: (v + P + − v − P −)r = a = f(t), (∂P AF/∂r)r = a = 0, and (v + P + − D eff∂P AF/∂r)r = R = 0, where the density of the net influx, f(t), can be inferred from variation of the pigment density at the innermost points of the lamella (see Parameter constraints section), and the uncertainties associated with it have only a small effect on the estimates of k MA and k AM (see Determination of kMA and kAM section). In the case of aggregation, the boundary conditions are ∂P AF/∂r)r = a = 0 and (v + P + − D eff∂P AF/∂r)r = R = 0, whereas the net outflow is determined automatically by the solution for P +(a, t) and P −(a, t). In the case of dispersion, all variables have zero initial values. The initial condition for aggregation, which is compatible with the boundary conditions, would be P +(r, 0) = P −(r, 0) = P 0(r, 0) = 0 and P AF(r, 0) = const. In the experiments, the initial pigment distribution averaged over 15 scans in five cells was not completely uniform but rather well approximated as ∝ 1 + 0.2exp(−(r −a)/l), with l = 8 μm. Therefore, this function was used to define P AF(r, 0).
Parameter constraints.
To obtain reliable estimates of k MA and k AM from the observed pigment dynamics, other model parameters must be tightly constrained. Constraining parameters simplifies because transitions between the MT-bound states occur much faster (seconds; Rodionov et al., 2003) than between MTs and AFs (minutes; Fig. 2 B). The separation of time scales allows one to uncouple the MT-bound states and treat them as a quasi-closed subset that attains equilibrium on a fast time scale. Rate constants for transitions between the MT-bound states, k 1–k 6, can then be estimated separately from k MA and k AM using the data from single-particle tracking (Zaliapin et al., 2005). For this purpose, two types of cells were used: cells with intact AFs and cells with disrupted AFs. The data on durations of plus runs (τ+), minus runs (τ−), and pauses (τ0) and on fractions of time spent in each of those states interpreted as P +, P −, and P 0 (Fig. S1 A) for cells with intact AFs are sufficient for inferring the values of k 1–k 6. Indeed, the conditions for the MT-bound states to be quasi-closed and near equilibrium yield the equations
 |
from which k 1–k 6 can be determined. The results shown in Fig. S1 B were obtained for the data presented in Fig. S1 A and were smoothed by fitting either to a constant (aggregation) or to a single exponential function (dispersion). The time dependence of k i (i = 1–6) during dispersion is therefore approximated by
 |
where t1 = 1 min, and the values of k i (aggr) (the aggregation k i value), k i (max, min), and k i (disp) (the steady-state dispersion value) as well as the time constants T i are shown in Table S1 for cells with intact AFs; similar results were obtained for cells with disrupted AFs.
Alternatively, k 1–k 6 can be evaluated by conditional analysis of the particle-tracking data, without additional assumptions. In this method, the rate constants are calculated directly from conditional statistics on durations of a given state terminated by another given state and from frequencies of such events, but the available conditional data were less extensive. It is interesting that two very different methods gave similar results, as evident from Fig. S1 C. In this figure, the coordinates of each plotted point are the values of a particular k i at a certain time obtained by the two methods. If these values were equal, the corresponding point would lie exactly on the line y = x. The trend lines are close to the bisector, which indicates agreement.
Particle-tracking data also yield estimates for the transport coefficients in the above equations (Eq. 2), namely for velocities of the MT-based plus and minus runs, v + and v −, and for the effective diffusion coefficient of migration along the actin network, D eff (Table S1). The latter can be estimated from the average displacements, <Δr>, over a certain time interval, Δt, in fish melanophores with disrupted MTs (Rodionov et al., 2003). For dispersion, <Δr> ≈ 1.1 μm over Δt = 14 s, and a rough estimate, D eff ∼ <Δr>2/Δt, yields the value of ≈0.09 μm2/s, which is comparable with that measured in frog melanophores (Snider et al., 2004). For aggregation, <Δr> ≈ 0.33 μm over the same time period, and D eff ≈ 0.008 μm2/s.
Other model parameters were either obtained from direct measurements (average radius of the cell, R ≈ 57 μm, and radii of the aggregate a) or taken from previously published papers (Vorobjev et al., 1999; Zaliapin et al., 2005). The latter applies to γ, the fraction of MTs that reach the cell periphery (Table S1). Note that γ is set to zero for dispersion to reflect the increased disassembly of MTs at the periphery during dispersion.
Finally, we determine a function that describes the granule influx at the inner boundary during dispersion. Because of pseudoequilibrium among MT-bound states, f(t) = v + P + (a) − v − P − (a) ∝ P MT (a). After the first minute of the transient, the dynamics of P MT at the inner boundary are determined by transitions to and from P AF and by the diffusion of P AF:
 |
(3) |
where the effect of diffusion along AFs at r = a is described in a single-exponential approximation with k diff ∼ D eff/a 2 and
 |
It then follows from the above equations (Eq. 3) that P MT ∝ exp(−(Tf 1)−1(t − t 1)) + δexp(−(Tf 2)−1(t − t 1)), where −1/Tf 1 and −1/Tf 2 are the eigenvalues of the linear system (3). Thus, the following function was used for f(t):
 |
where t 1 = 1 min as before. Values of Tf 1, Tf 2, and δ in Table S1 correspond to the set (k MA, k 0) that provides the best fit to the experimentally observed pigment dispersion (see Determination of kMA and kAM section).
Solution methods.
With model parameters constrained as described in the previous section, the system of equations (Eq. 2) was solved with varying k MA and k 0 (k 0 = k AM (a)/(1 + γ); see Eq. 1) to determine the parameter set that minimizes the difference between model predictions and the experimental measurements. Because of radial symmetry, the problem can be reduced to one spatial dimension. This is done by changing variables, p σ(r, t) = rP σ(r, t) (σ = 0, +, −, AF), both in the above equations (Eq. 2) and in boundary and initial conditions. In terms of new variables, the above equations (Eq. 2) take the form
 |
(4) |
The above equations (Eq. 4) are linear and therefore can be treated analytically. However, because the unknown parameters enter both the equations and boundary conditions and are to be found from fitting the experimental data, numerical solution of the problem becomes the only practical option. The equations (Eq. 4) have been solved numerically using a newly developed capability of the Virtual Cell computational framework to solve advection-diffusion-reaction equations (Slepchenko et al., 2003). The algorithm utilizes a hybrid method that switches between central difference and upwind discretization schemes for the advection term depending on the local Peclet number (Ferziger and Peric, 2002). The method was validated extensively against exact solutions and through regression testing. The one-dimensional computational domain was sampled evenly using 81 nodes. This resulted in a mesh size of 0.5 μm in the case of dispersion and one of 0.55 μm in the case of aggregation. Integration was performed with 1-ms time steps. The error of the numerical solution is estimated to be <1.5%.
Determination of k MA and k AM.
Dispersion.
The experimentally observed pattern of pigment dynamics during dispersion is consistent with dominance by actin-based transport. This means that with onset of dispersion, the ratio k MA/k 0 quickly becomes large (computer simulations with insufficiently large k MA/k 0 values resulted in patterns with a higher pigment density at the periphery than in the cell interior, which was not observed in the experiment). The individual values of k MA and k 0 are inferred from density dynamics at the periphery (Fig. S2 A, blue reference point), as illustrated in Fig. S2 B. Each curve in this figure was obtained with its own set of flux parameters (Tf 1, Tf 2, and δ) that, for fixed values of k MA and k 0, provided a reasonably accurate approximation of the data at the innermost point. However, the choice of these parameters had only little effect on the simulated dynamics at the periphery. With both k MA and k 0 being too large (but k 0 is still much smaller than k MA), frequent switching between MTs and AFs effectively impedes the transport, and the increase in density at the periphery is very slow. If k MA is too small, the granule stays on the MT too long and, therefore, arrives at the periphery ahead of time. Overall, computer simulations with the parameters k 1–k 6 obtained from the cells with intact AFs (Table S1) yielded fits within the measurement error only if k AM (a) did not exceed 5 × 10⁻³ min−1 (for this case, k AM (a) = k 0) and k MA was in the range of 5–7 min−1. This corresponds to the irreversible transfer of granules from MTs to AFs during dispersion, which is consistent with uniform steady-state distribution. In fact, because MT-based transport during dispersion is dominated by kinesin, even a relatively small fraction of granules that remains on the MTs would produce a noticeable shift of the pigment distribution toward the periphery, which was not seen in the experiment. The results in Fig. 2 C (left) were obtained with k MA = 6.5 min−1 and k AM (a) = 2.5 × 10⁻³ min−1 and correspond to the color-coded reference points depicted in Fig. S2 A. Computer simulations based on the values of k 1–k 6 for cells with disrupted AFs yielded the same ranges for k MA and k AM. This is illustrated in Fig. S2 C.
Aggregation.
During pigment aggregation, the density dynamics at the innermost point largely depend on the ratio k 0/k MA, whereas pigment density reduction at the cell periphery is governed primarily by k 0. This separation of sensitivities facilitates optimization of the parameter values. Fig. S2 D illustrates the simulated dynamics at the innermost (brown) and outermost (blue) points with varying k 0/k MA and k 0. Surprisingly, the range of optimal values for k MA yielded by the analysis, 3–5 min−1, does not differ much from that during dispersion, whereas k AM(a) (= k 0(1 + γ)) rises dramatically to values around 10 min−1. We conclude that during aggregation, the transitions between the two cytoskeletal transport systems are reversible, which is in contrast with dispersion. The simulation results (Fig. 2 C, right) were obtained with k MA= 4.5 min−1 and k AM(a) = 10.7 min−1 (k 0 = 7.9 min−1) and are shown for the same color-coded reference points as for dispersion.
Online supplemental material
Fig. S1 shows parameter constraints, and Fig. S2 shows the determination of k AM and k MA. Table S1 contains parameters values. Online supplemental material is available at http://www.jcb.org/cgi/content/full/jcb.200705146/DC1.
Supplemental Material
Acknowledgments
We thank Dr. Anna Kashina for long-lasting helpful criticism and for editing the manuscript and thank Dr. Igor Novak for discussions. Data analysis was performed, in part, at the Aspen Center for Physics.
This work was supported by National Institutes of Health grant RR13186 to B.M. Slepchenko and V. Rodionov and grant GM GM-62290 to V. Rodionov.
Abbreviations used in this paper: AF, actin filament; MT, microtubule.
References
- Atkinson, S.J., S.K. Doberstein, and T.D. Pollard. 1992. Moving off the beaten track. Curr. Biol. 2:326–328. [DOI] [PubMed] [Google Scholar]
- Bridgman, P.C. 1999. Myosin Va movements in normal and dilute-lethal axons provide support for a dual filament motor complex. J. Cell Biol. 146:1045–1060. [DOI] [PMC free article] [PubMed] [Google Scholar]
- Caviston, J.P., and E.L. Holzbaur. 2006. Microtubule motors at the intersection of trafficking and transport. Trends Cell Biol. 16:530–537. [DOI] [PubMed] [Google Scholar]
- Ferziger, J.H., and M. Peric. 2002. Computational Methods for Fluid Dynamics. Springer-Verlag New York, Inc., New York. 423 pp.
- Gardiner, C.W. 2004. Handbook of Stochastic Methods for Physics, Chemistry, and the Natural Sciences. Springer-Verlag New York, Inc., New York. 415 pp.
- Gross, S.P., M.C. Tuma, S.W. Deacon, A.S. Serpinskaya, A.R. Reilein, and V.I. Gelfand. 2002. Interactions and regulation of molecular motors in Xenopus melanophores. J. Cell Biol. 156:855–865. [DOI] [PMC free article] [PubMed] [Google Scholar]
- Guzik, B.W., and L.S. Goldstein. 2004. Microtubule-dependent transport in neurons: steps towards an understanding of regulation, function and dysfunction. Curr. Opin. Cell Biol. 16:443–450. [DOI] [PubMed] [Google Scholar]
- Hollenbeck, P.J., and W.M. Saxton. 2005. The axonal transport of mitochondria. J. Cell Sci. 118:5411–5419. [DOI] [PMC free article] [PubMed] [Google Scholar]
- Kuznetsov, S.A., G.M. Langford, and D.G. Weiss. 1992. Actin-dependent organelle movement in squid axoplasm. Nature. 356:722–725. [DOI] [PubMed] [Google Scholar]
- Lane, J., and V. Allan. 1998. Microtubule-based membrane movement. Biochim. Biophys. Acta. 1376:27–55. [DOI] [PubMed] [Google Scholar]
- Langford, G.M. 1995. Actin- and microtubule-dependent organelle motors: interrelationships between the two motility systems. Curr. Opin. Cell Biol. 7:82–88. [DOI] [PubMed] [Google Scholar]
- Morris, R.L., and P.J. Hollenbeck. 1995. Axonal transport of mitochondria along microtubules and F-actin in living vertebrate neurons. J. Cell Biol. 131:1315–1326. [DOI] [PMC free article] [PubMed] [Google Scholar]
- Nascimento, A.A., J.T. Roland, and V.I. Gelfand. 2003. Pigment cells: a model for the study of organelle transport. Annu. Rev. Cell Dev. Biol. 19:469–491. [DOI] [PubMed] [Google Scholar]
- Nedelec, F., T. Surrey, and A.C. Maggs. 2001. Dynamic concentration of motors in microtubule arrays. Phys. Rev. Lett. 86:3192–3195. [DOI] [PubMed] [Google Scholar]
- Nilsson, H., and M. Wallin. 1997. Evidence for several roles of dynein in pigment transport in melanophores. Cell Motil. Cytoskeleton. 38:397–409. [DOI] [PubMed] [Google Scholar]
- Rodionov, V.I., F.K. Gyoeva, and V.I. Gelfand. 1991. Kinesin is responsible for centrifugal movement of pigment granules in melanophores. Proc. Natl. Acad. Sci. USA. 88:4956–4960. [DOI] [PMC free article] [PubMed] [Google Scholar]
- Rodionov, V.I., S.S. Lim, V.I. Gelfand, and G.G. Borisy. 1994. Microtubule dynamics in fish melanophores. J. Cell Biol. 126:1455–1464. [DOI] [PMC free article] [PubMed] [Google Scholar]
- Rodionov, V.I., A.J. Hope, T.M. Svitkina, and G.G. Borisy. 1998. Functional coordination of microtubule-based and actin-based motility in melanophores. Curr. Biol. 8:165–168. [DOI] [PubMed] [Google Scholar]
- Rodionov, V., J. Yi, A. Kashina, A. Oladipo, and S.P. Gross. 2003. Switching between microtubule- and actin-based transport systems in melanophores is controlled by cAMP levels. Curr. Biol. 13:1837–1847. [DOI] [PubMed] [Google Scholar]
- Rogers, S.L., and V.I. Gelfand. 1998. Myosin cooperates with microtubule motors during organelle transport in melanophores. Curr. Biol. 8:161–164. [DOI] [PubMed] [Google Scholar]
- Slepchenko, B.M., J.C. Schaff, I. Macara, and L.M. Loew. 2003. Quantitative cell biology with the Virtual Cell. Trends Cell Biol. 13:570–576. [DOI] [PubMed] [Google Scholar]
- Smith, D.A., and R.M. Simmons. 2001. Models of motor-assisted transport of intracellular particles. Biophys. J. 80:45–68. [DOI] [PMC free article] [PubMed] [Google Scholar]
- Snider, J., F. Lin, N. Zahedi, V. Rodionov, and S.P. Gross. 2004. Intracellular actin-based transport: how far you go depends on how often you switch. Proc. Natl. Acad. Sci. USA. 101:13204–13209. [DOI] [PMC free article] [PubMed] [Google Scholar]
- Soldati, T., and M. Schliwa. 2006. Powering membrane traffic in endocytosis and recycling. Nat. Rev. Mol. Cell Biol. 7:897–908. [DOI] [PubMed] [Google Scholar]
- Tuma, M.C., A. Zill, N. Le Bot, I. Vernos, and V. Gelfand. 1998. Heterotrimeric kinesin II is the microtubule motor protein responsible for pigment dispersion in Xenopus melanophores. J. Cell Biol. 143:1547–1558. [DOI] [PMC free article] [PubMed] [Google Scholar]
- Vale, R.D. 2003. The molecular motor toolbox for intracellular transport. Cell. 112:467–480. [DOI] [PubMed] [Google Scholar]
- Vaughan, P.S., P. Miura, M. Henderson, B. Byrne, and K.T. Vaughan. 2002. A role for regulated binding of p150(Glued) to microtubule plus ends in organelle transport. J. Cell Biol. 158:305–319. [DOI] [PMC free article] [PubMed] [Google Scholar]
- Vorobjev, I.A., V.I. Rodionov, I.V. Maly, and G.G. Borisy. 1999. Contribution of plus and minus end pathways to microtubule turnover. J. Cell Sci. 112:2277–2289. [DOI] [PubMed] [Google Scholar]
- Zaliapin, I., I. Semenova, A. Kashina, and V. Rodionov. 2005. Multiscale trend analysis of microtubule transport in melanophores. Biophys. J. 88:4008–4016. [DOI] [PMC free article] [PubMed] [Google Scholar]
Associated Data
This section collects any data citations, data availability statements, or supplementary materials included in this article.