

Abstract
Olfactomedin 1 (Olfm1) is a founding member of the family of olfactomedin domain-containing proteins. It is a secreted protein that performs different roles in different species. Although the molecular mechanisms of Olfm1 action are not known, its possible roles include the regulation of neural crest cell production, neuronal differentiation and ischemic neuronal death in adult. Two zebrafish olfm1 gene (olfm1a and olfm1b) located on chromosomes 5 and 21 were identified in zebrafish genome. Four different transcripts are produced from each olfm1 gene. The distribution of these transcripts in the course of zebrafish early development was studied by in situ hybridization and quantitative RT-PCR. Different variants of olfm1 mRNA were present mainly in neurogenic tissues and demonstrated overlapping expression patterns.
Keywords: olfactomedin, zebrafish, development, in situ hybridization, motor neurons, Rohon-Beard neurons, trigeminal ganglia, neural crest
1. Results and discussion
Olfactomedin 1 (Olfm1), also known as noelin (Barembaum et al., 2000; Moreno and Bronner-Fraser, 2001) and pancortin (Nagano et al., 1998), is a highly conserved secreted glycoprotein that was originally isolated from the bullfrog olfactory neuroepithelium (Snyder et al., 1991). The C-terminal olfactomedin domain was subsequently identified in a family of proteins consisting of at least 13 members in mammals (Zeng et al., 2005). Some family members, such as latrophilins and gliomedin, are membrane-bound proteins with the olfactomedin domain in the extracellular N-terminal region, while the intracellular C-terminal domain of these proteins is essential for the transduction of extracellular signals to intracellular signaling pathways (Volynski et al., 2004; Eshed et al., 2005). Other family members are secreted glycoproteins that may play important roles in normal development and diseases, although molecular mechanisms of their action are still not clear. Available data suggest that Olfm1 may have differing functions in different vertebrates. Chicken Olfm1 is involved in the regulation of the production of neural crest cells by the neural tube (Barembaum et al., 2000), while Xenopus Olfm1 promotes neuronal differentiation (Moreno and Bronner-Fraser, 2001; Moreno and Bronner-Fraser, 2005). Recent data suggest that mouse Olfm1 interacts with WAVE1 and Bcl-xL and forms a mitochondria-associated protein complex that mediates ischemic neuronal death in adult, but non embryonic, cerebral cortical neurons (Cheng et al., 2007). Olfactomedin domain in Olfm1 may be essential for interaction with other proteins (Torrado et al., 2002), including receptors and extracellular matrix proteins (Eshed et al., 2005; Liu et al., 2006).
Four structurally different mRNA, named AMY, BMY, AMZ, and BMZ, are produced from the Olfm1 gene. They share a common central region (M) and have two different transcription start sites (A or B), and two different 3′-regions (Y and Z) produced by alternative splicing (Danielson et al., 1994). AMY and BMY variants encode a shorter form of Olfm1 that lacks the olfactomedin domain, while AMZ and BMZ variants encode proteins containing the olfactomedin domain.
Expression of the Olfm1 gene is somewhat different in several studied species. In chicken, Olfm1 is expressed in the closing neural tube and later becomes restricted to the dorsal neural folds and migrating neural crest (Barembaum et al., 2000). In Xenopus, Olfm1 mRNA was detected mainly in postmitotic neurogenic tissues in the developing central and peripheral nervous systems, first appearing after neural tube closure (Moreno and Bronner-Fraser, 2001; Moreno and Bronner-Fraser, 2002; Moreno and Bronner-Fraser, 2005). In mice, AMZ and BMZ variants of Olfm1 mRNA were detected in the early neural plate and ectoderm. Later they become detected in brain, some cranial placodes, cranial neural crest and pharyngeal endoderm. As development progresses, these mRNAs were detected in marginal zone cells of the neural tube, cranial ganglia and dorsal root ganglia (Moreno and Bronner-Fraser, 2005). In adult rats, only BMZ and BMY Olfm1 mRNAs were abundant in the cerebral cortex including the hippocampus and the olfactory bulbs, while the levels of AMY and AMZ variants was very low (Nagano et al., 1998).
Zebrafish represents an excellent experimental system to study gene expression and function in early development. In this paper, we have identified two zebrafish olfm1 genes and characterized the expression patterns of different splice forms. Zebrafish olfm1 genes demonstrate conservation in sequence and in gene structure to other vertebrates showing the overlapping expression patterns more closely resembling the expression pattern of Xenopus Olfm1.
1.1. Nomenclature and sequence analysis of zebrafish olfm1 genes
Four genes encoding proteins highly homologous to mouse Olfm1 protein were identified in the zebrafish genome. These genes were located on chromosomes 5, 14, 21 and 24. Proteins encoded by the genes located on chromosomes 5 and 21 showed 84% identity to mouse Olfm1 (Nagano et al., 1998) and lower identity to Olfm2 (53–54% identity) and Olfm3 (60% identity). Proteins encoded by genes located on chromosomes 14 and 24 showed the highest identity to mammalian Olfm2 (74%) and Olfm3/optimedin (83%) (Torrado et al., 2002), respectively, while their identity with Olfm1 was about 60%. Since a significant part of the zebrafish genome has been duplicated during evolution, we concluded that the chromosomes 5 and 21 genes are orthologs of mouse Olfm1. The zebrafish olfm1 genes located on chromosomes 5 and 21 will be called olfm1a and olfm1b, respectively. Olfm1a and Olfm1b are 88% identical at the protein level.
Similar to mouse Olfm1, four different transcripts were predicted for both olfm1a and olfm1b genes, giving at least eight different olfm1 transcripts in zebrafish (Fig. 1). The existence of these transcripts was supported by several lines of evidence. First, multiple clones were identified in the zebrafish EST database that contained exons 1 or 1′ followed by exons 2 and 3 and 4′ for both olfm1a and olfm1b genes. Second, full-length cDNA of the olfm1b gene containing exons 1, 2–6 was amplified and cloned from 72 hpf zebrafish embryos. Finally, exon 6 of the olfm1a gene and exon 4 of both olfm1 genes were amplified by RT-PCR from different developmental stages.
Fig. 1.
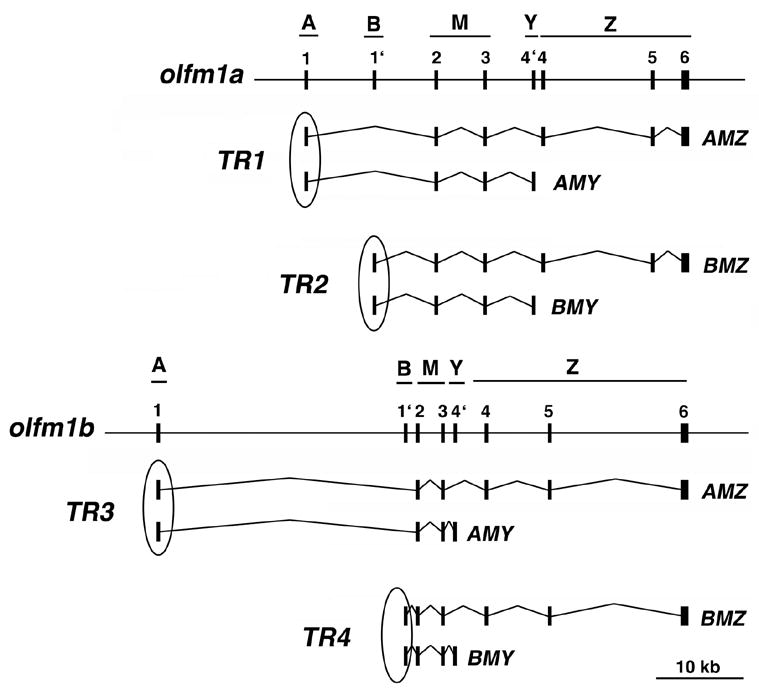
Exon-intron organization of the zebrafish olfm1 genes and the structure of corresponding transcripts. A, B, M, Y and Z correspond to different regions of olfm1 mRNAs previously identified in Olfm1 mRNAs of other vertebrates. Exons 1 (region A) or 1′ (region B) and 4′ (region Y) or 4 (part of region Z) are not used in the same transcripts. Transcripts having the same 5′-exons and transcribed from the same promoter were unified in the groups (TR1-4). Circles over exon 1 or 1′ indicate the position of probes used for in situ hybridization.
Fig. 2 compares the deduced amino acid sequences from these transcripts to the sequences of the mouse AMZ and BMZ Olfm1 forms. It is interesting to note that when Olfm1 sequences belonging to different vertebrate species are compared, the M part, which is retained in all Olfm1 isoforms, is as conserved as the C-terminal Z part containing the olfactomedin domain.
Fig. 2.
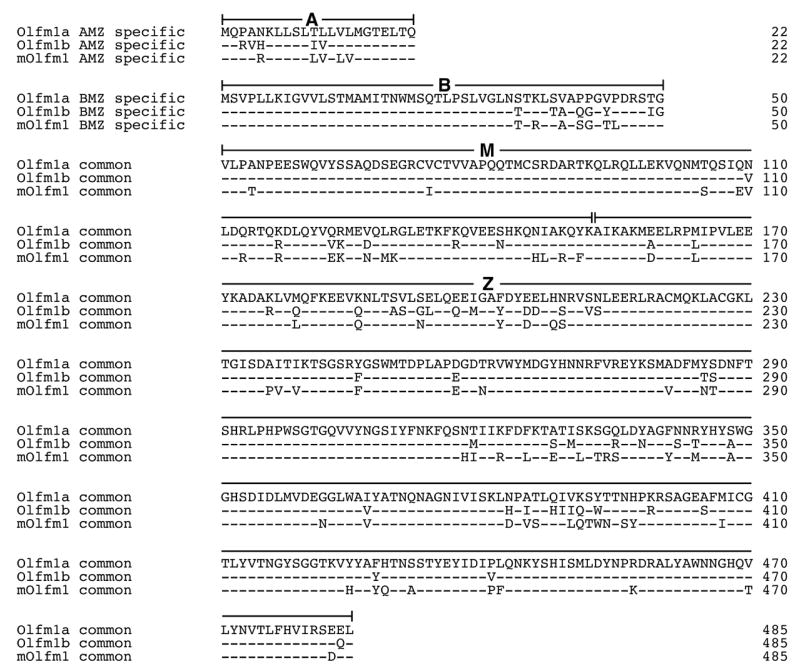
Comparison of the zebrafish Olfm1 sequences with that of mouse Olfm1. The “− “ symbols in Olfm1b and mouse Olfm1 mark amino acids that are identical to those in Olfm1a. A, B, M and Z denote parts encoded by different regions of olfm1 mRNAs (see Fig. 1). Exon 4′ encodes only one amino acid (Glycine) and is not shown in the Fig. Numbering for the M and Z parts is shown for the BMZ form.
1.2. Expression pattern of the olfm1a and olfm1b genes during embryonic development of zebrafish
Since there are no sequences that would be unique to each transcript, we have studied expression patterns of groups of transcripts from different promoters. Each group consisted of long and short forms of the transcripts from the same promoter. These groups will be referred to as TR1 (AMZ and AMY transcripts of the olfm1a gene), TR2 (BMZ and BMY transcripts from the olfm1a gene), TR3 (AMZ and AMY transcripts from the olfm1b gene) and TR4 (BMZ and BMY transcripts from the olfm1b gene) through the paper (see Fig. 1).
The spatial expression patterns of each group of transcripts was obtained by whole-mount in situ hybridization using the DIG-labeled antisense RNA probes specific for the 5′-end of each group. Different transcripts of the olfm1 genes showed complex overlapping patterns of expression as summarized in Table 1. In brief, for both olfm1a and olfm1b genes, transcripts having exon 1′ as the first exon (TR2 and TR4 groups) were detected first starting from 16 hpf (Fig. 3A). TR2 transcripts were present in the developing eye, trigeminal placodes and the ventral neural tube, while TR4 transcripts were strongly expressed in the trigeminal placodes. The levels of TR2 and TR4 expression increased in these areas between 16 and 24 hpf, and additional sites of expression were detected in the epibranchial placodes/ganglia, midbrain and telencephalon. Sectioning of the stained embryos demonstrated that in the eye TR2 transcripts were present mainly in the dorsal-posterior retina (Fig. 3O–P). In the neural tube, TR2 transcripts were present in motor neuron-containing outer layers of the ventral neural tube (Wilson and Maden, 2005). TR4 transcripts were instead found in the dorsal neural tube, in the sensory Rohon-Beard neurons (Wilson and Maden, 2005) (Fig. 3K). This is confirmed by immunostaining of TR2 in situ hybridization samples with islet antibodies, which stain motor and sensory neurons and ganglia (Korzh et al., 1993; Appel et al., 1995). TR2 and islet showed overlapping expression pattern in trigeminal ganglia (Fig. 3Q) and ventral neural tube (not shown), although in the neural tube TR2 stained a broader population of neurons compared with islet. At later developmental stages (35 and 55 hpf), expression of both TR2 and TR4 was significantly reduced in the neural tube (Fig. 3R,T), and was detected in telencephalon, ventral diencephalon, and dorsolateral and epibranchial placode/ganglia (Fig. 3R, T, V, X). In addition, TR4 was also expressed in the optic tectum. This is similar to mouse brain development, where high levels of Olfm1 are detected in the adult but not in the embryonic cortex (Cheng et al., 2007).
Table 1.
Summary of TR1-TR4 expression pattern
| Telencephalon | Diencephalon | Hindbrain | Optic vesicle | Olfactory placode | Spinal cord | Trigeminal ganglia | Epibranchial placode | Pronephros | ||
|---|---|---|---|---|---|---|---|---|---|---|
| TR1 | − | − | − | − | − | − | − | − | − | |
| TR2 | − | − | − | + | − | − | + | − | − | |
| 16 hpf | TR3 | − | − | − | − | − | − | − | − | − |
| TR4 | − | − | − | − | − | − | ++ | − | − | |
| TR1 | − | − | − | − | − | − | + | − | − | |
| TR2 | − | − | − | ++ | − | ++ | + | ++ | − | |
| 20 hpf | TR3 | − | + | − | + | − | + | − | − | ++ |
| TR4 | − | − | − | − | − | + | ++ | − | − | |
| TR1 | + | − | − | − | − | + | + | − | − | |
| TR2 | ++ | − | − | ++ | − | ++ | ++ | ++ | − | |
| 24 hpf | TR3 | − | + | − | + | − | ++ | ++ | + | ++ |
| TR4 | ++ | − | − | ++ | − | ++ | ++ | − | − | |
| TR1 | + | + | − | − | − | − | + | + | − | |
| TR2 | +++ | + | ++ | ++ | − | + | +++ | ++ | − | |
| 35 hpf | TR3 | ++ | ++ | ++ | ++ | − | ++ | ++ | ++ | − |
| TR4 | +++ | + | − | + | ++ | + | +++ | +++ | − | |
| TR1 | + | + | ++ | + | − | − | + | + | − | |
| TR2 | +++ | +++ | +++ | ++ | − | − | +++ | ++ | − | |
| 55 hpf | TR3 | +++ | +++ | +++ | + | − | ++ | +++ | + | − |
| TR4 | +++ | +++ | +++ | ++ | ++ | + | +++ | + | − |
− indicates the absence of hybridization signals, while +, ++, and +++ indicate weak, medium and strong hybridization signals, respectively
Fig. 3.
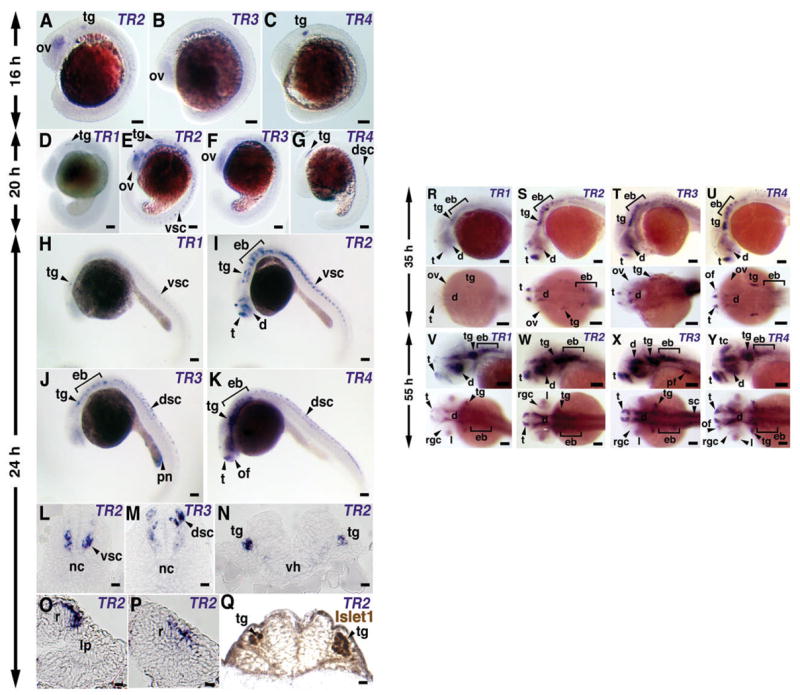
Expression patterns of TR1-4 in developing zebrafish embryos. Antisense RNA probes for whole-mount in situ hybridization were specific for each group and prepared as described in Material and Methods. (A–C) 16 hpf embryos. (D–G) 20 hpf embryos. (H–P) 24 hpf embryos. L, M and N show 10 μm frozen sections at the trunk level (L and M) and at the level of hindbrain (N). TR2 and TR3 mRNAs are expressed in the different part of neural tube (L and M). TR2 expression was also observed in trigeminal ganglia (N). O and P show 10 μm frozen sections at the eye level. The strong TR2 signal was detected in dorsal (O) and posterior (P) retina. (Q) 24 hpf embryos first hybridized to TR2 probe and then stained with islet1 antibodies. Frozen section at the hindbrain level is shown. Trigeminal ganglia (tg) express both TR2 (N) and islet1 (Q). (R–U) 35 hpf embryos. TR1 showed weak signal while all other transcripts are strongly expressed in telencephalon, ventral diencephalons and dorsolateral and epibranchial placodes/ganglia. TR3 has a stronger expression at the preoptic commissure than other transcripts and TR4 is expressed in the olfactory placode. (V–Y) 55 hpf embryos. All transcripts strongly expressed in telencephalon, diencephalons and dorsolateral and epibranchial placodes/ganglia. TR4 has specific expressions in the optic tectum (arrowhead). Abbreviations: d – diencephalon; dsc – dorsal spinal cord; eb – epibranchial placode/ganglia; l – lens; lp – lens placode; nc – notochord; of – olfactory placode; ov - optic vesicle; pn – pronephros; r – retina; rgc – retinal ganglion cells; sc – spinal cord; t – telencephalon; tc – tectum; tg – trigeminal placode/ganglia; vh– ventral hypothalamus; vsc – ventral spinal cord. A-C Scale Bar, 0.1 mm. D, E Scale bar, 0.01 mm. F, G Scale bar, 0.1 mm.
TR1 and TR3 had similar expression patterns but later outset than TR2 and TR4. At 16 hpf, there was no obvious expression of TR1 (not shown) and only very weak expression of TR3 (Fig. 3B). At 24 hpf, expression of TR3 was detected in the developing kidney (Fig. 3J). At an advanced developmental stage (55 hpf), levels of TR1 and TR3 expression were comparable with those of TR2 and TR4. At this stage, TR1 demonstrated more limited expression pattern compared to TR2. For example, no TR1 signals were detected in the olfactory placode (Fig. 3Q, U).
The expression patterns of the olfm1 genes during early embryonic development (10–31 hpf) were analyzed by Q-PCR. When oligonucleotide primer sets specific to the 5′-ends of different olfm1 mRNA variants were used, TR1 and TR2 messages, transcribed from the olfm1a gene, were first detected at 12 hpf, while TR3 and TR4 messages, transcribed from the olfm1b gene, were first detected at 20 hpf and 14 hpf, respectively (data not shown). The abundance of all transcripts dramatically increased with development until the last analyzed stage (31 hpf). To estimate relative amounts of the long (AMZ and BMZ) and short (AMY and BMY) forms of olfm1a and olfm1b mRNAs, forward primer located in exon 3 and reverse primers located in exon 4′ or 4 were used in Q-PCR. These experiments demonstrated that the activation of the olfm1a gene transcription in early development was mainly due to the accumulation of the long forms which were the predominant forms, comparing to the shorter forms, which did not show a significant increase in the first 24 hpf. On the other hand, both longer and shorter forms transcribed from the olfm1b gene showed strong increase from 18 hpf (not shown).
1.3. Expression pattern of BAC DNA encoding olfm1b gene
To evaluate the size of the promoter/enhancer region of the zebrafish olfm1 gene, BAC DNA encoding the full-length olfm1b gene including 8 kb of the 5′-flanking and 85 kb of the 3′-flanking sequences was injected into zebrafish embryos. This DNA showed a mosaic expression as judged by in situ hybridization with probes specific for TR3 or TR4 transcripts. The levels of mRNA transcribed from the injected BAC DNA was significantly higher than from endogenous olfm1b gene and this mRNA was detected after 3 h of staining after in situ hybridization, while 30 h were normally needed to visualize the expression of the endogenous gene, so that we could distinguish the expression of ectopically introduced olfm1b gene from the endogenous expression. Both TR3 and TR4 transcripts from BAC DNA were detected in the same cells (Rohon-Beard neurons, trigeminal placode/ganglia and the telencephalon) as the expression of endogenous gene in 24 hpf embryos, with TR4 producing stronger and more numerous hybridization signals as compared with TR3 (Fig. 4 and Table 2). TR3 and TR4 transcripts were also detected in the hindbrain of few embryos, although we could not distinguish whether they were present in the neural tube or epibrancheal placodes. We concluded that most of the promoter-enhancer sequences for the TR4 transcript are present in BAC DNA, while some of the promoter/enhancer sequences for the TR3 transcript may be located outside of the 8 kb 5-upstream sequence.
Fig. 4.
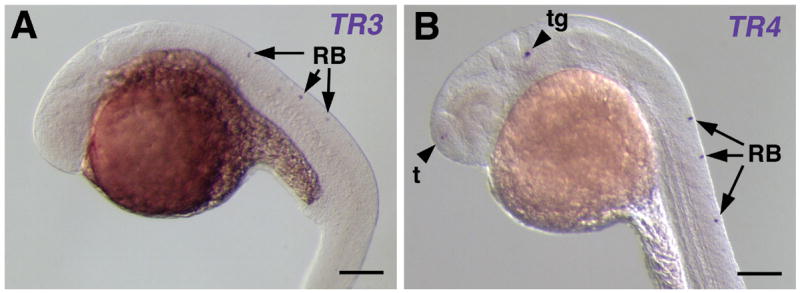
Expression pattern of the olfm1b gene from ectopically injected BAC DNA. One cell stage embryos were injected with 30 pg of olfm1b BAC DNA and analyzed by in situ hybridization for TR3 and TR4 expression. The signal of TR3 was only observed in the dorsal spinal cord (A, arrowheads), while TR4 expression was detected mainly in the telencephalon (t), trigeminal ganglia (tg) and Rohon-Beard neurons (RB) (B). Scale bar, 0.1 mm.
Table 2.
Distribution TR3 and TR4 expression in 24 hpf embryos injected with olfm1b BAC DNA
| % embryos
|
||||
|---|---|---|---|---|
| Transcripts | Telencephalon | Trigeminal ganglia | Epibrancheal placode/neural tube | Rohon-Beard neurons |
| TR3 | 0 | 38 | 25 | 75 |
| TR4 | 63 | 88 | 38 | 50 |
8 embryos were analyzed for both TR3 and TR4 probes.
In summary, different splice variants of the olfm1 genes demonstrated overlapping but not identical expression patterns and were expressed mainly in neural tissues in the course of early development. These expression patterns were more similar to the pattern of expression of the Xenopus Olfm1 gene than to the chicken Olfm1 gene (Barembaum et al., 2000; Moreno and Bronner-Fraser, 2001; Moreno and Bronner-Fraser, 2002). Similar to Olfm1 gene expression in Xenopus, the zebrafish olfm1 genes are expressed mainly after formation of neural crest which in the head region occurs at 12 hpf (Schilling and Kimmel, 1994). The activation of the olfm1 genes expression takes place after the beginning of neural crest migration that starts around 15–16 hpf in the anterior region of the embryos (Schilling and Kimmel, 1994). Zebrafish olfm1 genes are most actively expressed in the neurogenic tissues of the developing central and peripheral nervous systems. Further studies are in progress to elucidate the role of the Olfm1 in neural development by protein knockdown using morpholinos and overexpression of the olfm1 genes.
2. Experimental procedures
2.1. Husbandry of fishes
Wild-type zebrafish were maintained as described by Westerfield (2000). Embryos were produced by natural matings. All experiments using animals were approved by the NEI Animal Use and Care Committee.
2.2 Identification of the zebrafish olfm1 genes
The mouse Olfm1 protein sequence (BAA28765) was used for a blast search (http://www.ncbi.nlm.nih.gov/BLAST/) of the zebrafish genome database (http://www.ensembl.org/Multi/blastview). Zebrafish EST IMAGE clones were purchased from Open Biosystems. Clones 7274404 and 7256463 correspond to two transcripts from two different promoters of the zebrafish olfm1a gene, while clones 7904578 and 7429384 correspond to two transcripts from two different promoters of the zebrafish olfm1b gene (see Results and discussion). BAC DNA (CH211-11G18) containing the zebrafish olfm1b gene and 8 kb and 85 kb of 5′- and 3′-flanking sequences was obtained from BACPAC Resources.
2.3. In situ RNA hybridization
The 5′-probes specific to each of the cDNA clones (see above) were amplified by PCR and cloned into the pcDNA3 vector (Invitrogen). Each of these probes recognizes two different transcripts having different 3′-ends as a result of alternative splicing. They will be called TR1, TR2, TR3 and TR4 through the text (see Results and discussion for more details). The following primers were used to prepare TR1-4 probes (the sizes of the amplicons are shown in the parenthesis):
| TR1 (FW): | 5′-ATAAGCTTAGCGATGATGGCCTACTGGA-3′ and |
| TR1 (RV): | 5′-ATAAGCTTGGGTGAGTTCGGTACCCA-3′ (331 bp) |
| TR2 (FW): | 5′-ATAAGCTTCGAGTGGAGAGAGAAGAC-3′ and |
| TR2 (RV): | 5′-ATAAGCTTGCCAGTGCTCCTGTCCGGCA-3′ (387 bp) |
| TR3 (FW): | 5′-ATAAGCTTGGAGAGACACACGGGAGAAA-3′ and |
| TR3 (RV): | 5′-ATAAGCTTGCGTGAGTTCCGTGCCCA-3′ (327 bp) |
| TR4 (FW): | 5′-ATAAGCTTCTAAAGGGCGTGAACGCACA-3′ and |
| TR4 (RV): | 5′-ATAAGCTTCCTATACTCCGGTCCGGAT-3′ (440 bp). |
Digoxigenin-labeled cRNA probes were synthesized by in vitro transcription of the corresponding linearized plasmids using SP6-, T7- or T3-polymerase and DIG-RNA-labeling mixture (Roche). Whole mount in situ hybridization was performed as described previously (Toyama et al., 1995). After the visualization of in situ hybridization signals, some embryos were embedded in OCT and 10 μm frozen sections were prepared and counterstained with DAPI (1 μg/ml). The mounted sections were observed under an Axoplan2 microscope (Zeiss).
2.4. Quantitative RT-PCR (Q-PCR)
Ten embryos from each developmental stage were dechorionated and homogenized in 500 μl of Trizol (Invitrogen) using Polytron (Kinematica, Inc.) at the maximum power for 1 minute. Total RNA was isolated from the lysates following the manufacturer’s protocol. RNA was dissolved in distilled water at concentrations of 0.1–0.3 μg/μl. Q-PCR was performed using 0.5 μg of total RNA as described previously (Hemish et al., 2003). Briefly, RNA was converted to cDNA using Taqman Reverse Transcription Reagents (Applied Biosystems) and then dispensed into a 96-well PCR plate. Forward and reverse primers for a target gene and SYBR Green PCR Master Mix (Applied Biosystems) were added into each wells and PCR reaction was performed and monitored using a 7900HT Real Time Thermocycler (Applied Biosystems). Elongation factor 1α (EF1α) was amplified simultaneously for normalization after confirmation that its expression was not dramatically changed during developmental stages under study. Primers used for the Q-PCR were as follows:
| TR1 (FW): | 5′-ACCTCATTCTGCCGCTGAATT–3′ |
| TR1 (RV): | 5′-CTGTCCGGCTCGATGCTT–3′ |
| TR2 (FW): | 5′-CGATGATCACCAACTGGATGTC-3′ |
| TR2 (RV): | 5′-GCCACGCTTAATTTGGTGCTA-3′ |
| TR3 (FW): | 5′-TCTCTGTCATTCCGTTGCTGA-3′ |
| TR3 (RV): | 5′-GTGCTCACTCCTCGCTCTCC-3′ |
| TR4 (FW): | 5′-GGTGCTCAGCACCATGGC-3′ |
| TR4 (RV): | 5′-GCGGTCAGTTTGGTGGTGTT-3′ |
| Olfm1a Y form (FW): | 5′-GCTGCAGAGACTGAAGAACAAGTT-3′ |
| Olfm1a Y form (RV): | 5′-AACTGAATGATGCGATCAGTTGAC-3′ |
| Olfm1a Z form (FW): | 5′-CCACAACAGGGTGTCTAATCTTGA-3′ |
| Olfm1a Z form (RV): | 5′-AGTCAGCTTCCCACAGGCTAAT-3′ |
| Olfm1b Y form (FW): | 5′-GAGAGCCAGAGGCCAGAAGAA-3′ |
| Olfm1b Y form (RV): | 5′-CGTGACATAAACAGCGTGACTGA-3′ |
| Olfm1b Z form (FW): | 5′-TGCAGAATCTGACTGCGAGTCT-3′ |
| Olfm1b Z form (RV): | 5′-GGAGTGCAGGTCATCATAGTCATAA-3′ |
| ef1α (FW): | 5′-CAGTGCTGGATTGCCACACT-3′ |
| ef1α (RV): | 5′-CCAGAACGACGGTCGATCTT-3′ |
2.5. Immunohistochemistry
Anti-Islet1 antibodies 39.4D5 and 40.2D6 were purchased from the Developmental Studies Hybridoma Bank at the University of Iowa. Embryos were first used for in situ hybridization with TR2 RNA probe, then fixed with 4% paraformaldehyde, and incubated in the blocking buffer (1% bovine serum albumin, 0.1% Triton X-100, 0.05% dimethylsulfoxide and 2% goat serum in PBS) at 4°C for one hour. The blocking buffer was replaced with the anti-Islet antibody (1:500) diluted in the blocking buffer, and the incubation was continued at 4°C overnight. After washing three times with PBS-T (0.1% Triton X-100 in PBS) for 2 h, embryos were stained using an ABC labeling kit (Vector) according to the manufacturer’s instructions. Embryos were embedded in OCT and 10 μm frozen sections were prepared. Images were collected using Zeiss Axoplan2 microscope (Zeiss).
2.6. BAC DNA injections
BAC DNA (30 pg) containing full length olfm1b gene as well as 8 kb of the 5′-flanking and 85 kb of the 3′-flanking sequences was injected into 1 cell stage embryos. Whole mount in situ hybridization with TR3- or TR4-specific probes was performed 24 h after injection as described above.
Acknowledgments
We thank Dr. Reiko Toyama for her help with in situ hybridization protocol and Dr. Olof Sundin for critical reading of the manuscript. This study was supported by NEI intramural research program.
Footnotes
Publisher's Disclaimer: This is a PDF file of an unedited manuscript that has been accepted for publication. As a service to our customers we are providing this early version of the manuscript. The manuscript will undergo copyediting, typesetting, and review of the resulting proof before it is published in its final citable form. Please note that during the production process errors may be discovered which could affect the content, and all legal disclaimers that apply to the journal pertain.
References
- Appel B, Korzh V, Glasgow E, Thor S, Edlund T, Dawid IB, Eisen JS. Motoneuron fate specification revealed by patterned LIM homeobox gene expression in embryonic zebrafish. Development. 1995;121:4117–4125. doi: 10.1242/dev.121.12.4117. [DOI] [PubMed] [Google Scholar]
- Barembaum M, Moreno TA, LaBonne C, Sechrist J, Bronner-Fraser M. Noelin-1 is a secreted glycoprotein involved in generation of the neural crest. Nature Cell Biology. 2000;2:219–225. doi: 10.1038/35008643. [DOI] [PubMed] [Google Scholar]
- Cheng A, Arumugam TV, Liu D, Khatri RG, Mustafa K, Kwak S, Ling HP, Gonzales C, Xin O, Jo DG, Guo Z, Mark RJ, Mattson MP. Pancortin-2 interacts with WAVE1 and Bcl-xL in a mitochondria-associated protein complex that mediates ischemic neuronal death. J Neurosci. 2007;27:1519–1528. doi: 10.1523/JNEUROSCI.5154-06.2007. [DOI] [PMC free article] [PubMed] [Google Scholar]
- Danielson PE, Forss-Petter S, Battenberg EL, de Lecea L, Bloom FE, Sutcliffe JG. Four structurally distinct neuron-specific olfactomedin-related glycoproteins produced by differential promoter utilization and alternative mRNA splicing from a single gene. J Neurosci Res. 1994;38:468–478. doi: 10.1002/jnr.490380413. [DOI] [PubMed] [Google Scholar]
- Eshed Y, Feinberg K, Poliak S, Sabanay H, Sarig-Nadir O, Spiegel I, Bermingham JR, Jr, Peles E. Gliomedin mediates Schwann cell-axon interaction and the molecular assembly of the nodes of Ranvier. Neuron. 2005;47:215–229. doi: 10.1016/j.neuron.2005.06.026. [DOI] [PubMed] [Google Scholar]
- Hemish J, Nakaya N, Mittal V, Enikolopov G. Nitric oxide activates diverse signaling pathways to regulate gene expression. J Biol Chem. 2003;278:42321–42329. doi: 10.1074/jbc.M308192200. [DOI] [PubMed] [Google Scholar]
- Korzh V, Edlund T, Thor S. Zebrafish primary neurons initiate expression of the LIM homeodomain protein Isl-1 at the end of gastrulation. Development. 1993;118:417–425. doi: 10.1242/dev.118.2.417. [DOI] [PubMed] [Google Scholar]
- Liu W, Chen L, Zhu J, Rodgers GP. The glycoprotein hGC-1 binds to cadherin and lectins. Exp Cell Res. 2006;312:1785–1797. doi: 10.1016/j.yexcr.2006.02.011. [DOI] [PubMed] [Google Scholar]
- Moreno TA, Bronner-Fraser M. The secreted glycoprotein Noelin-1 promotes neurogenesis in Xenopus. Dev Biol. 2001;240:340–360. doi: 10.1006/dbio.2001.0472. [DOI] [PubMed] [Google Scholar]
- Moreno TA, Bronner-Fraser M. Neural expression of mouse Noelin-1/2 and comparison with other vertebrates. Mech Dev. 2002;119:121–125. doi: 10.1016/s0925-4773(02)00308-8. [DOI] [PubMed] [Google Scholar]
- Moreno TA, Bronner-Fraser M. Noelins modulate the timing of neuronal differentiation during development. Dev Biol. 2005;288:434–447. doi: 10.1016/j.ydbio.2005.09.050. [DOI] [PubMed] [Google Scholar]
- Nagano T, Nakamura A, Mori Y, Maeda M, Takami T, Shiosaka S, Takagi H, Sato M. Differentially expressed olfactomedin-related glycoproteins (Pancortins) in the brain. Brain Res Mol Brain Res. 1998;53:13–23. doi: 10.1016/s0169-328x(97)00271-4. [DOI] [PubMed] [Google Scholar]
- Schilling TF, Kimmel CB. Segment and cell type lineage restrictions during pharyngeal arch development in the zebrafish embryo. Development. 1994;120:483–494. doi: 10.1242/dev.120.3.483. [DOI] [PubMed] [Google Scholar]
- Snyder DA, Rivers AM, Yokoe H, Menco BP, Anholt RR. Olfactomedin: purification, characterization, and localization of a novel olfactory glycoprotein. Biochemistry. 1991;30:9143–9153. doi: 10.1021/bi00102a004. [DOI] [PubMed] [Google Scholar]
- Torrado M, Trivedi R, Zinovieva R, Karavanova I, Tomarev SI. Optimedin: a novel olfactomedin-related protein that interacts with myocilin. Hum Mol Genet. 2002;11:1291–1301. doi: 10.1093/hmg/11.11.1291. [DOI] [PubMed] [Google Scholar]
- Toyama R, O’Connell ML, Wright CV, Kuehn MR, Dawid IB. Nodal induces ectopic goosecoid and lim1 expression and axis duplication in zebrafish. Development. 1995;121:383–391. doi: 10.1242/dev.121.2.383. [DOI] [PubMed] [Google Scholar]
- Volynski KE, Silva JP, Lelianova VG, Atiqur RM, Hopkins C, Ushkaryov YA. Latrophilin fragments behave as independent proteins that associate and signal on binding of LTX(N4C) EMBO J. 2004;23:4423–4433. doi: 10.1038/sj.emboj.7600443. [DOI] [PMC free article] [PubMed] [Google Scholar]
- Westerfield M. A guide for the laboratory use of zebrafish (Danio rerio) 4. Eugene: University of Oregon Press; 2000. The zebrafish book. [Google Scholar]
- Wilson L, Maden M. The mechanisms of dorsoventral patterning in the vertebrate neural tube. Dev Biol. 2005;282:1–13. doi: 10.1016/j.ydbio.2005.02.027. [DOI] [PubMed] [Google Scholar]
- Zeng LC, Han ZG, Ma WJ. Elucidation of subfamily segregation and intramolecular coevolution of the olfactomedin-like proteins by comprehensive phylogenetic analysis and gene expression pattern assessment. FEBS Lett. 2005;579:5443–5453. doi: 10.1016/j.febslet.2005.08.064. [DOI] [PubMed] [Google Scholar]