

Abstract
The firing patterns of visual neurons tracking approaching objects need to be translated into appropriate motor activation sequences to generate escape behaviors. Locusts possess an identified neuron highly sensitive to approaching objects (looming stimuli), thought to play an important role in collision avoidance through its motor projections. To study how the activity of this neuron relates to escape behaviors, we monitored jumps evoked by looming stimuli in freely behaving animals. By comparing electrophysiological and high-speed video recordings, we found that the initial preparatory phase of jumps occurs on average during the rising phase of the firing rate of the looming-sensitive neuron. The coactivation period of leg flexors and extensors, which is used to store the energy required for the jump, coincides with the timing of the peak firing rate of the neuron. The final preparatory phase occurs after the peak and takeoff happens when the firing rate of the looming-sensitive neuron has decayed to <10% of its peak. Both the initial and the final preparatory phases and takeoff are triggered when the approaching object crosses successive threshold angular sizes on the animal's retina. Our results therefore suggest that distinct phases of the firing patterns of individual sensory neurons may actively contribute to distinct phases of complex, multistage motor behaviors.
Keywords: locust, DCMD, jump escapes, sensorimotor transformation, high speed video, electrophysiology
Introduction
The initiation of appropriately timed escape behaviors in response to impending threats is critical for survival. Some animals have evolved fast motor circuits devoted to the generation of such behaviors, such as the giant fiber system in flies, the Mauthner cell in fish, or the lateral giant neurons of crayfish (Wyman et al., 1984; Edwards et al., 1999; Korn and Faber, 2005). Although much is known in these and in other systems about how escape behaviors are generated in response to abrupt stimuli such as mechanical disturbances, air puffs, or light flashes (Levi and Camhi, 2000; Fayyazuddin et al., 2006; Bhatt et al., 2007), we still know very little about how escape behaviors are generated in response to objects approaching on a collision course, as may be expected from potential predators (Yamamoto et al., 2003; Preuss et al., 2006; Santer et al., 2006; Oliva et al., 2007; Hammond and O'Shea, 2007).
In this context, locusts offer an excellent opportunity to study the transformations leading from the activity of visual neurons tracking approaching objects to the motor phases of a multistage escape behavior. On the sensory side, each optic lobe of the locust brain contains an identified neuron called the lobula giant movement detector (LGMD) that is strongly activated by objects approaching on a collision course or their two-dimensional projections (looming stimuli) (Schlotterer, 1977; Rind and Simmons, 1992; Hatsopoulos et al., 1995). The spikes of the LGMD are conveyed one-to-one to the descending contralateral movement detector neuron (DCMD) (O'Shea and Williams, 1974; Rind, 1984; Killmann and Schürmann, 1985) that projects to motor centers responsible for the generation of jumps and flight steering (Burrows and Rowell, 1973; O'Shea et al., 1974; Simmons, 1980). Because the axon of the DCMD is fast conducting, its activity reaches motor centers considerably earlier than most other neural signals. Thus, the LGMD and DCMD have been long thought to be involved in the generation of fast escape behaviors. The responses of the LGMD/DCMD to approaching objects have been studied in detail (Judge and Rind, 1997; Gabbiani et al., 1999, 2001; Matheson et al., 2004; Guest and Gray, 2006). During approach on a collision course, the firing rate increases, peaks, and then decays near the end of approach. The peak rate occurs a fixed delay after the approaching object has reached an angular threshold size on the retina. An angular threshold is also associated with the firing rate exceeding a given value (50 spikes/s), suggesting that different angular threshold sizes may be used to initiate various aspects of escape behaviors (Robertson and Johnson, 1993; Gabbiani et al., 2002).
On the motor side, the circuit involved in the generation of jumps has also been extensively characterized (Burrows, 1996, his Chapter 9). Several motor neurons and interneurons involved in this behavior receive excitatory synaptic inputs from the DCMD (Burrows and Rowell, 1973, O'Shea et al., 1974, Pearson et al., 1980, Pearson and Robertson, 1981). The peak acceleration developed by a locust during hindleg extension, ∼18 g, requires ∼10 times more energy than could be delivered by the muscles (Bennet-Clark, 1975). The jump program, therefore, consists of multiple phases used to store the energy needed for takeoff in elastic elements of the hindleg (Heitler, 1974; Heitler and Burrows, 1977; Burrows, 1995; Burrows and Morris, 2001). These phases have been best described for defensive kicks, whose motor program is similar to that of the jump. The initial flexion phase brings each femur close to the tibia. During the following cocking phase, the tibiae become fully flexed. This phase is associated with activity in the tibiae flexor muscles. Next, comes a co-contraction phase during which both flexors and extensors are simultaneously active. Most of the energy required for the jump is stored during this phase. The jump is triggered when the activity of the flexors ceases, allowing the extensors to develop their movement and the stored energy to be released. Moreover, the front legs are known to influence the direction of the jump (Santer et al., 2005).
Despite the fact that the LGMD/DCMD neurons have been thought to be involved in the generation of escape behaviors for more than 30 years (Burrows and Rowell, 1973), it still remains unclear how their activity relates to the different phases of the jump. To investigate this issue, we designed an apparatus that allowed eliciting jumps to looming stimuli in unrestrained animals. We could thus study the relationship between jump phases and various aspects of looming stimuli under highly reproducible conditions, using high-speed video, nerve, and muscle recordings. We determined how the firing of the DCMD neuron relates to the motor activity evoked in the muscles and the resulting phases of escape jumps. Our results indicate that successive jump phases are initiated as the angular size of the looming stimulus crosses successive thresholds on the animal's retina. We also found that each phase of the DCMD firing pattern can be associated with a distinct preparatory phase of escape jumps. This led us to a model summarizing the role that the DCMD may play during escape jumps, based on its anatomical connections and the biophysics of the jump.
Materials and Methods
Visual stimulation.
Dark discs of half-size (radius), l, and constant speed, v, approaching on a collision course were simulated on a computer screen (looming stimuli). The monitor refresh rate was 200 frames per second (fps), well above the temporal cutoff frequency of locust photoreceptors (<80 Hz) (Howard et al., 1984), and was calibrated linearly between black (foreground, 7.6 cd/m2) and white (background, 87.5 cd/m2). Because visual stimulation was monocular, the time course of the angular size, θ(t), subtended by the approaching object on the retina fully characterizes the stimulus and is a function of the half-size to speed ratio (l/|v|): θ(t) = 2 × tan−1 [l/(v × t)] (v < 0 for approaching stimuli, t < 0 before collision) (Fig. 1A) (Gabbiani et al., 1999). Looming stimuli had l/|v| values between 5 and 120 ms, corresponding to approach sequences with total durations between 0.24 and 5.88 s. The physical radius (r) of the stimulus on the computer screen (in pixels) at each frame was calculated as r = p × d × (l/v)/t, where d is the distance of the eye to the screen, p is the monitor resolution (16.5 pixels/cm), and the value of t is the time for that frame relative to projected collision. The locust eye distance to the screen, which could vary by as much as 2 cm from trial to trial (ranging between 5 and 7 cm), was read from a scale and input to the stimulation program immediately before each trial (with 0.5 cm precision). The stimulus sequence was then generated on the fly based on the distance entered to the program. This distance remained constant during approach because the locust did not move away or toward the screen before takeoff. Initial and final radii were preset to 2 and 220 pixels (subtending on average 2–3° and 125–140° on the retina, respectively). Because the stimulus radius (r in pixels) could assume non-integer values at a given frame, an anti-aliasing method was used to generate disks with effective non-integer radius values. According to this method, the stimulus consisted of a small disc overlaid on a larger disc. The small disc radius was equal to the integer part of the desired radius, and the larger disc radius was one pixel greater, creating a sharp edge. The smaller disk was black, and the gray level of the larger disk was such that the luminance of the two discs matched that of a black disc with the non-integer radius.
Figure 1.
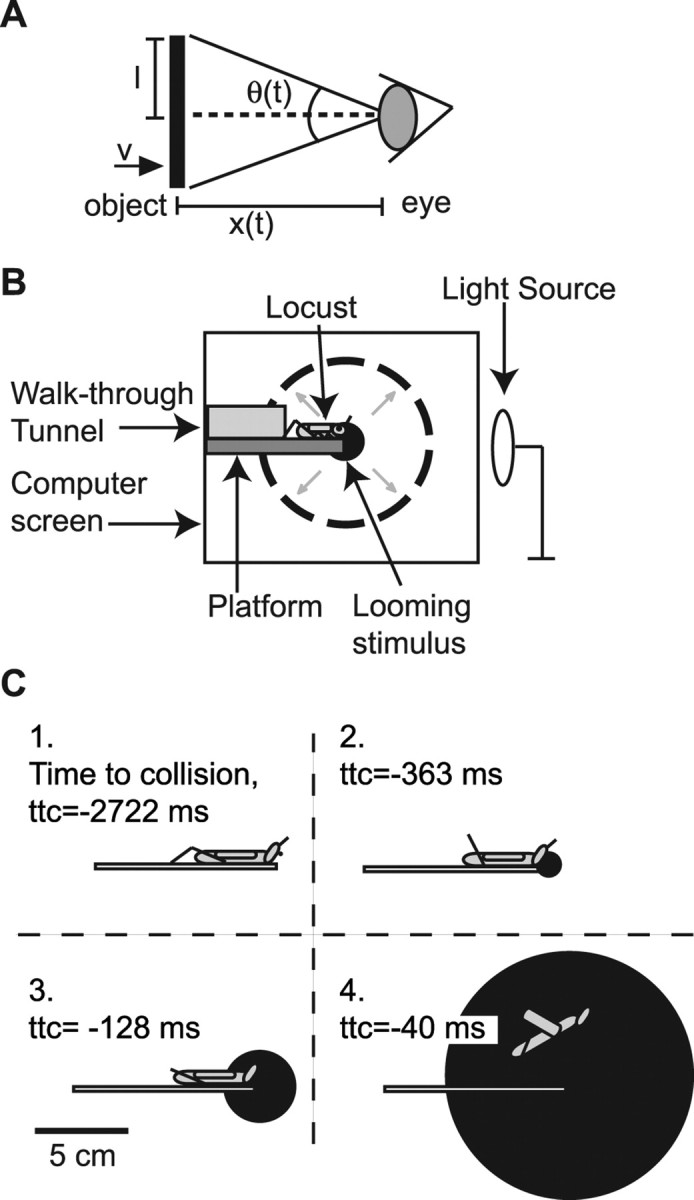
Schematics of a looming stimulus and the experimental arrangement. A, For monocular stimulation, the time course of the angular size subtended at the eye by a disc of radius l approaching at speed v is a function of the l/|v| ratio: θ(t) = 2 × tan−1 l/(v × t). B, For behavioral experiments, locusts were placed at the entrance of a tunnel and walked through it onto a platform 2 cm wide extending in front of and parallel to the computer screen used for visual stimulation. The platform ended in front of the center of the screen so that locusts could not walk any farther, thus aligning the locust eye with the center of the looming stimulus. A light source placed at the opposite end of the platform induced walking in that direction. C, Drawing of four frames of a looming stimulus with l/|v| = 60 ms. Frame 1 corresponds to the first stimulus frame. Frames 2 and 3 correspond to the average timing of the first two jump preparatory stages described in Results (IJM and FJM), and the last frame corresponds to the average timing of takeoff [time to collision (ttc), negative before takeoff; SDs for IJM, FJM, and takeoff of 153, 56, and 42 ms, respectively].
To test the effect of overall luminance changes on jump responses, black squares approaching on a white background (overall screen luminance decreasing over time) and black and white checkerboard squares approaching on a gray background were presented (4 × 4 checkerboard; fixed overall screen luminance). The squares were characterized by their half-size, l, and approach speed, v, as described above. Anti-aliasing was not used for these stimuli. The luminance of white, gray, and black were 87.5, 47.4, and 7.6 cd/m2, respectively. Transistor–transistor logic (TTL) pulses were generated at each frame by the stimulation program and were used to synchronize stimulus presentation with data acquisition. All stimulation programs were written in C using the MGL graphics library (SciTech Software, Chico, CA) on a personal computer (PC) running the QNX 4 operating system (QNX Software Systems, Ottawa, Ontario, Canada).
Behavioral experiments.
Experiments were performed on adult locusts (Schistocerca americana) 3 weeks after their final molt. Locusts were taken from our crowded laboratory colony, reared under a 12 h light/dark cycle, with temperatures ranging between 32 and 25°C. Because the animals were raised under crowded conditions, they were in “gregarious” phase (Sword, 2003, Rogers et al., 2007). The animals were placed in front of a 14-cm-long tunnel and walked through the tunnel onto a 10-cm-long, 2-cm-wide platform mounted parallel to and along the center of the computer screen, with its proximal edge at a distance of 5 cm (Fig. 1B). Once an animal reached the end of the platform in front of the screen, it was presented with a looming stimulus. The platform was narrow enough that the animal was restricted to have one eye parallel to the screen. Furthermore, no head movements were observed during stimulus approach, resulting in stable, monocular stimulation. The behavior was filmed using a high-speed video camera (see below, Video recordings). Figure 1C shows drawings of four frames of a looming stimulus with l/|v| = 60 ms at various times during its presentation. Frame 1 corresponds to the first stimulus frame. Frames 2–4 depict the size of the stimulus at the average timing of the two jump preparatory phases [initial (IJM) and final (FJM) joint movement] (see Results) and takeoff, respectively. To avoid habituation of the escape behavior (Yamamoto et al., 2003), at least 5 min separated successive trials, and each animal was tested for no more than 10 trials per day. Preliminary experiments showed that jump probability decreased with decreasing room temperature (Abrams and Pearson, 1982). We therefore did all experiments at 80–85°F (26.7–29.4°C). At the beginning of an experiment, an initial set of animals were tested. If over three consecutive trials an animal did not jump in response to looming stimuli and/or did not remain stationary at the end of the platform before stimulus presentation, it was removed from the set. All data presented in Results are from the remaining set of animals (∼50% of the initial set), which were then used for data collection across multiple trials. There were trials in which selected locusts did not jump. These trials along with the jump trials are used to calculate the jump probabilities (see Fig. 2A). In ∼90% of the no-jump trials, the locusts reacted to looming stimuli by flexing their hindlegs as if they were preparing to jump. In the remaining no-jump trials (∼10%), no movement of the hindlegs was observed. Five experimental datasets, abbreviated ES0–ES4, are presented here, as described below. We performed the experiments described in ES0 to characterize the range of l/|v| values that resulted in jumps occurring before expected collision. Based on these experiments, we selected the range of l/|v| values used in ES1–ES3.
Figure 2.
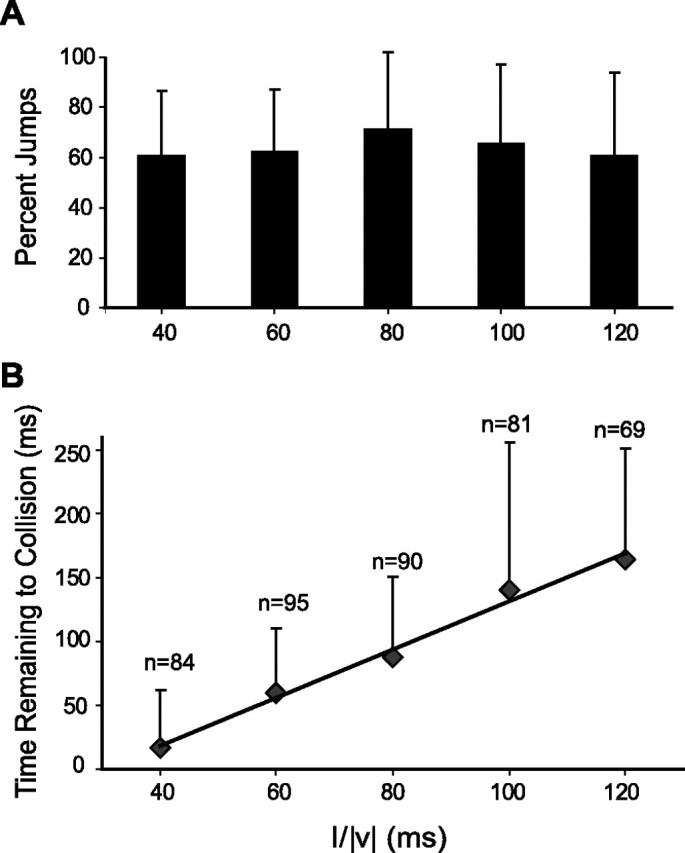
Probability and timing of locust jump as a function of l/|v|. A, Percentage of trials that resulted in jumps. The percentage of jumps did not change significantly with l/|v| (error bars show SDs; pKWT = 0.8). B, Mean timing of takeoff and SD relative to expected collision (time remaining to collision positive before expected collision). Thirteen locusts were presented looming stimuli at l/|v| = 40, 60, 80, 100, and 120 ms (n indicates number of jumps recorded across all animals, ES1). Linear fit slope, 1.9; intercept, −57 ms (SE of 0.1 and 11 ms).
Experimental set 0.
In a first set of experiments, we tested looming stimuli having l/|v| values equal to 10, 30, 80, and 100 ms to determine the range of values that resulted in jump takeoffs before expected collision (n = 5, 8, 11, and 8 animals, respectively). Two locusts were tested at all four l/|v| values. The others were tested at three l/|v| values or less.
Experimental set 1.
We measured the timing of different phases of escape jumps elicited by looming stimuli with l/|v| values from 40 to 120 ms using steps of 20 ms in 13 animals. All animals were tested with all l/|v| values (n = 13 mean number of trials per animal per l/|v|). We recorded the activity of the nerve cord in seven of these animals (l/|v| = 40–120 ms) (see Fig. 7).
Figure 7.
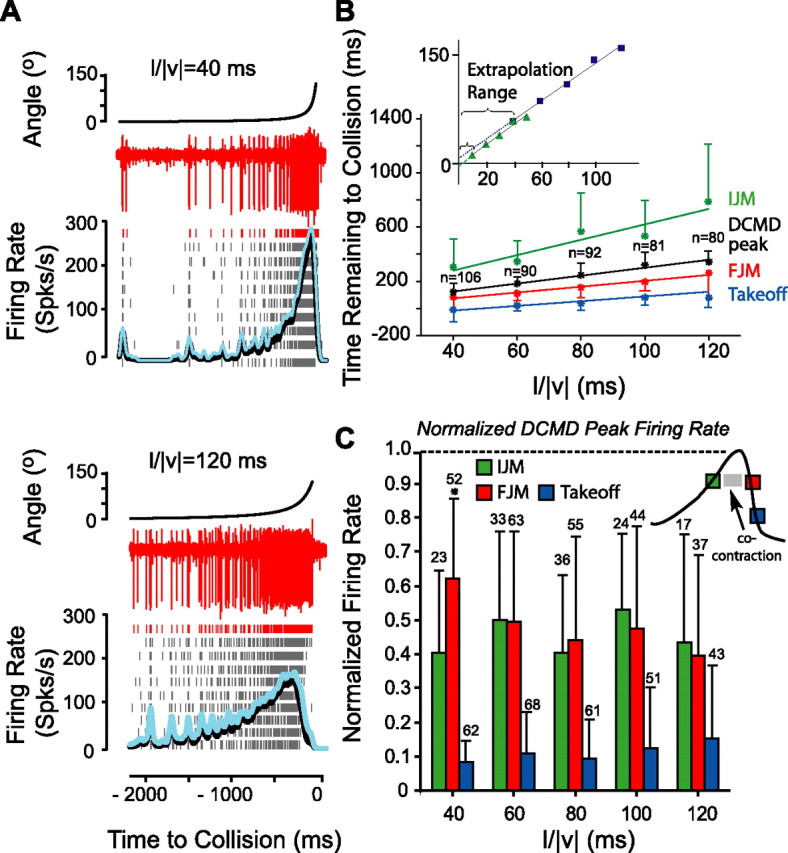
Comparison of the timing of IJM, FJM, and takeoff with that of the DCMD peak. A, Nerve cord/DCMD activity in response to looming stimuli with l/|v| = 40 and 120 ms obtained from one locust. The red traces show extracellular nerve cord recordings. Raster plots show the DCMD spikes detected from extracellular nerve cord activity in response to 10 presentations of the stimuli. The average DCMD firing rate and its SD are shown in black and blue. B, Timing of the IJM (green), FJM (red), takeoff (blue), and the DCMD peak (black) in seven locusts. Mean and SDs are shown (n indicates number of trials for the DCMD recordings; same number of IJM, FJM, and takeoff trials as in C). The DCMD peak occurred after the IJM and before the FJM and takeoff for all l/|v| values. The correlation with l/|v|, the slopes, and intercepts of the lines fit to the timing of IJM, FJM, takeoff, and the DCMD peak were as follows (mean ± SE): IJM slope, 5.7 ± 0.8 and intercept, 69 ± 72 ms (ρ = 0.5); FJM slope, 2.2 ± 0.2 and intercept, 5 ± 20 ms (ρ = 0.5); takeoff slope, 1.7 ± 0.2 and intercept, −68 ± 15 ms (ρ = 0.5); peak slope, 2.9 ± 0.1 and intercept, 26 ± 9 ms (ρ = 0.8). The inset shows the extent of extrapolation from the closest data point to the fit line intercept for small and large l/|v| ranges. C, The normalized DCMD firing rate at the time of IJM, FJM, and takeoff. Error bars show SDs. On average the firing rate at the time of takeoff was <10% of the peak value (data from ES1). The inset is a schematic of the DCMD firing rate profile and the relative timings of IJM, co-contraction, FJM, and takeoff derived from the main panel (duration of the events are not to scale).
Experimental set 2.
We implanted electrodes in the hindleg flexor and extensor muscles of eight animals (see below, Electrophysiology) and presented them looming stimuli with l/|v| values of 40, 80, and 120 ms (see Figs. 4, 5). Thin, long wires were used for muscle recordings so that the animals could still jump freely (supplemental video 2, available at www.jneurosci.org as supplemental material). Each animal was tested an average of six trials per l/|v| value.
Figure 4.

Phases of locust jump behavior. A, Four frames taken from a video recording of an escape jump at l/|v| = 40 ms (supplemental video 2, available at www.jneurosci.org as supplemental material). The position of the femur–tibia joint was tracked frame by frame (green and red crosses) and used to calculate the pixel movement of the joint. The time to collision (ttc) and cumulative joint movement for frames I–IV were as follows, respectively: −285 ms, 0 pixels; −95 ms, 16 pixels; −65 ms, 23 pixels; and −15 ms, 69 pixels. One pixel corresponds to 0.1 mm in this example. B, Muscle recordings from the same trial shown in A. The black bottom traces show the flexor and extensor muscle activities. The stimulus angular size is shown on top. The cumulative joint movement in pixels is shown directly below. The three segments in black, green, and red correspond to periods of no movement, IJM, and FJM. Takeoff was defined as when the tarsi left the platform and is marked with the blue vertical dashed line. In this example, the start of IJM, FJM, and takeoff occurred 305, 85, and 15 ms before expected collision, respectively (data from ES2).
Figure 5.
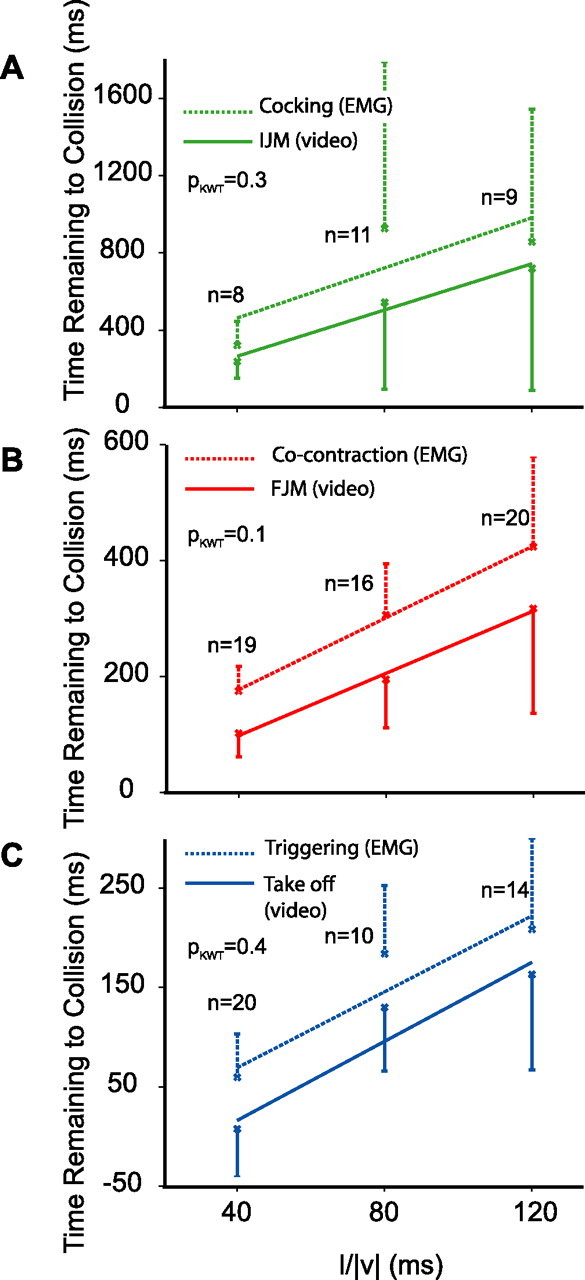
Comparison of the timing of different behavioral phases and muscle activity obtained from video and muscle recordings. A, Timing of the IJM obtained from the video recordings (solid green) and of cocking obtained from flexor muscle recordings (dashed green). IJM slope (mean ± SE), 5.9 ± 2.7; and intercept, 26 ± 239 ms (ρ = 0.4). Cocking slope (mean ± SE), 6.5 ± 4.1; and intercept, 203 ± 359 ms (ρ = 0.3). The average delay between the IJM and cocking was 95 ms. B, Timing of the FJM (solid red, video) and co-contraction (dashed red, extensor muscle activity). FJM slope (mean ± SE), 2.7 ± 0.5; and intercept, −10 ± 42 ms (ρ = 0.6). Co-contraction slope (mean ± SE), 3.1 ± 0.4; and intercept, 53 ± 37 ms (ρ = 0.7). The average delay between the FJM and co-contraction was 103 ms. C, Timing of takeoff (solid blue, video) and triggering (dashed blue, flexor muscle activity). Takeoff slope (mean ± SE), 2.0 ± 0.3; and intercept, −63 ± 25 ms (ρ = 0.7). Triggering slope (mean ± SE), 1.9 ± 0.3; and intercept, −7 ± 25 ms (ρ = 0.7). The average delay between takeoff and triggering was 49 ms. The delay between the timing of the three behavioral and muscle activity phases did not change significantly with l/|v| (KWT, pKWT values on figure; ES2, data from both jump and no jump trials).
Experimental set 3.
We presented looming stimuli with fixed overall luminance (black and white checkerboard squares on gray background, with the overall luminance equal to that of the background, 47.4 cd/m2) and decreasing luminance during approach (black squares on white background). The two types of stimuli were interleaved and had l/|v| values of 40, 80, and 120 ms. Ten trials per stimulus condition and l/|v| value were performed in eight animals.
Experimental set 4.
To compare the timing of DCMD peak activity in response to looming stimuli with l/|v| values in the range of 40–120 ms (as mainly used here) (see Results) and the typical range used in previous studies (5–50 ms) (Gabbiani et al., 1999), we measured the nerve cord activity in 13 animals using l/|v| values from 5 to 120 ms. Eight animals were tested at l/|v| = 5, 10, 20, 30, 40, 60, 80, 100, and 120 ms and the other five at l/|v| = 10, 20, 30, 40, 50, 60, 80, 100, and 120 ms. Data were pooled across all 13 animals for the final analysis.
Video recordings.
A high-speed digital video camera (IPX-VGA210; Imperx, Boca Raton, FL), equipped with a zoom lens (LIMZ50M; Kowa Company, Torrance, CA) was used to record escape jumps. The video recordings were obtained at either 100 or 400 fps. For recordings at 100 fps, acquisition of each frame was triggered by alternate frames generated by the stimulation computer. At 400 fps, the first video frame was synchronized with the start of stimulus, and the camera operated in free-running mode from then on. A comparison of recordings obtained under these two conditions showed that 100 fps gave us enough resolution to detect distinct jump preparatory phases. The sampling interval corresponding to 100 fps (10 ms) was less than half of the typical SD of behavioral parameters extracted from the data. All the experimental sets presented here were thus recorded at 100 fps, except for ES3, which was recorded at 400 fps (see Fig. 6). Frame-by-frame analysis of a total of 475 movies recorded at 100 fps and 160 movies recorded at 400 fps are presented in this paper. The average duration of the movies was 1.9 and 5.9 s for l/|v| = 40 and 120 ms, respectively.
Figure 6.
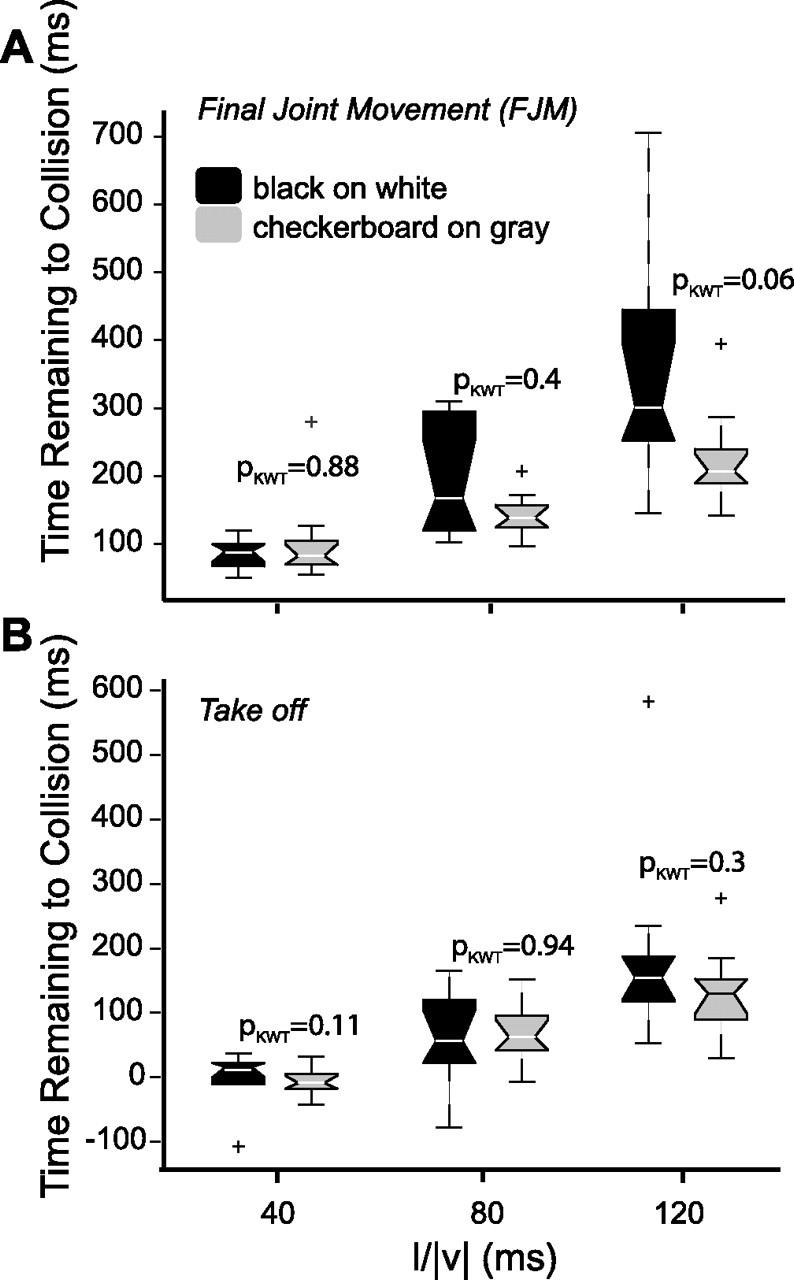
Effect of screen luminance on the timing of jumps. Timing of the FJM (A) and takeoff (B) in response to black squares looming on a white background (black symbols) and checkerboard black and white squares looming on a gray background (gray), obtained from eight locusts (ES3). The notched box plots show the lower quartile, the median, and the upper quartile values. The whiskers, i.e., the lines extending from the end of the boxes show the extent of the rest of the data. Outliers are shown with +. The pKWT values from the KWT are shown on the figure.
Electrophysiology.
Extracellular recording electrodes were made using 50 μm Teflon-coated stainless steel wires with the coating removed at the point of contact with the recording site (California Fine Wire, Grover Beach, CA). For nerve cord recordings in fixed animals, a hook electrode was implanted around the thoracic nerve cord contralateral to the stimulated eye, ventrally between the prothoracic and mesothoracic ganglia. The animals were then fixed at the end of the platform dorsal side up. During the recordings, stimuli were separated by a 45 s intertrial interval (ES1 and ES4). Because habituation was negligible during these experiments (see Fig. 7A), no other measure was taken to prevent it. Signals were amplified differentially (10,000 times) with respect to a ground electrode placed in the body and bandpass filtered between 100 Hz and 10 kHz cutoffs. For extracellular muscle recordings in behaving animals (ES2), one electrode was inserted dorsally from the outside in segment b of the extensor muscle (Hoyle, 1978), and another electrode was inserted in the flexor muscle proximal to the femur–tibia joint. Both electrodes were implanted in the hindleg contralateral to the stimulated eye and fixed in place using bee's wax. Signals were then amplified differentially with respect to the reference electrode (1000 times) and bandpass filtered between 300 Hz and 5 kHz. In all recordings, the ground and reference electrodes were placed in the body.
Timing of jump phases.
Video recordings were analyzed using custom Matlab software (MathWorks, Natick, MA). In some trials, the tibia was not flexed at the onset of visual stimulation and an early flexion was observed that led to the partial flexion of the tibia (see Results). Starting from the partially flexed position, we tracked the position of the femur–tibia joint frame by frame. The IJM was defined as the time point when the joint moved more than one pixel between two successive video frames. The IJM was typically followed by a pause or slowing of the movement. We defined the start of the FJM, immediately preceding takeoff, by the time when the joint moved more than one pixel across two successive frames after the pause or slow down. Takeoff was defined as the time when the tarsi left the platform. A pixel corresponded to 0.1–0.5 mm of physical movement and could vary as a result of changes in the magnification level on the zoom lens used in different experimental sessions. For the analysis presented in Figure 3, the correlation coefficient between different stimulus variables and l/|v| at different delays before takeoff was calculated. For each trial and l/|v| value, only delays at which the stimulus had not yet stopped its approach were used. The number of such trials increased with increasing delays before takeoff and included all trials for delays >155 ms. At takeoff time, at least 53 trials were included for each l/|v| value.
Figure 3.
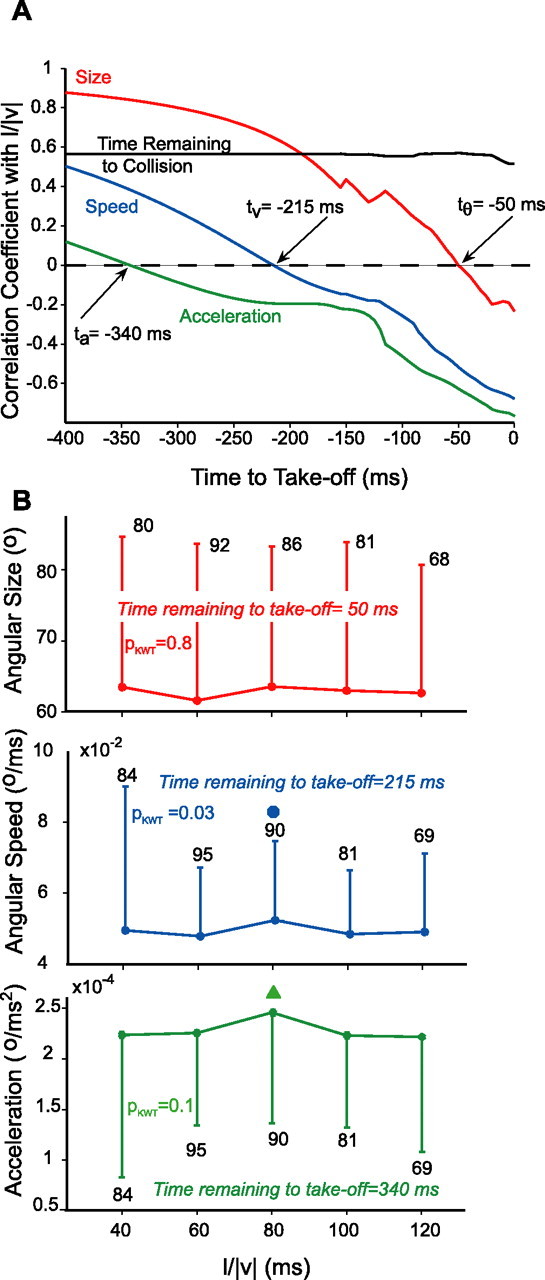
Correlation between stimulus l/|v| and four kinematic variables as a function of time. Thirteen locusts were presented with looming stimuli at l/|v| = 40, 60, 80, and 120 ms (total number of trials: 84, 95, 90, 81, and 69; mean number of trials per l/|v| value and per locust: 6, 7, 7, 6, and 5; ES1). A, Correlation coefficients between l/|v| and instantaneous angular size, speed, acceleration, and time to collision were computed in 5 ms steps (time to takeoff negative before takeoff). Correlation coefficients were calculated only at delays before takeoff for which the stimulus was still looming. Angular size, speed, and acceleration showed zero correlation with l/|v| at 50, 215, and 340 ms before takeoff, respectively. B, Angular size (red; n is the number of trials for which the stimulus was still looming 50 ms before takeoff), speed (blue), and acceleration (green) 50, 215, and 340 ms before takeoff, respectively. The angular size of the stimulus was not significantly changing with l/|v| (pKWT = 0.8). The angular speed of the stimulus was significantly changing (pKWT–HSD = 0.03; ● marks significant difference at pKWT–HSD = 0.05). The change in angular acceleration was only significant for pKWT–HSD = 0.1 (▲ marks difference at pKWT–HSD = 0.1). However, angular acceleration is unlikely to be used as a cue for takeoff because it occurs before the earliest preparatory phase described in Figures 5 and 7 (see Discussion).
Analysis of electrophysiological data.
The extracellular recordings and the TTL pulses generated by the stimulation computer were sampled at 20 kHz using an analog-to-digital converter board controlled by a PC running QNX 6 (POWERDAQ, PD2-MF-16-500/16H; United Electronic Industries, Canton, MA). The data were analyzed using Matlab. The DCMD spikes were detected from the nerve cord recordings using a threshold filter. Locking of DCMD spikes to the timing of stimulus update could sometimes be observed early during the trials (see Fig. 7A) but did not affect the results (for a detailed discussion, see Gabbiani et al., 1999). We estimated the instantaneous firing rate by convolving the spike trains with a Gaussian window (width, σ = 20 ms) and normalizing the resulting waveform such that its integral was equal to the total number of spikes over the whole trial. The peak of the firing rate was then found for each trial, and the average and SDs were calculated across trials with the same l/|v| value. The muscle potentials were analyzed to find the timing of the start and end of flexor and extensor muscle activities before takeoff. For seven locusts in ES1, both behavior and electrophysiological data were available. For each locust and l/|v| value, we calculated the difference between the average timing of the DCMD peak firing rate and that of different behavior phases obtained from previous experiments. Table 1 shows an estimate of the mean firing rate at the time of each behavioral stage (IJM, FJM, and takeoff) in relation to the mean peak DCMD firing rate and their variabilities. The estimate for a given behavior stage was obtained by first finding its time of occurrence in each of the njump behavioral trials. The firing rate of the DCMD was then determined in each of the nDCMD recordings at these times. The resulting njump × nDCMD firing rate values were then averaged to obtain means and SDs (typically, njump = 6 and nDCMD = 10). To compute an estimate of the average normalized DCMD firing rate and its variability at the time of a previously recorded behavior phase (see Fig. 7C), we applied the same procedure except that we first normalized the DCMD firing rate to its peak for each trial and pooled all values across animals before averaging.
Table 1.
Examples of DCMD firing rates at the time of IJM, DCMD peak, FJM, and takeoff
| l/|v| (ms) | IJM (spikes/s) | DCMD peak (spikes/s) | FJM (spikes/s) | Takeoff (spikes/s) |
|---|---|---|---|---|
| Locust 1 | ||||
| 40 | 64 ± 52 *** | 202 ± 17 | 133 ± 65*** | 21 ± 15*** |
| 80 | 80 ± 35*** | 162 ± 18 | 76 ± 53*** | 7 ± 14*** |
| 120 | 35 ± 12*** | 147 ± 13 | 75 ± 49** | 14 ± 19*** |
| Locust 2 | ||||
| 40 | 48 ± 28*** | 124 ± 32 | 68 ± 40*** | 9 ± 16*** |
| 80 | 38 ± 30*** | 125 ± 25 | 43 ± 50*** | 3 ± 11*** |
| 120 | 87 ± 36* | 122 ± 8 | 46 ± 35** | 8 ± 15*** |
| Locust 3 | ||||
| 40 | 157 ± 62* | 224 ± 15 | 152 ± 77* | 32 ± 28*** |
| 80 | 80 ± 53*** | 181 ± 35 | 106 ± 54*** | 39 ± 45*** |
| 120 | 67 ± 39** | 128 ± 29 | 38 ± 41*** | 24 ± 33*** |
For each locust, the firing rate was calculated from separate nerve cord recordings at the average time of each behavioral phase (see Materials and Methods, Analysis of electrophysiological data). Mean and SD of the firing rates are shown for three l/|v| values. The IJM is always followed by DCMD peak, FJM, and takeoff in sequence. Asterisks indicate significance level for differences in firing rates at the time of IJM, FJM, and takeoff compared with DCMD peak firing rate (*pKWT < 0.01; **pKWT < 0.001; ***pKWT < 0.0001).
Statistical analysis.
The Kruskal–Wallis test (KWT) was used to compare the medians of populations across different treatments. Unless otherwise stated, the p values presented on the figures and in the results are derived from the KWT (pKWT). When no significant difference was detected, we report average values pooled across treatments. When a significant difference was found, multiple comparisons between pairs of medians were performed using Tukey's honestly significant difference criterion. We abbreviate this analysis by KWT–HSD (pKWT–HSD). The p value was set to 0.05 for multiple comparisons (except in the bottom panel of Fig. 3B, in which p = 0.1). Least squares linear regression was used to fit lines to the timing of the DCMD peak firing, as well as the start points of the different behavioral and muscle activity phases as a function of l/|v|. The variability of linear fit slopes and intercepts and the variables derived from them was quantified by SEs as described by Moore and McCabe (2006). Variability in data are otherwise quantified by SD. To compare the slopes and intercepts of the linear fits, the KWT (nonparametric statistics), as well as an analysis of covariance (ANCOVA) (parametric statistics) with multiple comparisons were used. The results obtained with these two methods were similar, and thus only the KWT statistics are reported. The Pearson's correlation coefficient is denoted by ρ throughout.
Results
Looming stimuli evoke jumps under precisely reproducible conditions
Our first goal was to design an experimental arrangement and behavioral paradigm eliciting escape responses in freely behaving locusts under highly reproducible conditions. We used a fast monitor screen to simulate the approach of dark discs or squares on a light background (looming stimuli) (Fig. 1A). Because the stimuli were presented monocularly, they were fully characterized by the time course of the angle subtended by the object at the retina. This angle depends, in turn, on the ratio of the half-size and constant speed of approach (l/|v|; see Materials and Methods, Visual stimulation). The experimental setup is shown in Figure 1B and consisted of a narrow platform positioned parallel to the monitor screen passing through a tunnel. The animals were placed at the entrance of the tunnel on the left side of the screen. The tunnel forced the animals to stay on the platform and thus helped minimize premature jumps. Locusts, like flies or bees, show strong phototaxis. We thus placed a light source on the right side of the screen opposite to the tunnel to illuminate the central part of the platform and persuade them to walk out toward the light (Fig. 1B). After exiting the tunnel, the animals walked on the narrow platform that ended in front of the center of the screen, forcing them to stop. Although in some trials the animals immediately jumped away (∼10%), most remained stationary at the edge of the platform. In these trials, we presented them with looming discs and recorded their behavior simultaneously (see Materials and Methods, Visual stimulation and Video recordings) (for stimulus illustration, see Fig. 1C). The jump probability did not significantly change in the l/|v| range tested and had an average value of 64% (Kruskal–Wallis test, pKWT = 0.8; 40–120 ms) (Fig. 2A). When the animals jumped away, we defined the timing of takeoff as the first frame on which the tarsi lost contact with the platform. A plot of takeoff times as a function of l/|v| revealed that takeoff occurred closer to collision time for smaller l/|v| values (Fig. 2B). In fact, experiments performed with looming stimuli having l/|v| values smaller than 40 ms resulted in jumps occurring after the expected collision (mean ± SD time remaining to collision, −66 ± 15 and −34 ± 23 ms for l/|v| = 10 and 30 ms, respectively, ES0). Thus, fast or small approaching objects are more likely to elicit failures to escape before collision than slower or larger ones. We concentrated our subsequent analysis on stimuli that evoked “successful” escape jumps, that is, those occurring on average before projected collision (l/|v| = 40–120 ms).
Stimulus angular size is constant a fixed delay before takeoff
As illustrated in Figure 2B, l/|v| and takeoff time were highly correlated (ρ = 0.6, ES1). We thus fitted takeoff time as a function of l/|v| by least squares, obtaining a line with slope equal to 1.9 and an intercept of −57 ms (SEs of 0.1 and 11 ms; 13 locusts, ES1). It has been shown previously that such a linear relationship occurs if and only if takeoff takes place with a fixed offset relative to the time the stimulus has reached a fixed angular threshold size on the retina, regardless of l/|v| (Gabbiani et al., 1999, their Appendix 1). The threshold angular size and the corresponding delay can be computed from the slope and intercept of the linear fit: they are equal to 2 × tan−1(1/slope) and (−1) × intercept, respectively. Thus, takeoff occurred on average 57 ms after the stimulus reached an average ± SE angular size of 55.5 ± 2.6°.
Is threshold angular size the kinematic variable best related to takeoff time? The above-mentioned calculations cannot directly address this question because they assume from the outset that the relationship between the timing of takeoff and l/|v| is linear. We thus looked for a more general method to test whether angular size or any other kinematic stimulus variable was equal to a constant threshold independent of l/|v| at a fixed processing delay before takeoff. A necessary condition for angular size to be constant at a certain delay before takeoff is that its correlation coefficient with l/|v| be zero at that delay. Therefore, we systematically computed the correlation coefficient between angular size and l/|v| as a function of time before takeoff (Fig. 3A, red curve). In the case of angular size, this correlation coefficient was zero 50 ms before takeoff. However, a vanishing correlation coefficient is only a necessary condition because angular sizes could significantly vary, without showing a consistent trend with l/|v|. We thus verified that angular size did not significantly change with l/|v| at that time (pKWT = 0.8; mean ± SD, 62.8 ± 20.3°) (Fig. 3B, red curve). This suggests that animals take off ∼50 ms after an average threshold angular size of 62.8° is reached on the retina, a result in close agreement to that obtained from the linear fit described above (57 ms and 55.5°).
In addition to stimulus angular size, we studied angular speed, acceleration, and remaining time to collision. Figure 3A shows the correlation coefficient between the values of these variables and l/|v| at different delays before takeoff. The correlation coefficients of angular acceleration and speed with l/|v| were zero 340 and 215 ms before takeoff, respectively. The correlation coefficient between the time remaining to collision and l/|v| never crossed zero. At a delay of 215 ms before takeoff, angular speed varied significantly with l/|v| (p = 0.03) (Fig. 3B, blue curve). The evidence that acceleration was changing 340 ms before takeoff was less strong (p = 0.1) (Fig. 3B, green curve). However, the analysis of the timing of jump preparatory phases described below suggests that an angular acceleration threshold so early during the approach sequence is unlikely to be related to takeoff. Thus, our results indicate that an angular threshold size of ∼60° is the variable best related to takeoff (see Discussion).
In the following, we use the same linear regression and correlation techniques to assess the relationship between stimulus angular threshold size and preparatory phases of the jump defined from video and electrophysiological recordings.
High-speed video recordings reveal distinct preparatory jump phases
We studied in detail the movements of the hindleg contralateral to the stimulated eye during the escape jumps elicited by looming stimuli. Although the position and orientation of the animals was highly reproducible from trial to trial, we still observed a large residual variability of the timing of preparatory phases leading to escape jumps. In general, variability tended to decrease as events fell closer to takeoff time (see below). Some of the encountered scenarios are illustrated in three example videos (supplemental data, available at www.jneurosci.org as supplemental material). Preparatory movements of the front legs could often be seen, as in the first video for example, but were not analyzed further. In most trials, the hindleg was already in a partially flexed position as the animal stopped at the edge of the platform. In other trials, an early flexion phase, which consisted of swinging the tibia close to the femur, preceded all the upcoming preparatory phases with an average ± SD delay of 909 ± 689 ms. This early flexion occurred on average 938 ± 783 ms (mean ± SD) before expected collision and was positively correlated with l/|v| (ρ = 0.35). Video 1 shows a jump sequence that included an early flexion phase. Starting from the following partially flexed position, we saw a number of different leg movements preceding takeoff. We used the position of the femur–tibia joint as a marker for the movement of the hindleg in our analysis. Because the joint could move in different directions, we tracked the amplitude of movement rather than its direction. In video 2, for example, the femur–tibia joint first moved down toward the platform, bringing the hindleg parallel to the platform, and then up and down again right before takeoff. From the partially flexed position, the femur–tibia joint started moving into full flexion, followed by a gradual slowdown of motion and/or a pause that lasted an average ± SD of 123 ± 134 ms before the joint resumed moving, leading to takeoff. In many of the trials in which the animals did not take off, they still reacted to the looming stimulus by preparing to jump but halted the movement and remained on the platform. Behavioral data presented in all figures except Figure 5, correspond to trials in which the locust took off. Next, we recorded muscle activity during escape jumps to characterize the relationship between the preparatory phases of jump extracted from video recordings and the activity of hindleg flexors and extensors.
Timing of behavior and muscle activity are positively correlated with l/|v|
We used long wires to record muscle potentials from the hindlegs during escape jumps elicited by looming stimuli (ES2). Figure 4A shows four frames of video recording 2 (supplemental data, available at www.jneurosci.org as supplemental material), which illustrates the typical behavioral response to a looming stimulus (l/|v| = 40 ms). The position of the femur–tibia joint is indicated cumulatively by crosses for the example frames and previous ones in Figure 4A. Figure 4B shows muscle recordings obtained simultaneously. Typically, first the flexor became active while the extensor remained inactive (cocking). Next, the extensor became active while the flexor was still active (co-contraction) and finally the flexor activity ceased (triggering), followed by cessation of activity in the extensor. After inspecting the joint movement and comparing it with the muscle recordings across trials for different animals, we consistently found three phases of behavior from the video recordings that were well correlated with the three phases of muscle activity (cocking, co-contraction, and triggering). The IJM was defined as the point in time when the femur–tibia joint started moving from the partially flexed position. In the example frames shown in Figure 4A, the joint is marked with green crosses starting from the time of the IJM. The green portion of the time course of joint movement in Figure 4B corresponds to this phase, with the start of IJM marked by a green arrow. In this example, the IJM was observed 64 ms after the start of activity in the flexor muscle, i.e., the start of the cocking phase, which is also marked by a green arrow on the muscle recording trace in Figure 4B. In this trial, the joint remained still for 90 ms after its initial movement toward the platform (black portion of the joint movement trace, between the green and red ones) before resuming movement. The second movement phase, the FJM, was defined as the time when the joint resumed moving (Fig. 4, A, red crosses, B, red portion of the joint movement curve). In this example, the FJM was observed 94 ms after the start of activity in the extensor muscle or the start of the co-contraction phase (Fig. 4B, red arrow). The FJM was immediately followed by takeoff (Fig. 4B, blue vertical dashed line). Takeoff occurred 34 ms after the end of flexor muscle activity or the triggering phase (Fig. 4B, blue arrow). In this example and all other trials, takeoff occurred 30 ms after the start of tibia extension detected from the videos, consistent with previous measurements of leg extension time (Hoyle, 1955; Brown, 1967).
The correlation coefficients between the times of the IJM and the onset of cocking (ρ = 0.8), FJM and the onset of co-contraction (ρ = 0.9), and triggering and takeoff (ρ = 0.98), were all very high. Furthermore, the IJM, FJM, and takeoff, as well as the start of cocking, co-contraction, and triggering were all positively correlated with l/|v| (data from eight locusts, ES2) (Fig. 5A–C). The timing of IJM and cocking relative to collision were more variable and consequently less well correlated with l/|v| (ρ = 0.4 and 0.3). Conversely, the timings of FJM, co-contraction, takeoff, and triggering showed less variability and a higher correlation with l/|v| (ρ = 0.6, 0.7, 0.7, and 0.7). In some trials, the IJM could not be reliably detected from the videos (supplemental video 3, available at www.jneurosci.org as supplemental material). For these trials (45%), only the FJM and takeoff times were considered. In some recordings, the start or end of flexor activity could not be detected unambiguously because of noisiness of the recordings (50%). Only trials for which both the timing of muscle activation and behavior could be determined were used for this analysis (30, 60, and 50% for IJM/cocking, FJM/co-contraction, and takeoff/triggering, respectively) (total number of used trials shown in Fig. 5A–C). The IJM, FJM, and takeoff could be detected from the video recordings with an average delay of 95, 103, and 49 ms after the start of cocking, co-contraction, and triggering, respectively, with no significant change across l/|v| values (pKWT > 0.05; SDs of 95, 63, and 12 ms) (Fig. 5). This strongly suggests a causal relationship between phases of the muscle activity (cocking, co-contraction, and triggering) and their corresponding behavior (IJM, FJM, and takeoff). For two such events whose occurrence time depends linearly on l/|v|, this is equivalent to the slopes of their linear fits, with l/|v| being identical. Thus, comparing linear fits slopes (Fig. 5) (see also Fig. 7B) provides additional insight about the relationship of events in the sequence leading to a jump.
Predicting the duration of co-contraction and cocking from video recordings
The duration of co-contraction corresponds to the time period used to store the energy required for the jump. We measured this duration from muscle recordings, as the time of flexor and extensor co-activation. On average, co-contraction duration was 118 ms at l/|v| = 40 ms, and the pooled average at l/|v| = 80 and 120 ms was 194 ms (SDs of 48 and 90 ms). The duration was significantly larger at l/|v| = 80 and 120 ms compared with l/|v| = 40 ms (pKWT–HSD < 0.05). Given the very high correlation between preparatory phases obtained from video and muscle recordings, we also investigated the possibility of deducing the duration of co-contraction from the video recordings in ES2. Because the co-contraction is not directly observable from videos, such an estimate has to rely on the mean timing difference between movements and muscle activity derived from simultaneous recordings. As mentioned above, the FJM occurred on average 103 ms after the start of extensor activity, and takeoff occurred 49 ms after triggering (Fig. 5B,C). Therefore, the average time of extensor activity onset can be estimated from videos as (tFJM − 103) ms and the average time of triggering as (ttakeoff − 49) ms. The duration of co-contraction is thus equal to (ttakeoff − 49) − (tFJM − 103) = ttakeoff − tFJM + 54 ms. Because, on average, takeoff occurred 99 ± 42 ms (mean ± SD) after the FJM (no significant change with l/|v|, pKWT = 0.5), the duration of co-contraction could be estimated as 153 ms. We repeated the same calculation using ES1, for which no muscle recordings were performed. The average ± SD delay from FJM to takeoff was 94 ± 57 ms (no significant change with l/|v|, pKWT = 0.3), implying a co-contraction duration of 148 ms. Although the videos did not reveal the differences between l/|v| = 40 and l/|v| = 80 and 120 ms detected in muscle recordings, both durations 153 and 148 ms are in good agreement with the average duration derived from muscle recordings by pooling across l/|v| = 40, 80, and 120 (156 ms, ES2).
The duration of cocking is the time required for the tibia to become fully flexed. As for co-contraction, it could be estimated either directly from the muscle recordings or from the video recordings. When measured from the muscle recordings as the time between the start of flexor and extensor activity, its average ± SD duration was 345 ± 490 ms (no significant change with l/|v|, pKWT = 0.2). The IJM occurred on average 95 ms after the start of flexor activity, and the FJM occurred 103 ms after the start of extensor activity (Fig. 5A,B). Therefore, the duration of cocking can be estimated as (tFJM − 103) − (tIJM − 95) = tFJM − tIJM − 8 ms. The average ± SD delay between IJM and FJM was 394 ± 366 ms (no significant change with l/|v|, pKWT = 0.4, ES2), and, therefore, the duration of cocking could be estimated as 386 ms. The delay between IJM and FJM for ES1 was significantly larger for l/|v| = 80 and 120 ms compared with l/|v| = 40 ms (pKWT–HSD < 0.05). The pooled average ± SD delay for l/|v| = 80 and 120 ms was 353 ± 261 ms and for l/|v| = 40 ms was 205 ± 129 ms. Therefore, the duration of cocking is estimated as 197 ms for l/|v| = 40 ms and 345 ms for l/|v| = 80 and 120 ms. When pooled across l/|v|, the average ± SD delay was 328 ± 249 ms, corresponding to an estimate of 320 ms for the cocking phase, which is in reasonable agreement with the results obtained from the muscle recordings (345 ms) considering the larger variability in the timing of both behavior and muscle activity at these earlier phases.
Looming, not luminance decrease, evokes jumps
During the simulated approach of a black disk on a white background, the overall screen luminance decreases with time. Thus, darkening of the visual field and not looming could be the main cause of escape jumps. To investigate this possibility, we compared the probability and timing of the different phases of jump measured from video recordings in response to black and checkerboard squares looming on white and gray backgrounds, respectively (ES3). The percentage of evoked jumps was not significantly different for the two types of stimuli (mean ± SD, 66 ± 11%; pKWT = 0.8). Figure 6 shows the timing of FJM and takeoff in response to both stimuli. In these experiments, the timing of IJM could only be unambiguously detected in some of the trials, and the corresponding data were not analyzed. Pairwise comparisons between the timing of FJM in response to black and checkerboard looming stimuli showed no significant difference across l/|v|. The same result was found for the timing of takeoff (Fig. 6). For both stimuli, the timing of FJM and takeoff were positively correlated with l/|v| (ρ = 0.7 for FJM, independent of stimulus; ρ = 0.6 and 0.8 for the black and checkerboard squares at takeoff, respectively). We thus conclude that looming causes escape jumps, independent of overall luminance changes.
Peak DCMD firing time and l/|v| are positively correlated across a broad range
Figure 7A shows example nerve cord recordings in response to stimuli with l/|v| = 40 and 120 ms. The DCMD spikes could easily be detected because they had the largest amplitude among all recorded units (Fig. 7A, red traces). This results from the large-diameter axon of the DCMD and its location close to the dorsal surface of the nerve cord. Estimates of the instantaneous DCMD firing rate show that its peak occurs closer to collision at l/|v| = 40 than 120 ms. Indeed, over the range of l/|v| values previously tested, l/|v| = 5–50 ms, the time of the DCMD peak firing rate always occurred closer to collision as l/|v| decreased and was a linear function of l/|v| (Gabbiani et al., 1999; Matheson et al., 2004; Guest and Gray, 2006). We also observed a high positive correlation between l/|v| and the timing of the DCMD peak over the 40–120 ms range (ρ = 0.8; n = 7 animals, ES1). Thus, the timing of the peak as a function of l/|v| could be fit by linear regression, yielding a mean ± SE slope of 2.9 ± 0.1 ms and a mean ± SE intercept of 26 ± 9 ms (Fig. 7B, black line). The mean intercept was positive rather than negative, as reported previously (between −35 and −6 ms in the studies of Gabbiani et al., 1999, 2001). This thus corresponds to an average threshold angle of 38° occurring 26 ms after the DCMD peak rather than before it (see above, Stimulus angular size is constant a fixed delay before takeoff).
We investigated the cause for this difference between the current results (l/|v| = 40–120 ms) and earlier ones (l/|v| = 5–50 ms). First, we noted that the average SE on the intercept obtained by linear fits to the data of individual animals was high (mean SE on intercept of 24 ms; mean intercept of 26 ms; average over seven animals). This suggested that the estimate of the intercept may be less reliable when computed over l/|v| = 40–120 ms. Two observations make this plausible. First, the intercept is the zero crossing of the fitted line with the y-axis and is thus extrapolated from the data. It is therefore likely that it will be less well constrained when l/|v| ranges from 40 to 120 ms rather than from 5 to 50 ms, because the extent of extrapolation is larger for the former range (Fig. 7B, inset). Second, it is known that the variability in the peak firing time increases with l/|v| (Gabbiani et al., 1999). This should also result in a higher variability of the intercept estimated over the 40–120 ms range.
To study this issue directly, we measured the activity of the DCMD across a broad range of l/|v| values (5–120 ms, ES4). This allowed us to compare the slopes and intercepts of the lines fit to the timing of the DCMD peak in response to stimuli with small (5–50 ms) and large (40–120 ms) l/|v| values. We found that the correlation coefficient between the peak DCMD firing time and l/|v| was high over the entire range (5–120 ms; ρ = 0.85), strongly indicating a linear relationship between these two variables. When averaged across animals, the mean ± SE slope and intercept of the linear fit for the small range were 2.7 ± 0.2 and −8 ± 6 ms, respectively. This corresponds to an average threshold angle of 41° occurring 8 ms before the peak DCMD firing rate, as previously reported. The mean slope estimated over the large range was equal to 2.1 (corresponding angular threshold size of 51°), representing a 25% change from the average of the two slopes. Its variability was similar to that obtained over the small range (mean SE of 0.2). In contrast, the mean intercept over the large range was positive, 15 ms, corresponding to a 200% change from the average of the absolute values of the two intercepts. Furthermore, it was associated with a three times higher variability (mean SE of 20 ms). Because of this, the intercepts computed over the large range were not significantly different from those obtained over the small range in 10 of 13 animals (ANCOVA, p > 0.05). Thus, we conclude that intercepts of linear fits computed over the large range are indeed considerably less reliable than those computed over the small range. These results are consistent with the observation that a small change in slope can result in a large change in intercept for a large extrapolation range.
DCMD firing rate peaks between IJM and FJM and decreases substantially before takeoff
To assess the temporal relationship between the different phases of behavior and the time course of the DCMD firing rate, we recorded the nerve cord activity in a subset of locusts used previously to find the timing of different jump phases from video recordings (seven locusts, ES1). In these experiments, the same looming stimuli were used, but the animals were fixed on the platform from which they had jumped in previous experiments. For these animals, Figure 7B shows the peak DCMD firing time and the mean time of different phases of jump behavior as a function of l/|v| (IJM, FJM, and takeoff). In agreement with previous results (Fig. 5), we found a reasonably strong correlation between these variables and l/|v|, indicative of a linear relationship. We then performed an analysis identical to that described for takeoff time (Fig. 3) for the timing of the FJM and found that it was best related to an angular threshold size (13 locusts, ES1). However, we could not rule out that the IJM depends on a threshold in angular speed or acceleration, presumably because of the higher variability of this earlier behavioral phase. These results therefore suggest that takeoff, FJM, and possibly also IJM are associated with a threshold angle, just as the time of peak DCMD firing.
As illustrated in Figure 7B, the IJM occurred on average before the DCMD peak, whereas both the FJM and takeoff occurred after the peak. Similar results were observed when the data were analyzed on an animal-by-animal basis. On average, the DCMD peak occurred 254 ± 280 ms (mean ± SD) after the IJM (see Materials and Methods, Analysis of electrophysiological data). The change in this delay across l/|v| was close to significance (pKWT = 0.06). The FJM occurred after the DCMD peak with delays that were significantly larger for l/|v| between 80 and 120 ms (large values) compared with l/|v| = 40 and 60 ms (small values, pKWT–HSD = 0). On average, the mean ± SD delay was 103 ± 129 and 58 ± 84 ms for large and small l/|v| values, respectively. Note that the delay of 103 ms is equal to the average delay between the timing of FJM and start of co-contraction phase obtained for ES2 (Fig. 5B), suggesting that the co-contraction occurs close to the time of the DCMD peak. Takeoff, conversely, occurred after the DCMD peak with delays that were significantly higher for large l/|v| values (pKWT–HSD = 0). The mean ± SD delay was 222 ± 106 and 148 ± 73 ms for large and small l/|v| values, respectively. Thus, the slope of the lines fit to the FJM and takeoff time as a function of l/|v| are different from that of the peak DCMD time fit, and the same conclusion is likely to be true for the IJM. We conclude that each behavioral phase is associated with a threshold angle different from that signaled by the DCMD peak rate.
Because the IJM occurs considerably earlier than the peak in DCMD firing, we expect the firing rate of the DCMD at the time of the IJM to be significantly smaller than its peak value. Similarly, both the FJM and takeoff occurred well after the DCMD peak and are thus also expected to be associated with DCMD firing rates smaller than the peak value. We thus computed estimates of the DCMD firing rates at the time of the IJM, FJM, and takeoff. Table 1 shows for three locusts the mean and SD of the DCMD peak firing rate as well as the mean and SD of the estimated values of the DCMD firing rate at the time of IJM, FJM, and takeoff in each trial (see Materials and Methods, Analysis of electrophysiological data). Next, to factor out interanimal variability, we normalized the firing rates to their peaks on a trial-by-trial basis. The average ± SD normalized DCMD firing rate at the IJM and takeoff were 0.47 ± 0.24 and 0.09 ± 0.12 times their peak value, respectively, and did not significantly change with l/|v| (pKWT > 0.05) (Fig. 7C). The mean ± SD normalized firing rate at the FJM for l/|v| = 40 ms was equal to 0.68 ± 0.19 and was significantly larger than that for l/|v| = 60–120 ms, which was equal to 0.51 ± 0.26 (pKWT–HSD < 0.05). No other significant differences were detected. These results suggest that the IJM and, therefore, cocking occur before the DCMD peak. The co-contraction phase of muscle activity coincides with the timing of the peak, whereas the FJM becomes detectable from the videos after the peak of the DCMD firing rate. Furthermore, both the triggering phase of muscle activity and takeoff occur after the DCMD peak activity, with takeoff occurring when the DCMD firing rate has decreased to <10% of its peak.
Discussion
We present here a new experimental arrangement that allowed us to study escape jumps in response to well controlled visual stimuli under highly reproducible conditions. Using high-speed video, extracellular nerve cord, and muscle recordings, we were able to characterize various preparatory phases of escape jumps and their relationship to flexor and extensor muscle activity and to the response pattern of a looming-sensitive neuron. Our experiments provide insight into how visual information may be transformed into motor commands within this behavioral context and suggest that different phases in the time-varying firing pattern of sensory neurons may actively participate in the generation of distinct phases of multistage motor behaviors.
Stimulus parameter selection
After an initial set of experiments, we chose stimuli with half-size to speed ratios (l/|v|) ranging between 40 and 120 ms. The 40 ms lower bound was selected because smaller values elicited jumps that occurred on average after projected collision (ES0). Thus, stimuli with l/|v| values smaller than 40 ms are likely to be less relevant to the animal's survival, because they lead on average to unsuccessful escape behaviors. Furthermore, although l/|v| smaller than 40 ms and larger than 120 ms were not studied extensively, preliminary experiments showed that they were typically associated with lower escape probabilities. It makes sense that locusts would ignore very slow approaches (high l/|v|) and might fail to generate an appropriate escape motor program in response to very fast approaching stimuli (low l/|v|). Decreased escape probabilities for small and fast stimuli have been reported in goldfish as well (Preuss et al., 2006). Thus, we believe that l/|v| = 40–120 ms covers the range leading to the most relevant and robust escape jumps in the present context. Large l/|v| values also had the benefit of spreading out distinct events in time, thus increasing our statistical power when comparing the timings of the various behavior phases with the DCMD peak firing time (Fig. 7B).
Because the l/|v| values used here were different from earlier ones, we verified that the relationship between peak DCMD firing time and l/|v| was linear from 5 to 120 ms (ES4). Splitting the data into small (5–50 ms) and large (40–120 ms) l/|v| ranges revealed that estimates of the intercept associated with linear fits were much less reliable over the large than small range. Because our behavioral data were acquired over the large range, we conclude that intercept values determined by linear fits between l/|v| and the timing of behavioral phases are likely to be variable as well. The estimates of the slopes of the fits, conversely, varied much less between the small and large l/|v| range. However, none of our conclusions about the relative timing of behavior and DCMD activity are based on estimates of intercepts and thus are not affected by their relatively higher variability.
Relationship between muscle activity and jump phases
Muscle recordings yield direct indicators of motor activity expected to result in physical motion detectable from video recordings. We thus investigated whether the timing of specific events derived from muscle recordings could be identified using corresponding behavioral correlates, which are easier to measure. Indeed, we found that each of the three motor phases characteristic of escape jumps, cocking, co-contraction, and triggering could be obtained from corresponding behavioral phases: IJM, FJM, and takeoff, respectively. The correlation between the onset times of pairs of motor and behavioral phases was very high. In addition, the variability in the timing of behavioral phases was similar to that of their associated muscle events. We also compared the durations of cocking and co-contraction obtained from muscle and video recordings. When averaged across l/|v| values, both methods were in good agreement. However, the duration of co-contraction derived from muscle recordings changed significantly with l/|v|, an effect that could not be detected from our video analysis (ES2). Such a change is to be expected if the dependence of cocking and co-contraction on l/|v| are linear with different slopes (Fig. 5A,B). Thus, video recordings are less sensitive than muscle recordings for detecting changes in the duration of co-contraction or cocking.
Relationship between stimulus and jump phases
Our results suggest that takeoff was best related to a threshold angular size rather than other kinematic variables. Takeoff time was linearly related to l/|v|, as predicted if angular threshold size were the explanatory variable. Additionally, our correlation analysis showed that angular threshold size was constant 50 ms before takeoff, in good agreement with the delay obtained from the linear relationship between takeoff time and l/|v|. Both time to collision and an angular velocity threshold were ruled out by the correlation analysis (Fig. 3B). A threshold in angular acceleration could not be ruled out at the 5% significance level (Fig. 3B, bottom). However, the predicted time of angular acceleration threshold, 340 ms before takeoff, occurs very early during the sequence of events leading to a jump. For the smaller l/|v| values, this time falls even before the first preparatory phase of the jump, the IJM (Fig. 7B). It thus seems very unlikely that an event occurring before the earliest jump preparatory phase would be the proximal cause of the final takeoff.
The FJM was also best explained by a threshold in angular size, whereas the higher variability of the IJM did not allow us to convincingly rule out other kinematic variables. Analysis of the linear fits to the timing of IJM, FJM, and takeoff as a function of l/|v| showed that their slopes, and consequently the angular threshold sizes associated with each behavior phase, differ from one another. Together, these results suggest that distinct jump phases are activated in succession as the angular size of the looming stimulus passes successive thresholds on the locust's retina. Frogs have also been shown to generate escape jumps in response to an angular size threshold (Yamamoto et al., 2003). Flying locusts initiate collision avoidance behaviors a fixed delay after a threshold angular size is reached on the retina (Robertson and Johnson, 1993). The average threshold angle for flight collision avoidance (10°) is much smaller than the one reported here. However, the corresponding delay (65 ms) is very similar to what we observe. This difference in threshold angle could be attributable to differences in the nature of escape jumps and collision avoidance during flight. If a locust jumps too early, it would give a predator the opportunity to change its approach course and target it again. Conversely, a locust might attempt to avoid obstacles as early as possible during flight.
We found that the duration of co-contraction could be as short as ∼100 ms for low l/|v| values. This is in good agreement with recent results of Santer et al. (2005) based on mechanical stimuli (visually, these stimuli correspond to l/|v| = 20 ms given a half-size l = 4 cm and an average speed of 2 m/s). In addition, we found that the duration of co-contraction increases with l/|v|, reaching ∼200 ms at high values (80–120 ms). Thus, the duration of co-contraction during jumps is considerably shorter than that reported for defensive kicks [300–1000 ms (Burrows and Morris, 2001)]. These results show that the co-contraction phase can be considerably sped up in urgent situations and that it can be controlled over a larger range of values than previously thought. Based on the duration of co-contraction observed during kicking, Burrows (1996, his Chapter 9) suggested that the DCMD firing rate could only play a cursory role in triggering escape jumps, because its activity would terminate well before the end of co-contraction. As explained below, our results show that the much shorter duration of co-contraction observed during looming-evoked jumps is in fact well matched to the time course of the DCMD activation.
Relationship between the DCMD activity and jump phases
Looming stimuli of constant and changing mean luminance are known to elicit identical responses in the DCMD (Gabbiani et al., 2001). A dependence of the timing of jump phases on mean luminance would thus suggest that neurons with different luminance response characteristics than the DCMD are involved in their control. However, we found no such evidence for the FJM and takeoff (Fig. 6).
None of the jump phases occurred at a fixed delay relative to the timing of the DCMD peak activity (Fig. 7B). Thus, we conclude that the exact timing of the peak DCMD firing might not be explicitly decoded or used by the motor system to trigger any of the different phases of escape jumps. However, other features of the DCMD activity could play such a role: it has for example been shown that a threshold firing rate of 50 spikes/s during object approach is also associated with a threshold angle different from that signaled by the DCMD peak (Gabbiani et al., 2002). Such a threshold might be related to the IJM, for example. Because both behavior and neuronal recordings are variable, although the DCMD responds to every presentation of the looming stimuli in fixed preparations (Fig. 7A), the best way to determine which features of the DCMD firing pattern maximally correlate with specific jump phases, or change in no-jump trials, would be to record simultaneously from the DCMD neuron during escape jumps evoked by looming stimuli, a feat not yet accomplished. Such recordings would also allow to compare the DCMD activity during no-jump and jump trials and would thus be particularly helpful to determine whether other sensory neurons are involved in the preparation and execution of the different jump phases. Typically, the variability in behavior and neural recordings was larger during early phases of behavior and tended to increase with l/|v|, as may be expected (Gabbiani et al., 1999). Despite this variability, our results and statistical analysis show that the time course of the DCMD firing rate is tightly coupled with the timing of different phases of the escape behavior. Thus, the IJM occurs during the rising phase of the firing rate, before its peak, whereas the FJM occurs significantly after the peak (Fig. 7C, inset). The co-contraction phase takes place between the IJM and FJM and therefore coincides with the period of maximal DCMD firing and its peak. In contrast, takeoff occurs well after the peak, when the firing rate has substantially decayed.
A model for the role of the DCMD activity in escape jumps
These results can be interpreted in light of the known biophysics of the locust jump and the anatomical connections made by the DCMD with motor neurons and interneurons thought to be involved in eliciting jumps (Fig. 8A). Because takeoff takes place after the firing rate has substantially decayed from its peak value, all three phases of the DCMD activity, initial increase, peak, and firing rate decay, are likely to play an active role in jumps. The DCMD is known to make indirect excitatory connections onto flexor motor neurons. These connections could possibly be involved in the early IJM phase (cocking) as the firing rate of the DCMD rises (Fig. 8B).
Figure 8.
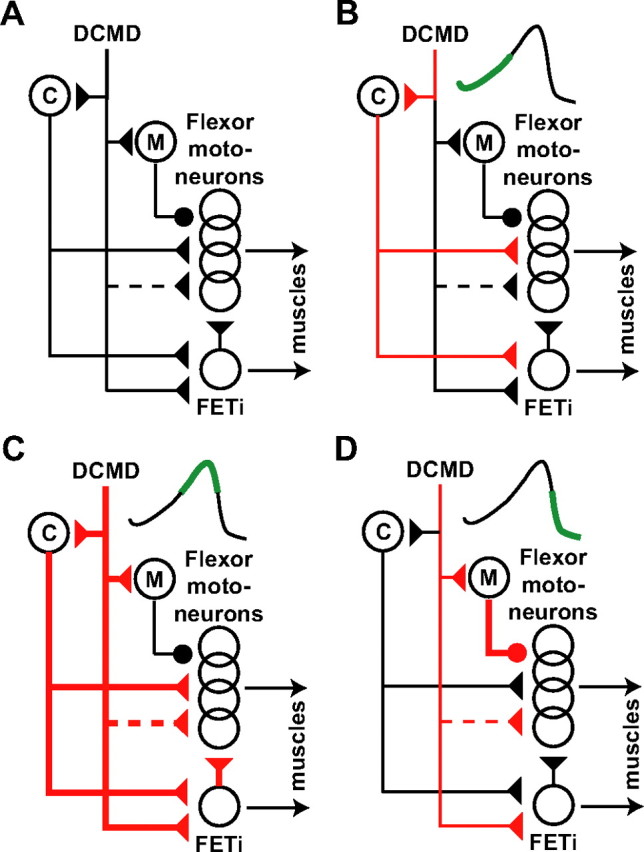
Model for the role of DCMD activity in looming evoked jumps. A, Simplified diagram of the neuronal circuit involved in escape jumps (adapted from Burrows, 1996). Circles and triangles denote excitatory and inhibitory synapses. Dashed lines indicate possible indirect connections. Thick and thin red lines indicate strong and weakly activated pathways. Top right insets in B–D indicate firing phase of the DCMD (green). C, M, Interneurons with properties similar to those originally postulated for the C and M interneurons (Pearson et al., 1980; Pearson and Robertson, 1981). B, The rising phase of the DCMD firing rate would contribute to the excitation of C-like neuron(s) (thin red lines). Such a level of excitation would lead to the activation of flexors but not the FETi (cocking). C, Around the peak firing of the DCMD, direct and indirect excitation of the FETi and indirect excitation of flexors are at their highest level and would therefore contribute to the co-contraction. In addition, DCMD excitation would contribute to the delayed activation of M-like neuron(s) early during the next phase because of their higher firing threshold. D, The decay in DCMD firing rate would contribute to a withdrawal of excitation to both extensors and flexors (thin red lines). In addition, firing of M-like neuron(s) caused in part by the earlier DCMD activity would inhibit flexor motor neurons (thick red line with a circular ending) and help terminate their activity, as required for triggering and takeoff.
The peak in DCMD firing rate occurs during the co-contraction phase, the period during which energy is stored to power the jump. During this phase, both the extensor and flexor motor neurons are simultaneously active. The DCMD makes both direct and indirect excitatory connections onto flexor motor neurons as well as the fast extensor tibia (FETi) motor neuron. The FETi is maximally active during the co-contraction and makes in turn excitatory connections onto flexor motor neurons via synapses having complex temporal dynamics (Niven and Burrows, 2003) (Fig. 8C). Triggering and takeoff require termination of the excitation of the flexors and extensors, allowing the release of the energy stored in elastic elements of the hindlegs. This phase coincides with the rapid decrease of the DCMD firing rate observed after its peak. Thus, the decrease in DCMD activity, and the resulting withdrawal of excitation, could contribute to the termination of the excitation of the flexors, as required for takeoff (Fig. 8D). This model is based on known anatomical connections and on our characterization of the relative time course of the DCMD activity, muscle activity, and behavior. However, it does not rule out the involvement of other neurons in the generation of this motor program.
Preuss et al. (2006) have described recently looming-evoked escape responses in goldfish triggered by visual inputs to the Mauthner cell. Approaching objects elicit a compound EPSP (cEPSP) that has a similar, although not identical, time course to the DCMD firing rate: the cEPSP amplitude increases, peaks, and then decays toward the end of approach. The timing of the cEPSP peak is best related to escape behaviors. Thus, in Mauthner cells, the timing of the peak acquires a significance that the peak in DCMD firing rate does not seem to possess for downstream motor neurons. This is presumably because the Mauthner cell acts as a threshold detector, best tuned to a maximal depolarization that triggers the firing of a single spike required for eliciting the escape behavior. In contrast, takeoff in the locust requires termination of flexor activity that is achieved both by withdrawal of excitation and inhibition. Thus, the locust jump and goldfish C-start response provide examples in which motor circuits receive similar sensory information yet process it quite differently based on the neural and physical constraints governing the generation of these behaviors. Nervous systems possessing identified neurons and robust motor outputs thus provide an excellent opportunity to study the sensorimotor transformations leading to behavior and could possibly be used as templates for studying more complex systems.
Footnotes
This work was supported by grants from the National Science Foundation and National Institute of Mental Health. H.F. thanks Dr. I. Cohen for providing visual stimulation programs and guidance in electrophysiological experiments, as well as Dr. J. Maunsell for helpful insights and suggestions. We thank Drs. J. Maunsell and H. G. Krapp for comments on this manuscript. Use of the QNX 4 and 6 operating systems were made possible through the Educational Program of QNX Software Systems.
References
- Abrams TW, Pearson KG. Effects of temperature on identified central neurons that control jumping in grasshoppers. J Neurosci. 1982;2:1538–1553. doi: 10.1523/JNEUROSCI.02-11-01538.1982. [DOI] [PMC free article] [PubMed] [Google Scholar]
- Bennet-Clark HC. The energetics of the jump of the locust Schistocerca gregaria. J Exp Biol. 1975;63:53–83. doi: 10.1242/jeb.63.1.53. [DOI] [PubMed] [Google Scholar]
- Bhatt DH, McLean DL, Hale ME, Fetcho JR. Grading movement strength by changes in firing intensity versus recruitment of spinal interneurons. Neuron. 2007;53:91–102. doi: 10.1016/j.neuron.2006.11.011. [DOI] [PubMed] [Google Scholar]
- Brown RHJ. Mechanism of locust jumping. Nature. 1967;214:939. [Google Scholar]
- Burrows M. Motor patterns during kicking movements in the locust. J Comp Physiol A Neuroethol Sens Neural Behav Physiol. 1995;173:289–305. doi: 10.1007/BF00219055. [DOI] [PubMed] [Google Scholar]
- Burrows M. Oxford: Oxford UP; 1996. The neurobiology of an insect brain. [Google Scholar]
- Burrows M, Morris G. The kinematics and neural control of high-speed kicking movements in the locust. J Exp Biol. 2001;204:3471–3481. doi: 10.1242/jeb.204.20.3471. [DOI] [PubMed] [Google Scholar]
- Burrows M, Rowell CHF. Connections between descending visual interneurons and metathoracic motoneurons in the locust. J Comp Physiol A Neuroethol Sens Neural Behav Physiol. 1973;85:221–234. [Google Scholar]
- Edwards DH, Heitler WJ, Krasne FB. Fifty years of a command neuron: the neurobiology of escape behavior in the crayfish. Trends Neurosci. 1999;22:153–161. doi: 10.1016/s0166-2236(98)01340-x. [DOI] [PubMed] [Google Scholar]
- Fayyazuddin A, Zaheer MA, Hiesinger PR, Bellen HJ. The nicotinic acetylcholine receptor Dalpha7 is required for an escape behavior in Drosophila. PloS Biol. 2006;4:420–431. doi: 10.1371/journal.pbio.0040063. [DOI] [PMC free article] [PubMed] [Google Scholar]
- Gabbiani F, Krapp HG, Laurent G. Computation of object approach by a wide field, motion-sensitive neuron. J Neurosci. 1999;19:1122–1141. doi: 10.1523/JNEUROSCI.19-03-01122.1999. [DOI] [PMC free article] [PubMed] [Google Scholar]
- Gabbiani F, Mo C, Laurent G. Invariance of angular threshold computation in a wide-field looming-sensitive neuron. J Neurosci. 2001;21:314–329. doi: 10.1523/JNEUROSCI.21-01-00314.2001. [DOI] [PMC free article] [PubMed] [Google Scholar]
- Gabbiani F, Krapp HG, Koch C, Laurent G. Multiplicative computation in a visual neuron sensitive to looming. Nature. 2002;420:320–324. doi: 10.1038/nature01190. [DOI] [PubMed] [Google Scholar]
- Guest BB, Gray JR. Responses of a looming-sensitive neuron to compound and paired object approaches. J Neurophysiol. 2006;95:1428–1441. doi: 10.1152/jn.01037.2005. [DOI] [PubMed] [Google Scholar]
- Hammond S, O'Shea M. Escape flight initiation in the fly. J Comp Physiol A Neuroethol Sens Neural Behav Physiol. 2007;193:471–476. doi: 10.1007/s00359-006-0203-9. [DOI] [PubMed] [Google Scholar]
- Hatsopoulos N, Gabbiani F, Laurent G. Elementary computation of object approach by wide-field visual neuron. Science. 1995;270:1000–1003. doi: 10.1126/science.270.5238.1000. [DOI] [PubMed] [Google Scholar]
- Heitler W. The locust jump: specialization of femoral-tibial joint. J Comp Physiol. 1974;89:93–104. [Google Scholar]
- Heitler W, Burrows M. The locust jump. I. The motor programme. J Exp Biol. 1977;66:203–219. doi: 10.1242/jeb.66.1.203. [DOI] [PubMed] [Google Scholar]
- Hoyle G. Neuromuscular mechanisms of a locus skeletal muscle. Proc R Soc Lond B Biol Sci. 1955;143:343–367. doi: 10.1098/rspb.1955.0016. [DOI] [PubMed] [Google Scholar]
- Hoyle G. Distributions of nerve and muscle fibre types in locust jumping muscle. J Exp Biol. 1978;73:205–233. doi: 10.1242/jeb.73.1.205. [DOI] [PubMed] [Google Scholar]
- Howard J, Dubs A, Payne R. The dynamics of phototransduction in insects. J Comp Physiol. 1984;154:707–718. [Google Scholar]
- Judge S, Rind F. The locust DCMD, a movement-detecting neurone tightly tuned to collision trajectories. J Exp Biol. 1997;200:2209–2216. doi: 10.1242/jeb.200.16.2209. [DOI] [PubMed] [Google Scholar]
- Killmann F, Schürmann FW. Both electrical and chemical transmission between the “lobula giant movement detector” and the “descending contralateral movement detector” neurons of locusts as supported by electron microscopy. J Neurocytol. 1985;14:637–652. doi: 10.1007/BF01200802. [DOI] [PubMed] [Google Scholar]
- Korn H, Faber DS. The Mauthner cell half a century later: a neurobiological model for decision-making? Neuron. 2005;47:13–28. doi: 10.1016/j.neuron.2005.05.019. [DOI] [PubMed] [Google Scholar]
- Levi A, Camhi JM. Wind direction coding in the cockroach escape response: winner does not take all. J Neurosci. 2000;20:3814–3821. doi: 10.1523/JNEUROSCI.20-10-03814.2000. [DOI] [PMC free article] [PubMed] [Google Scholar]
- Matheson T, Rogers SM, Krapp HG. Plasticity in the visual system is correlated with a change in lifestyle of solitarious and gregarious locusts. J Neurophysiol. 2004;91:1–12. doi: 10.1152/jn.00795.2003. [DOI] [PubMed] [Google Scholar]
- Moore DS, McCabe GP. Introduction to the practice of statistics. New York: Freeman and Company; 2006. Inference for regression; pp. 634–667. [Google Scholar]
- Niven JE, Burrows M. Spike width reduction modifies the dynamics of short-term depression at a central synapse in the locust. J Neurosci. 2003;23:7461–7469. doi: 10.1523/JNEUROSCI.23-20-07461.2003. [DOI] [PMC free article] [PubMed] [Google Scholar]
- Oliva D, Medan V, Tomsic D. Escape behavior and neuronal responses to looming stimuli in the crab Chasmagnathus granulatus (Decapoda: Grapsidae) J Exp Biol. 2007;210:865–880. doi: 10.1242/jeb.02707. [DOI] [PubMed] [Google Scholar]
- O'Shea M, Williams JLD. The anatomy and output connection of a locust visual interneurone; the lobular giant movement detector (LGMD) J Comp Physiol A Neuroethol Sens Neural Behav Physiol. 1974;91:257–266. [Google Scholar]
- O'Shea M, Rowell CHF, Williams JLD. The anatomy of a locust visual interneurone: the descending contralateral movement detector. J Exp Biol. 1974;60:1–12. [Google Scholar]
- Pearson KG, Robertson RM. Interneurons coactivating hindleg flexor and extensor motorneurons in the locust. J Comp Physiol. 1981;144:391–400. [Google Scholar]
- Pearson KG, Heitler WJ, Steeves JD. Triggering of locust jump by multimodal inhibitory interneurons. J Neurophysiol. 1980;43:257–278. doi: 10.1152/jn.1980.43.2.257. [DOI] [PubMed] [Google Scholar]
- Preuss T, Osei-Bonsu PE, Weiss SA, Wang C, Faber DS. Neural representation of object approach in a decision-making motor circuit. J Neurosci. 2006;26:3454–3464. doi: 10.1523/JNEUROSCI.5259-05.2006. [DOI] [PMC free article] [PubMed] [Google Scholar]
- Rind FC. A chemical synapse between two motion detecting neurons in the locust brain. J Exp Biol. 1984;110:143–167. doi: 10.1242/jeb.110.1.143. [DOI] [PubMed] [Google Scholar]
- Rind FC, Simmons PJ. Orthopteran DCMD neuron: a reevaluation of responses to moving objects. I. Selective response to approaching objects. J Neurophysiol. 1992;68:1654–1682. doi: 10.1152/jn.1992.68.5.1654. [DOI] [PubMed] [Google Scholar]
- Robertson RM, Johnson AG. Retinal image size triggers obstacle avoidance in flying locusts. Naturewissenschaften. 1993;80:176–178. [Google Scholar]
- Rogers SM, Krapp HG, Burrows M, Matheson T. Compensatory plasticity at an identified synapse tunes a visumotor pathway. J Neurosci. 2007;27:4621–4633. doi: 10.1523/JNEUROSCI.4615-06.2007. [DOI] [PMC free article] [PubMed] [Google Scholar]
- Santer RD, Yamawaki Y, Rind FC, Simmons PJ. Motor activity and trajectory control during escape jumping in the locust Locusta migratoria. J Comp Physiol A Neuroethol Sens Neural Behav Physiol. 2005;191:965–975. doi: 10.1007/s00359-005-0023-3. [DOI] [PubMed] [Google Scholar]
- Santer RD, Rind FC, Stafford R, Simmons PJ. Role of an identified looming-sensitive neuron in triggering a flying locust's escape. J Neurophysiol. 2006;95:3391–3400. doi: 10.1152/jn.00024.2006. [DOI] [PubMed] [Google Scholar]
- Schlotterer GR. Response of the locust descending movement detector neuron to rapidly approaching and withdrawing visual stimuli. Can J Zool. 1977;55:1372–1376. [Google Scholar]
- Simmons PJ. Connexions between a movement detecting visual interneuron and flight motoneurons of a locust. J Exp Biol. 1980;86:87–97. [Google Scholar]
- Sword GA. To be or not to be a locust? A comparative analysis of behavioral phase change in nymphs of Schistocerca americana and S. gregaria. J Insect Physiol. 2003;49:709–717. doi: 10.1016/s0022-1910(03)00092-1. [DOI] [PubMed] [Google Scholar]
- Wyman RJ, Thomas JB, Salkoff L, King DG. The Drosophila giant fiber system. In: Eaton R, editor. Neural mechanisms of startle behavior. New York: Plenum; 1984. pp. 133–161. [Google Scholar]
- Yamamoto K, Nakata M, Nakagawa H. Input and output characteristics of collision avoidance behavior in the frog Rana catesbeiana. Brain Behav Evol. 2003;62:201–211. doi: 10.1159/000073272. [DOI] [PubMed] [Google Scholar]