Abstract
Background
We sought to identify the bladder dose-volume factors associated with an increased risk of late urinary toxicity among prostate cancer patients treated with radiotherapy.
Materials and methods
This retrospective analysis included data from 128 prostate cancer patients treated on protocol with 2Gy/fraction to 46Gy followed by a boost to 78Gy. The end-point for this analysis was grade 1 or greater late genitourinary (GU) toxicity occurring within 2 years of treatment. The Lyman-Kutcher-Burman, mean dose, threshold dose, and hottest volume models were fitted to the toxicity data using the maximum likelihood method.
Results
Model fits based on dose volume histograms tended to fit the toxicity data better than models based on dose wall histograms. The hottest volume (hot-spot) model was found to be the best-fitting model investigated. The best fit was for the hottest 2.9% of bladder (95% C.I. 1.1% to 6.8%). This model has an area under the receiver operating characteristic curve of 0.74. The hot-spot model separated the patients into clinically meaningful subgroups with about 25% of the patients who received < 78Gy to the hottest 2.9% of bladder experienced GU toxicity at 8 years compared to about 50% when the dose was ≥ 78Gy (p = 0.002).
Conclusion
This provides the first evidence supporting that bladder “hot-spots” are related to GU toxicity within 2 years after external beam radiotherapy for prostate cancer. Confirming data are needed from other investigators. Particular attention should be given to hot spots higher than 78Gy in bladder in radiation treatment planning.
Keywords: Prostate cancer, radiotherapy, GU toxicity, NTCP
Introduction
Improved computer-aided visualization of the prostate and the surrounding normal tissues has allowed more conformal 3-dimensional radiotherapy (3D-CRT) and safe dose escalation. This increase in dose to the prostate has improved the biochemical outcome of prostate cancer [1] [2] [3]. Before the use of 3D-CRT, the prostate RT dose limit was thought to be 70Gy. The toxicity rates doubled when significantly higher doses were used to treat prostate cancer using conventional radiotherapy techniques [4]. In particular, late rectal toxicity associated with high dose external beam prostate cancer radiotherapy has been the subject of intense investigation in the past decade [5]. With careful attention to the dose volume histogram (DVH) constraints, late rectal toxicity has been maintained at an acceptable level even when prostate dose increased to 78Gy [6] [7]. The data on DVH constraints applicable to genitourinary (GU) toxicity are however less well understood and much more research is needed. Furthermore, the paucity of data also makes projecting late GU toxicity difficult when dose is further escalated beyond 78Gy.
This study examined features of the dose-volume histogram of the urinary bladder and bladder wall as related to the incidence of late GU toxicity among prostate cancer patients treated with 78Gy external beam radiotherapy. We compared several normal tissue complication probability (NTCP) models and identified the best fitting of these models. Our analysis suggests possible DVH constraints to better control late urinary toxicity after high-dose prostate cancer radiotherapy.
Materials and Methods
Patient cohort
The patients included in the present analysis comprised a subset of the patients enrolled on our institutional review board approved protocol (MDACC #93-001) which has been described previously [1]. We have also published the results of NTCP modeling using rectal toxicity data from the same patient cohort [7] [8] [9]. Briefly, all patients received definitive 3-dimensional conformal radiotherapy for prostate cancer at the University of Texas M.D. Anderson Cancer Center between 1992 and 1999. There were 128 patients for whom dose volume histogram (DVH) data were recovered. Minimum follow up for these patients was two years. The binary end-point for the present NTCP analysis was whether a grade ≥ 1 (i.e. any) late GU toxicity occurred within two years after the end of RT (yes or no). In this study, late complications were defined as those developing ≥3 months after RT completion. All late GU complications were graded per protocol using a modified scale and criteria from the Radiation Therapy Oncology Group [10], Late Effects Normal Tissue Task Force [11], and Fox Chase Cancer Center [12]. The details concerning grading of late GU toxicity are shown in Table 1. Follow-up clinical history and examinations were performed after the completion of RT at 3-6 month intervals during the first 2 years, every 6 months for 3 years, and annually thereafter.
Table 1.
The grading system used for late genitourinary radiation side effects.
| Grade 1 | Grade 2 | Grade 3 | Grade 4 | Grade 5 |
|---|---|---|---|---|
| Nocturia twice baseline. Microscopic hematuria. Light mucosal atrophy and minor telangiectasia. |
Moderate frequency. Nocturia more than twice baseline. Generalized telangiectasia. Intermittent macroscopic hematuria. Two or fewer blood transfusions. Two or fewer coagulations. Regular non- narcotic or occasional narcotic for pain. |
Severe frequency and dysuria. Nocturia more frequent than once every hour. Reduction in bladder capacity (150 cc). Frequent hematuria. More than two transfusions. More than one coagulation for hematuria. Regular narcotic for pain. |
Severe hemorrhagic cystitis. Ulceration. Requirement for urinary diversion and/or cystectomy. |
Fatal toxicity |
RT techniques
The details of RT have been described previously [7,13]. Patients underwent simulation and treatment in the supine position with a full bladder. Immobilization devices were used and varied by year of treatment. CT image data sets for planning were acquired for 3D-CRT using a 5-mm slice thickness (Model 9800, General Electric Medical Systems, Milwaukee, WI). Daily patient positioning was performed using skin marks and weekly portal films. The patients were initially treated to 46Gy at 2Gy/fraction to the isocenter using 18-MV photons and a conventional four-field box technique. A six-field 3D-CRT approach was used to boost the total isocenter dose to 78Gy at 2Gy/fraction. The clinical target volume (CTV) was defined as the prostate and seminal vesicles. For a limited number of patients, a portion of the seminal vesicles was excluded from the CTV to decrease the dose to the rectum. The block edge was placed 1.25–1.5 cm around the CTV in the anterior and inferior directions and 0.75–1.0 cm in the posterior and superior directions. This technique typically allowed the 95% isodose line for the 3D-CRT boost to cover the CTV.
Dose volume information
The original contours of the prostate and the surrounding normal tissues were restored from the institutional archives. Treatment plans were originally designed using an in-house 3D treatment planning system and archived using RTOG format (including full dose matrix and contoured structure sets). We have developed a conversion program that converts the RTOG file into a Pinnacle3 treatment plan (without re-computing dose). This has been verified using phantom and patient plans (compared the DVHs calculated for both treatment planning systems). The agreement was excellent. All dose-volume, dose-wall histograms were calculated using the Pinnacle3 treatment planning system (Philips Medical Systems, Bothell, WA) with the same converted dose distributions. A 5-mm thick bladder wall was assumed, with the inner contour generated automatically from the outer contour, and pseudo dose wall histograms (DWHs) were also computed. The dose bins for each DVH and DWH were 0.1Gy in size.
NCTP modeling
All data analyses were performed using Stata (StataCorp. 2005. Stata Statistical Software: Release 9. College Station, TX: Stata Corp LP). Four different dose-volume-response models were fitted to the grade ≥ 1 late GU toxicity within 2 years of treatment using the dose-volume information from either the DVH or the DWH. These widely used models have been described in detail elsewhere [8] [9]. Briefly, each model was based on a summary measure μ extracted from the DVH or DWH, which was then converted to a complication probability using a probit equation:
| (1) |
Each of the models includes at least two unknown parameters, μ50 (determining the position of curve) and s (determining the slope of the curve, and often written in the form s = (m · μ50)−1 , as well as any other parameters used to define the summary measure μ . The models considered here correspond to the following summary measures of the DVH or DWH:
Lyman model
For the Lyman model [14] combined with the Kutcher-Burman DVH-reduction scheme [15], μ is equal to the effective dose, defined by [16]
| (2) |
where vi is the volume of the dose bin corresponding to dose Di in the differential DVH or DWH. In addition to the parameters s and μ50 = D50, this model has a third parameter, n.
Mean dose model
For the mean dose model, the quantity μ is the mean dose (MD) to the organ:
| (3) |
This model includes only the two probit parameters s and μ50 = MD50 and is a special case of the Lyman model corresponding to n = 1.
Threshold dose model
For the threshold dose model, μ represents the fractional volume VDc of organ receiving a dose greater than or equal to a “threshold” dose Dc:
| (4) |
where the sum is over i such that Di ≥ Dc. This model has three parameters: the optimal dose, Dc , as well as the two probit parameters s and μ50 = VDc(50). Both relative and absolute volumes of bladder and bladder wall were considered.
Hottest volume (hot-spot) model
By switching the roles of dose and volume in the threshold dose model, a similar model can be obtained. Instead of a threshold dose Dc as defined in the previous model, a threshold “hottest” volume, Vc, is specified, and we consider the minimum dose, DVc, to the hottest volume of bladder of size Vc. Fitting the values of DVc to the GU toxicity data using the probit link, a model with three parameters is again obtained: the optimal threshold volume, Vc, the value of DVc corresponding to 50% complication probability, denoted DVc(50), and either s or m. Again, both the normalized relative volume and the absolute volume were considered.
All models were fitted to the data using maximum likelihood analysis. Confidence intervals for the model parameter estimates were obtained using the profile-likelihood method. Model comparisons were performed using bootstrap analysis, as described elsewhere [17] using 1000 bootstrap iterations unless otherwise stated. Curves showing freedom from toxicity as a function of time after radiotherapy were generated using the method of Kaplan and Meier. The area under the receiver operating characteristic (ROC) curve was computed for this best fitting model [18].
Late GU toxicity
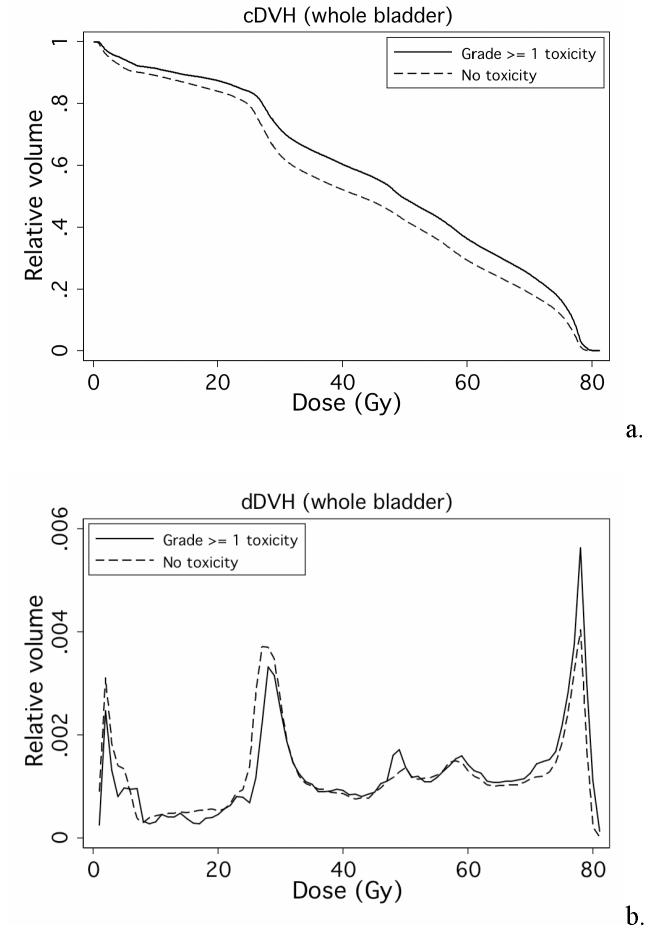
Fig. 1 shows freedom from late GU toxicity among the 128 patients, respectively. All patients had follow up longer than 2 years and this time point was used for NTCP modeling. Fig. 1 illustrates that the majority of events within 2 years were grade 1. There were 19 patients who had grade ≥ 1 GU toxicity within 2 years of RT. Fig. 2 shows the average a) cumulative DVHs (cDVHs) and b) differential DVHs (dDVHs) for the patients with and without grade ≥ 1 GU toxicity within 2 years. The dose volume curve for patients with late GU toxicity is higher than that of the patients without side effects during this time period (Fig. 2a). Furthermore, the patients with late GU events within 2 years seem to have a stronger ‘spike’ at about 78Gy on their dDVHs (Fig. 2b).
Fig. 1.
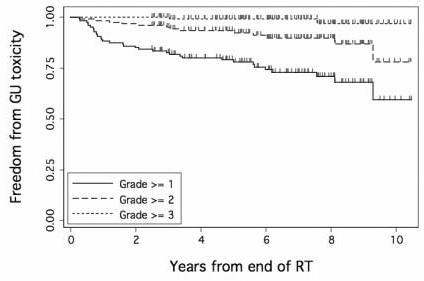
Proportion of the 128 patients free from grade ≥ 1, grade ≥ 2, or grade ≥ 3 late GU toxicity after 78Gy external beam radiotherapy for prostate cancer.
Fig. 2.
Average a) cDVHs and b) dDVHs for the patients with (solid line) and without (dotted line) grade ≥ 1 GU toxicity within 2 years.
DVH vs. DWH
The median bladder volume among the 128 patients with DVH data available was 244.5 cc (range 52.5 to 999.6 cc). The median volume of bladder wall was 42.2 cc (range (21.1 to 69.8 cc). The volumes of bladder and bladder wall were highly correlated (r = 0.988, p < 0.0001). The mean dose to whole bladder had a median value of 44.4Gy (range 19.1 to 71.3Gy). The mean dose to bladder wall had a median value of 44.9Gy (range 21.1 to 68.8Gy). The mean doses to the two structures were highly correlated (r = 0.994, p < 0.0001).
NTCP modeling and bootstrap analysis
Table 2 lists the parameter estimates from the Lyman-Kutcher-Burman (LKB) model fitted to the grade ≥ 1 2-year GU toxicity data using the DVH data from whole bladder, regarded as a solid organ. Note that the parameter n is very close to zero, indicating that the maximum dose to bladder is important in determining toxicity. Fig. 3 shows the fit of LKB model to the GU toxicity data. Consistent with the estimate n≈0, the LKB model fits the data significantly better than the mean dose model, which corresponds to n=1 in the LKB model (P = 0.002, likelihood ratio test). In fact, the mean dose to bladder was not significantly associated with the incidence of grade ≥ 1 GU toxicity within 2 years in this patient cohort (p = 0.122, probit model).
Table 2.
Parameter estimates of the Lyman-Kutcher-Burman model fitted to the late GU toxicity data (Grade ≥ 1 toxicity within 2 years), with 95% profile-likelihood confidence intervals shown in parentheses.
| n = 0.00995 (0, 0.059) |
| m = 0.022 (0.013, 0.089) |
| D50 = 77.6Gy (74.4Gy, 80.3Gy) |
Fig. 3.
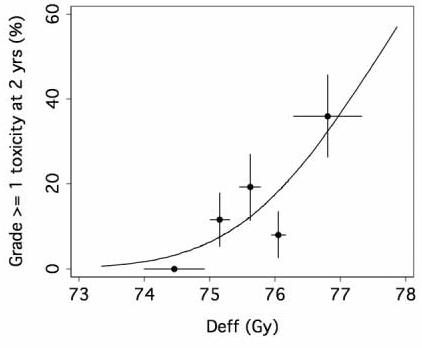
The points represent the incidence of toxicity in each of 5 equal subgroups of patients (25-26 patients each), plotted at the mean value of effective dose Deff (Eq. 2) in the subgroup. The horizontal error bars represent ± 1 standard deviation of the mean Deff in each group, and the vertical error bars represent ± 1 standard deviation calculated from the observed incidence of complications, assuming binomial statistics.
Because the Lyman model points to the importance of the maximal dose, we examined the “hottest volume” model. The best fit was for the hottest 2.9% of bladder (95% C.I. 1.1% to 6.8%). Fig. 4 shows the fit of the hottest volume (hot-spot) model to the bladder toxicity data using the threshold volume of 2.9% of bladder.
Fig. 4.
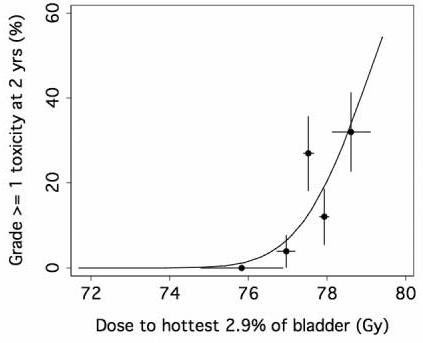
Fit of absolute hottest volume (hot-spot) models to the late GU toxicity data. The points represent the incidence of toxicity in each of 5 equal subgroups of patients (25-26 patients each), plotted at the mean value of dose to hottest 2.9% volume in the subgroup. The horizontal error bars represent ± 1 standard deviation of the mean in each group, and the vertical error bars represent ± 1 standard deviation calculated from the observed incidence of complications, assuming binomial statistics.
A fit of the frequently used threshold-dose model identified 79Gy as the optimal dose threshold (95% CI 65.9Gy to 79.6Gy). Although the fit of this model also highlights the role of high doses in increasing the risk of grade ≥ 1 GU toxicity within 2 years, bootstrap analysis indicates that this model does not fit the data as well as the hottest volume model (P = 0.033). The hottest volume model was also compared to the LKB model using bootstrap analysis. Because of the computation time required to fit the Lyman model, the bootstrap was performed with only 200 replicates, of which 52 attempted fits failed to converge numerically to a set of LKB parameter estimates. The results from the 148 cases in which convergence was achieved suggest that the hottest volume model tends to fit the toxicity data better than the LKB model, though not significantly so (P = 0.088).
The threshold dose and hottest volume models were also fitted to the 2-year GU toxicity data using absolute bladder volumes in lieu of normalized relative volumes. The optimal threshold dose was 77.6 Gy (95% CI 63.8 Gy to 79.5 Gy) and the optimal absolute hottest volume was 5.3cc (95% CI <0.1cc to 15.3cc). There was trend for the relative hottest volume model to fit the data better than the absolute hottest volume model (P = 0.075, bootstrap analysis), but there was no consistent difference in the fits of the relative and absolute threshold dose models (P = 0.581, bootstrap analysis).
Each of the models was also fitted using the pseudo bladder-wall DWH data, and the corresponding fits were compared to one another using bootstrap analysis. The hottest relative volume model with a threshold volume of 2.9% of solid bladder fitted the toxicity data significantly better than the relative hottest wall-volume model with an optimal threshold of 2.7% of bladder wall. Similarly, the hottest absolute volume model with a threshold volume of 5.3cc of solid bladder fitted the toxicity data significantly better than the absolute hottest wall-volume model with an optimal threshold of 1cc of bladder wall (P = 0.018, bootstrap analysis). However, there were no significant differences between the relative or absolute threshold dose models and their counterparts for bladder wall, which had optimal threshold doses of 77.8 Gy in each case (P = 0.437 and P = 0.220, respectively).
Hot-spot model
Fig. 5 shows the ROC curve for this model. In particular, no patient experienced bladder symptoms unless the dose to the hottest 2.9% of bladder was 77.3 Gy or higher. More than half of the toxicities (11/19) occurred in patients receiving ≥ 78 Gy to 2.9% or more of bladder. Fig. 6 shows the time to grade ≥ 1 late GU events according to the dose to the hottest 2.9% of bladder: < 78Gy vs. ≥ 78Gy (p = 0.002).
Fig. 5.
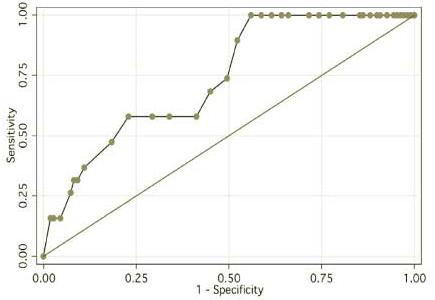
ROC curve for the best-fitting “hot-spot” late GU NTCP model.
Fig. 6.
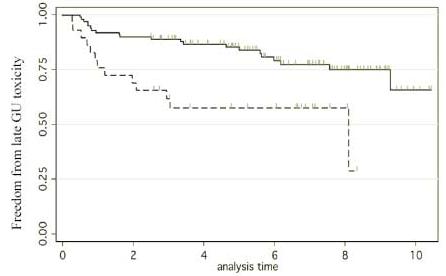
Freedom from grade ≥ 1 late GU toxicity after prostate cancer radiotherapy. The two groups are respectively the patients who received < 78Gy to the hottest 2.9% of their bladders (solid line) versus those who received ≥ 78 Gy to the hottest 2.9% of their bladders (dotted line) (p = 0.002).
Discussion
The development of 3D-CRT has allowed recent dose escalation for the treatment of prostate cancer [19]. This increase in dose to the prostate has improved the biochemical outcome of prostate cancer [1,20]. However, there is concern that dose escalation may also increase the normal tissue toxicity [21]. In contemporary series, late GU toxicity appears to be acceptable when prostate cancer is treated beyond 70Gy within the initial follow up time frame [22] [23] [24]. However, the rate of late urinary toxicity increases continuously with time to become a major side effect in longer term studies [25] [26] [27]. The radiation dose distribution to rectum has been shown to be highly correlated with late rectal toxicity [5] [7] [8] [9] [28]. The dose-volume response of the urinary bladder is much less well understood and is the subject of our study.
2-year hot-spot NTCP model and long-term GU toxicity
To ensure there were enough events for NTCP modeling, we included late GU toxicity events of any grades and types occurring within the first 2 years. We found that the mean doses to bladder and bladder wall were highly correlated, with correlation coefficient close to 1, and the shapes of the DVHs and DWHs were very similar. However, the DVH data fitted the toxicity data better than the DWH data – in some cases significantly so. Hence, we suggest that the whole-bladder DVH may be simpler and better to use in clinical treatment planning than the bladder-wall DWH.
We found a dose-volume response of the urinary bladder (Fig. 2a), and our analysis of the differential DVH (dDVH) suggested that there was a stronger dose “spike” (Fig. 2b) at about 78Gy for patients with late GU events. Our NTCP modeling identified the LKB model (Fig. 3) as the better model when compared with the mean dose model. Our fitted LKB parameters were quite different from what was previously thought, based on consensus: n = 0.5, m = 0.11, TD50 = 80Gy [29,30]. Our study revealed that volume factor n was close to zero (Table 2) suggested that maximal doses, quantified as the hot spots, might be important determinants of late GU toxicity.
From the hottest-volume NTCP modeling, we identified 2.9% of bladder volume as the optimal cut-point (95% C.I. 1.1% to 6.8%) (Fig. 4) and, using absolute volume, the dose to the hottest 5.3 cc of bladder (95% CI <0.1cc to 15.3cc) as significant determinants of late 2-year GU toxicity associated with high-dose prostate cancer radiotherapy. According to the fitted hot-spot model, the late (≥ 3months) GU toxicity is projected to be about 20% at 78Gy and increase steeply beyond that (Fig. 4). This model has an ROC area of about 0.74 (Fig. 5) suggesting that while this model is quite accurate other factors may also be important for late GU toxicity. Firstly, the bladder dose volume information was obtained from a single planning CT. However, we have observed that the daily filling of the bladder may not be uniform and this may affect the actual radiation dose and volume of the bladder [31]. Our future dose-volume response studies will incorporate these day-to-day variability data of the bladder volume. Secondly, the urethra dose that has been suggested to be important in brachytherapy related late GU toxicity [32] [33] was not considered in this study since the urethra could not be accurately contoured from our planning CT. Despite these factors, the “hot-spot” model remained quite accurate. Furthermore, our 2-year hot-spot model separated the patients into clinically meaningful groups. There was about 25% risk of grade 1 or above late urinary toxicity for patients received < 78Gy to the hottest 2.9% of bladder, for the others, there is about 50% risk of late GU toxicity (Fig. 6).
Future work
We analyzed late urinary toxicity data from 128 patients treated with external beam radiotherapy for prostate cancer to 78Gy on a randomized trial [1]. Similar to some other studies [22,34], the rate of late GU toxicity for these patients continued to increase with time for at least 8 years (Fig. 1). The rates of late rectal toxicity [7] and radiation induced erectile dysfunction [35] usually plateau after two years post RT, Therefore, data with 2-year follow-up is generally considered adequate for analysis of these endpoints. In the case of late GU toxicity, the choice of time point is not as clear as the cumulative incidence of late GU toxicity does not seem to level out [25] [26] [27]. Our data here suggest an initial wave of mostly grade 1 toxicities occurring within the first 2 years (Fig. 1 and Fig. 6), which may be distinct from the GU toxicity occurring later, appear to be adequate for NTCP modeling. Thus the curve separation occurs in Fig. 6 is mainly due to events occurring already by 2 years. Additional work is needed and are ongoing to model GU toxicity occurring later than 2 years that is consisted of relatively more grade 2 or above events. This will require a novel method of analysis allowing for censored time-to-toxicity data.
Conclusion
We here report the first evidence that supports the ‘hottest volume” model as potentially the best fitting model for predicting GU toxicity after external beam radiotherapy for prostate cancer. Confirming data are needed from other investigators. Particular attention should be given to hot spots higher than 78Gy in bladder in radiation treatment planning.
Acknowledgment
Supported in part by grant R01-CA104342 from the National Cancer Institute, National Institutes of Health.
Footnotes
Publisher's Disclaimer: This is a PDF file of an unedited manuscript that has been accepted for publication. As a service to our customers we are providing this early version of the manuscript. The manuscript will undergo copyediting, typesetting, and review of the resulting proof before it is published in its final citable form. Please note that during the production process errors may be discovered which could affect the content, and all legal disclaimers that apply to the journal pertain.
There is no conflict of interest.
Reference
- 1.Pollack A, Zagars GK, Starkschall G, et al. Prostate cancer radiation dose response: results of the M. D. Anderson phase III randomized trial. Int J Radiat Oncol Biol Phys. 2002;53:1097–1105. doi: 10.1016/s0360-3016(02)02829-8. [DOI] [PubMed] [Google Scholar]
- 2.Cheung R, Tucker SL, Lee AK, et al. The dose response characteristics of low and intermediate risk prostate cancer treated with external beam radiotherapy. Int J Radiat Oncol Biol Phys. 2004 doi: 10.1016/j.ijrobp.2004.07.723. In Press. [DOI] [PubMed] [Google Scholar]
- 3.Cheung R, Tucker SL, Lee AK, et al. Assessing the impact of an alternative biochemical failure definition on radiation dose response for high-risk prostate cancer treated with external beam radiotherapy. Int J Rad Onc Biol Phys. 2004 doi: 10.1016/j.ijrobp.2004.04.064. [DOI] [PubMed] [Google Scholar]
- 4.Hanks GE, Coia LR, Curry J. Patterns of care studies: Past, present, and future. Seminars in Radiation Oncology. 1997;7:97–100. doi: 10.1053/SRAO00700097. [DOI] [PubMed] [Google Scholar]
- 5.Lee WR, Hanks GE, Hanlon AL, et al. Lateral rectal shielding reduces late rectal morbidity following high dose three-dimensional conformal radiation therapy for clinically localized prostate cancer: further evidence for a significant dose effect. Int J Radiat Oncol Biol Phys. 1996;35:251–257. doi: 10.1016/0360-3016(96)00064-8. [DOI] [PubMed] [Google Scholar]
- 6.Storey MR, Pollack A, Zagars G, et al. Complications from radiotherapy dose escalation in prostate cancer: preliminary results of a randomized trial. Int J Radiat Oncol Biol Phys. 2000;48:635–642. doi: 10.1016/s0360-3016(00)00700-8. [DOI] [PubMed] [Google Scholar]
- 7.Cheung R, Tucker SL, Ye JS, et al. Characterization of rectal normal tissue complication probability after high-dose external beam radiotherapy for prostate cancer. Int J Radiat Oncol Biol Phys. 2004;58:1513–1519. doi: 10.1016/j.ijrobp.2003.09.015. [DOI] [PubMed] [Google Scholar]
- 8.Tucker SL, Cheung R, Dong L, et al. Dose-volume response analyses of late rectal bleeding after radiotherapy for prostate cancer. Int J Radiat Oncol Biol Phys. 2004;59:353–365. doi: 10.1016/j.ijrobp.2003.12.033. [DOI] [PubMed] [Google Scholar]
- 9.Tucker SL, Dong L, Cheung R, et al. Comparison of rectal dose-wall histogram versus dose-volume histogram for modeling the incidence of late rectal bleeding after radiotherapy. Int J Radiat Oncol Biol Phys. 2004 doi: 10.1016/j.ijrobp.2004.07.712. [DOI] [PubMed] [Google Scholar]
- 10.Cox JD, Stetz J, Pajak TF. Toxicity criteria of the Radiation Therapy Oncology Group (RTOG) and the European Organization for Research and Treatment of Cancer (EORTC) Int J Radiat Oncol Biol Phys. 1995;31:1341–1346. doi: 10.1016/0360-3016(95)00060-C. [DOI] [PubMed] [Google Scholar]
- 11.Pavy JJ, Denekamp J, Letschert J, et al. EORTC Late Effects Working Group. Late Effects toxicity scoring: the SOMA scale. Radiother Oncol. 1995;31:1341–1346. doi: 10.1016/0167-8140(95)97448-m. [DOI] [PubMed] [Google Scholar]
- 12.Teshima T, Hanks GE, Hanlon AL, et al. Rectal bleeding after conformal 3D treatment of prostate cancer: time to occurrence, response to treatment and duration of morbidity. Int J Radiat Oncol Biol Phys. 1997;39:77–83. doi: 10.1016/s0360-3016(97)00301-5. [DOI] [PubMed] [Google Scholar]
- 13.Pollack A, Zagars GK, Smith LG, et al. Preliminary results of a randomized radiotherapy dose-escalation study comparing 70 Gy with 78 Gy for prostate cancer. J Clin Oncol. 2000;18:3904–3911. doi: 10.1200/JCO.2000.18.23.3904. [DOI] [PubMed] [Google Scholar]
- 14.Lyman JT, Wolbarst AB. Optimization of radiation therapy, III: A method of assessing complication probabilities from dose-volume histograms. Int J Radiat Oncol Biol Phys. 1987 Jan;13(1):103–109. doi: 10.1016/0360-3016(87)90266-5. 1987;13. [DOI] [PubMed] [Google Scholar]
- 15.Burman C, Kutcher GJ, Emami B, Goitein M. Fitting of normal tissue tolerance data to an analytic function. Int J Radiat Oncol Biol Phys. 1991;21:123–135. doi: 10.1016/0360-3016(91)90172-z. [DOI] [PubMed] [Google Scholar]
- 16.Mohan R, Mageras GS, Baldwin B, et al. Clinically relevant optimization of 3-D conformal treatments. Med Phys. 1992;19:933–944. doi: 10.1118/1.596781. [DOI] [PubMed] [Google Scholar]
- 17.Tucker SL, Liu HH, Wang S, et al. Dose-volume modeling of the risk of postoperative pulmonary complications among esophageal cancer patients treated with concurrent chemoradiotherapy followed by surgery. Int J Radiat Oncol Biol Phys. 2006;66:754–761. doi: 10.1016/j.ijrobp.2006.06.002. [DOI] [PubMed] [Google Scholar]
- 18.Hanley JA, McNeil BJ. The meaning and use of the area under a receiver operating characteristic (ROC) curve. Radiology. 1982;143:29–36. doi: 10.1148/radiology.143.1.7063747. [DOI] [PubMed] [Google Scholar]
- 19.Leibel SA, Fuks Z, Zelefsky MJ, et al. Technological advances in external-beam radiation therapy for the treatment of localized prostate cancer. Semin Oncol. 2003;30:596–615. doi: 10.1016/s0093-7754(03)00354-3. [DOI] [PubMed] [Google Scholar]
- 20.Zelefsky MJ, Fuks Z, Hunt M, et al. High dose radiation delivered by intensity modulated conformal radiotherapy improves the outcome of localized prostate cancer. Journal of Urology. 2001;166:876–881. [PubMed] [Google Scholar]
- 21.Schultheiss TEH GE, Hunt MA, Lee WR. Incidence of and factors related to late complications in conformal and conventional radiation treatment of cancer of the prostate. Int J Radiat Oncol Biol Phys. 1995;32:643–649. doi: 10.1016/0360-3016(95)00149-s. [DOI] [PubMed] [Google Scholar]
- 22.Zelefsky MJ, Cowen D, Fuks Z, et al. Long term tolerance of high dose three-dimensional conformal radiotherapy in patients with localized prostate carcinoma. Cancer. 1999;85:2460–2468. doi: 10.1002/(sici)1097-0142(19990601)85:11<2460::aid-cncr23>3.0.co;2-n. [DOI] [PubMed] [Google Scholar]
- 23.Peeters ST, Heemsbergen WD, van Putten WL, et al. Acute and late complications after radiotherapy for prostate cancer: results of a multicenter randomized trial comparing 68 Gy to 78 Gy. Int J Radiat Oncol Biol Phys. 2005;61:1019–1034. doi: 10.1016/j.ijrobp.2004.07.715. [DOI] [PubMed] [Google Scholar]
- 24.Michalski JM, Winter K, Purdy JA, et al. Toxicity after three-dimensional radiotherapy for prostate cancer on RTOG 9406 dose Level V. Int J Radiat Oncol Biol Phys. 2005;62:706–713. doi: 10.1016/j.ijrobp.2004.11.028. [DOI] [PubMed] [Google Scholar]
- 25.Marks LB, Carroll PR, Dugan TC, Anscher MS. The response of the urinary bladder, urethra, and ureter to radiation and chemotherapy. Int J Radiat Oncol Biol Phys. 1995;31:1257–1280. doi: 10.1016/0360-3016(94)00431-J. [DOI] [PubMed] [Google Scholar]
- 26.Gardner BG, Zietman AL, Shipley WU, et al. Late normal tissue sequelae in the second decade after high dose radiation therapy with combined photons and conformal protons for locally advanced prostate cancer. J Urol. 2002;167:123–126. [PubMed] [Google Scholar]
- 27.Zelefsky MJ, Cowen D, Fuks Z, et al. Long term tolerance of high dose three-dimensional conformal radiotherapy in patients with localized prostate carcinoma. Cancer. 1999;85:2460–2468. doi: 10.1002/(sici)1097-0142(19990601)85:11<2460::aid-cncr23>3.0.co;2-n. [DOI] [PubMed] [Google Scholar]
- 28.Skwarchuk MW, Jackson A, Zelefsky MJ, et al. Late rectal toxicity after conformal radiotherapy of prostate cancer (I): multivariate analysis and dose-response. International Journal of Radiation Oncology, Biology, Physics. 2000;47:103–113. doi: 10.1016/s0360-3016(99)00560-x. [DOI] [PubMed] [Google Scholar]
- 29.Emami BLJ, Brown A, Coia L, Goitein M, Munzenrider JE, Shank B, Solin LJ, Wesson M. Tolerance of normal tissue to therapeutic irradiation. Int J Radiat Oncol Biol Phys. 1991;21:109–122. doi: 10.1016/0360-3016(91)90171-y. [DOI] [PubMed] [Google Scholar]
- 30.Luxton G, Hancock SL, Boyer AL. Dosimetry and radiobiologic model comparison of IMRT and 3D conformal radiotherapy in treatment of carcinoma of the prostate. Int J Radiat Oncol Biol Phys. 2004;59:267–284. doi: 10.1016/j.ijrobp.2004.01.024. [DOI] [PubMed] [Google Scholar]
- 31.O'Daniel J, Dong L, Bonnen M, et al. The dosimetric impact of daily CT alignment on prostate cancer radiotherapy. In Preparation. [Google Scholar]
- 32.Allen ZA, Merrick GS, Butler WM, et al. Detailed urethral dosimetry in the evaluation of prostate brachytherapy-related urinary morbidity. Int J Radiat Oncol Biol Phys. 2005;62:981–987. doi: 10.1016/j.ijrobp.2004.12.068. [DOI] [PubMed] [Google Scholar]
- 33.Albert M, Tempany CM, Schultz D, et al. Late genitourinary and gastrointestinal toxicity after magnetic resonance image-guided prostate brachytherapy with or without neoadjuvant external beam radiation therapy. Cancer. 2003;98:949–954. doi: 10.1002/cncr.11595. [DOI] [PubMed] [Google Scholar]
- 34.Eifel PJ, Levenback C, Wharton JT, Oswald MJ. Time course and incidence of late complications in patients treated with radiation therapy for FIGO stage IB carcinoma of the uterine cervix. Int J Radiat Oncol Biol Phys. 1995;32:1289–1300. doi: 10.1016/0360-3016(95)00118-I. [DOI] [PubMed] [Google Scholar]
- 35.Selek U, Cheung R, Lii M, et al. Erectile dysfunction and radiation dose to penile base structures: a lack of correlation. Int J Radiat Oncol Biol Phys. 2004;59:1039–1046. doi: 10.1016/j.ijrobp.2003.12.028. [DOI] [PubMed] [Google Scholar]


