Abstract
Introduction:
Lateral parapharyngeal wall (LPW) thickness may be a predominant anatomic factor causing airway narrowing in apneic subjects. In this study, we explored sonographic measurement of the LPW thickness and compared the results with LPW thickness measured by magnetic resonance imaging (MRI). We also investigated the association between sonographic measurement of LPW thickness and apnea-hypopnea index (AHI).
Method:
Seventy-six patients with suspected obstructive sleep apnea (OSA) underwent ultrasound examination of LPW thickness after overnight polysomnography. Fifteen out of 76 subjects also participated in correlation and reliability studies of sonographic and MRI measurements of LPW thickness.
Results:
There was good correlation between measurements of LPW thickness on ultrasound and MRI (r = 0.78, P = 0.001), although Bland-Altman analysis indicated overestimation of LPW thickness by ultrasound, when compared with the LPW as measured by MRI. The sonographic measurement of LPW thickness had high reproducibility, with intraclass correlation coefficients of 0.90 and 0.97 for intraoperator and interoperator reliability, respectively. Fifty-eight subjects with significant OSA (AHI ≥ 10/h) had a higher body mass index, larger neck circumference, and greater LPW thickness measured by ultrasound than those (n = 18) with an AHI of less than 10 per hour. LPW thickness had a positive correlation with AHI on univariate analysis (r = 0.37, P = 0.001). On multivariate analysis, LPW thickness had a positive independent association with AHI after adjustment for age, sex, neck circumference, and body mass index. The positive association of LPW thickness with AHI remained significant in both univariate and multivariate analyses of men only (n = 62).
Conclusions:
Sonographic measurement of LPW thickness is a novel and reliable technique and had good correlations with measurement by MRI and the severity of OSA. Ultrasound may provide an alternative imaging modality with easy accessibility and lower cost in OSA research.
Citation:
Liu HK; Chu WCW; To KW; Ko FWS; Tong MWC; Chan JWS; Hui DS. Sonographic measurement of lateral parapharyngeal wall thickness in patients with obstructive sleep apnea. SLEEP 2007;30(11):1503-1508.
Keywords: Lateral parapharyngeal wall thickness, obstructive sleep apnea, ultrasound, magnetic resonance imaging
OBSTRUCTIVE SLEEP APNEA (OSA) IS A COMMON FORM OF SLEEP-DISORDERED BREATHING CHARACTERIZED BY REPETITIVE EPISODES OF PARTIAL OR COMPLETE upper airway obstruction causing sleep fragmentation and symptoms.1 OSA syndrome is equally common among the middle-aged male Caucasian and Asian populations, with a prevalence of at least 4%.2–4 Most patients with OSA have an anatomically small upper airway with augmented pharyngeal dilator muscle activation maintaining airway patency awake but not asleep.5 Obesity is the most important risk factor in the pathogenesis of OSA in middle-aged adults.6 Craniofacial abnormality also plays an important role in OSA, especially in Asian populations. Although Asian patients with OSA are generally less obese than their Caucasian counterparts, craniofacial abnormalities such as a low hyoid bone and retro-position of the maxilla or mandible are common predisposing factors for OSA in Asian populations.7,8
Fat deposits in the tongue and soft tissues surrounding the upper airspace may narrow the airway during wakefulness.9 It has been suggested that thickness of the lateral parapharyngeal muscular walls demonstrated on magnetic resonance imaging (MRI) rather than enlargement of parapharyngeal fat pads was the predominant anatomic factor causing airway narrowing in apneic subjects.10 However MRI is an expensive imaging modality that is not readily available in most clinical settings. Ultrasound is a simple imaging technique that can demonstrate part of the anatomic structures surrounding the upper airway, and the thickness of the lateral parapharyngeal wall (LPW) can be measured in an oblique coronal plane close to the imaging plane on MRI. The aims of this study were to explore the potential role of ultrasound imaging in the evaluation of the upper airway in subjects with suspected OSA by comparing measurements of the LPW thickness based on ultrasound and MRI. In addition, we investigated if there was any association between the LPW thickness based on sonographic measurement and the severity of OSA.
SUBJECTS AND METHODS
We recruited 61 consecutive Chinese subjects who were referred to our respiratory clinic, Prince of Wales Hospital, with snoring and other symptoms suggestive of OSA for ultrasound measurement. For the purpose of the reliability and correlation studies, another 15 consecutive Chinese patients with the same inclusion criteria and symptoms suggestive of OSA were recruited for both ultrasound and MRI examinations. Informed written consents were obtained from all the subjects who participated in the study.
SLEEP STUDY
All 76 subjects had overnight polysomnography performed. Significant OSA was arbitrarily defined as an apnea-hypopnea index (AHI) of 10 or more events per hour of sleep, as shown by overnight polysomnography (Healthdyne Alice 4, Atlanta, GA) plus self-reported sleepiness.7,11 Overnight polysomnography recorded electroencephalogram, electrooculogram, submental electromyogram, bilateral anterior tibial electromyograms, electrocardiogram, chest and abdominal wall movement by inductance plethysmography, and airflow by a nasal pressure transducer (PTAF 2; Pro-Tech; Woodinville, WA) supplemented by an oronasal thermistor and finger pulse oximetry, as in our previous studies.7,11 Sleep stages were scored according to standard criteria by Rechtschaffen and Kales.12 Apnea was defined as cessation of airflow for at least 10 seconds, and hypopnea was defined as a 50% or greater reduction in airflow for at least 10 seconds plus an oxygen desaturation of more than 3% or an arousal. An arousal was scored if there was a 3-second or longer abrupt shift in electroencephalogram frequency to alpha or theta or above 16 Hz, following at least 10 seconds of sleep, and, if arising in rapid eye movement sleep, there must be a rise in electromyographic tone.13 Body weight and height were recorded, and the body mass index (BMI) was calculated. Neck circumference was measured at the level of the cricothyroid membrane, with the patient in the upright position.14
Ultrasound Examination
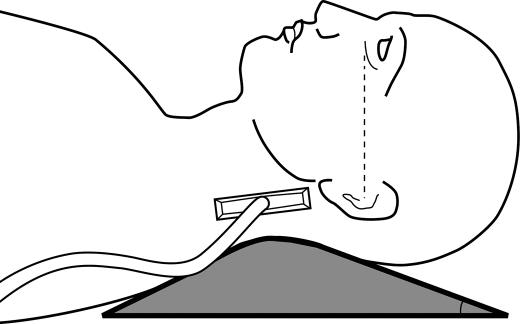
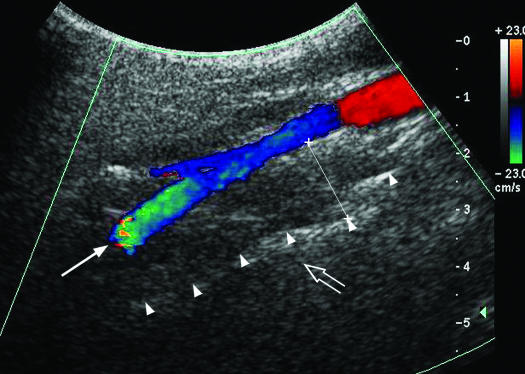
All 76 subjects underwent ultrasound examination of the LPW thickness the day after overnight polysomnography. An ATL HDL5000 (Bothell, CA) with C5-2 or C7-5 MHz curvilinear transducer was used. All the measurements were made by the same operator (LKH), who was experienced in ultrasound scanning and was blinded to the polysomnographic data. Patients lay supine on the examination couch. The neck of the patient was slightly extended, with the infraorbital meatal baseline (the line joining infraorbital margin and ear tragus) perpendicular to the scanning table. A 35° soft pad was put under the neck (Figure 1). The oblique coronal plane of the parapharyngeal space was scanned with the transducer longitudinally placed on the lateral side of the neck, just underneath the lateral border of the occipital bone. The long axis of the ipsilateral internal carotid artery was identified with color application (Figure 2). The lateral wall of the pharynx appeared as an echogenic line on real-time ultrasound, whereas the lumen of the pharynx was completely obscured by gas shadowing. Vibration artifacts occasionally occurred when the subjects swallowed, which also helped to confirm the location of pharynx. The distance between the internal carotid artery and the echogenic surface of pharynx represented the LPW thickness in an oblique coronal plane. The airway distension was viewed dynamically with grayscale real-time ultrasound. All the measurements were recorded on frozen images when the lateral wall of the pharynx moved farthest away from the transducer (i.e., presumably the airway decreased to its smallest caliber). The maximum thickness of LPW on both sides was measured 3 times on 3 separate images, and the mean value was obtained for analysis. Values on both sides of the neck were summed to determine the total LPW thickness measured by ultrasound.
Figure 1.
Scanning position of the lateral parapharyngeal wall. Patient lies supine on a 350 soft pad, with the infraorbital meatal baseline perpendicular to the scanning table. The transducer is placed longitudinally on the lateral side of the neck, just inferior to the occiput. The dotted line indicates the infraorbital meatal baseline.
Figure 2.
Ultrasound image of the lateral parapharyngeal wall. The internal carotid artery is shown by Doppler imaging (long arrow), and the lateral wall of pharynx is represented by the echogenic interface (arrow heads) while the lumen cannot be clearly appreciated due to complete obscuration by gas shadowing (open arrow). The lateral parapharyngeal wall thickness is measured with caliber x——x.
Reliability Study
Fifteen subjects were invited to participate in the reliability study of sonographic measurement. They were scanned and repositioned by 2 operators (LKH, CJW) independently on the same day for the assessment of interoperator reliability, and each operator was blinded to the examination results of the other operator. The subjects were then scanned by LKH again 2 to 3 weeks later to determine intraoperator reliability.
MRI Studies
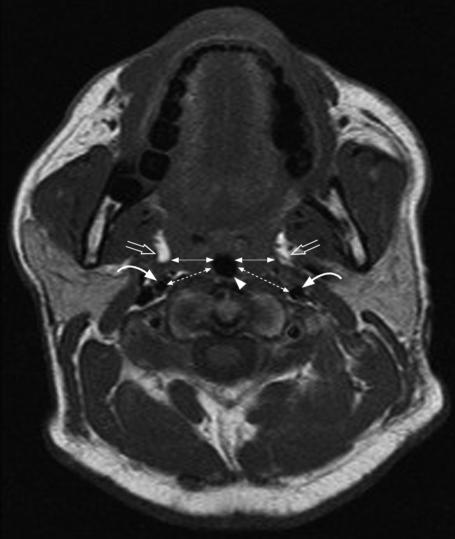
MRI studies were performed on the 15 subjects who had participated in the sonographic measurement reliability study. MRI was performed with the subjects lying supine in a 1.5-Tesla imager (Sonata, Siemens, Erlanger, Germany) with head and neck coil. Spin-echo T1-weighted consecutive axial images with slice thickness of 4 mm were obtained from just above the hard palate to the level of the sixth cervical vertebra. The head was positioned in a neutral position by aligning the Frankfurt plane (a plane from the soft tissue orbit to the superior portion of the tragus of the ear) perpendicular to the scanning table.10 All subjects were asked to breathe through the nose with the mouth closed and to avoid swallowing during scanning. The T1-weighed Turbo spin-echo sequence included a repetition time of 472 milliseconds, an echo time of 13 milliseconds, a flip angle of 900, and a field of view of 23 cm. The criteria for measurement of LPW thickness on MRI was adopted from previous studies that documented good association between LPW thickness and OSA and airway narrowing.10,15,16 From the magnetic resonance image with the smallest airway cross-sectional area, the transverse dimension of the LPW (LPW-transverse) thickness on both sides was measured, and this was defined as the distance between the medial border of parapharyngeal fat pads and the lateral edge of the airway (Figure 3).10 In the same image, additional measurements of the oblique transverse dimension of the lateral parapharyngeal wall (LPW-oblique) thickness between the internal carotid artery and the lateral edge of the airway were made (Figure 3). Values on both sides of the neck were summed to determine the total LPW-transverse and LPW-oblique thickness measured by MRI.
Cross-sectional magnetic resonance image (MRI) showing measurement of the lateral parapharyngeal wall (LPW) thickness at the retropalatal level. ◀—▶indicates the LPW-transverse thickness measured on MRI. Lateral parapharyngeal fat pads are indicated by open arrows, airway is indicated by arrow head and internal carotid arteries are indicated by curved arrows. ⇠⇢ Indicates the LPW-oblique thickness measured on MRI.
Statistical Analysis
All data are expressed as mean * SD. Pearson correlation was performed between the LPW thickness measured by ultrasound and that measured by MRI. A Student t test was performed to compare the mean values of the subjects with and without significant OSA. Bland-Altman analysis was performed to evaluate the agreement between the LPW thickness measured by ultrasound and that measured by MRI. The mean of the difference with a bias of ± 1.96 SD denotes the limits of agreement. Intraclass correlation coefficient was used to assess the interoperator and intraoperator reliability of the sonographic measurement of the LPW thickness. Pearson correlation was used to demonstrate any relationship between the LPW thickness and other parameters, including BMI, neck circumference, and AHI. Stepwise multiple linear regression analysis was performed to determine the independent determinants of OSA, with AHI as the dependent variable and the LPW thickness, neck circumference, BMI, age, and sex as independent variables. Both univariate and multivariate analyses were repeated only on men.
RESULTS
The comparison of the clinical features and sonographic measurement between subjects with and without significant OSA is shown in Table 1. There was no significant difference in age between the 2 groups. The subjects with significant OSA had higher BMI, larger neck circumference, and greater LPW thickness measured on ultrasound than did those without significant OSA.
Table 1.
Comparison of Clinical Characteristics and Ultrasound Measurements of Lateral Pharyngeal Wall Thickness Between Subjects with and without Significant Obstructive Sleep Apnea.
| Characteristic | With OSA | Without OSA | P Value |
|---|---|---|---|
| Number of subjects | 58 | 18 | |
| Men : Women | 51:7 | 11:7 | — |
| Age, y | 50.3±10.7 | 53.6±11.2 | 0.26 |
| BMI, kg/m2 | 28.4±4.4 | 25.6±3.1 | 0.016 |
| Neck circumference, cm | 40.1±3.5 | 37.6±3.7 | 0.009 |
| Lateral pharyngeal wall thickness, cm | 4.3±0.7 | 3.8±0.6 | 0.015 |
| AHI, no./h | 37.0±19.9 | 5.7±2.8 | < 0.001 |
| Mean Sao2, % | 93.9±5.5 | 94.6±2.1 | 0.57 |
| Arousal Index, no./h | 27.9±26.1 | 16.3±8.3 | 0.069 |
Data are expressed as mean ± SD. OSA refers to obstructive sleep apnea; BMI, body mass index; AHI, apnea-hypopnea index; Sao2, oxygen saturation.
Ultrasound Versus MRI Measurement of the LPW Thickness in Subjects with Suspected OSA
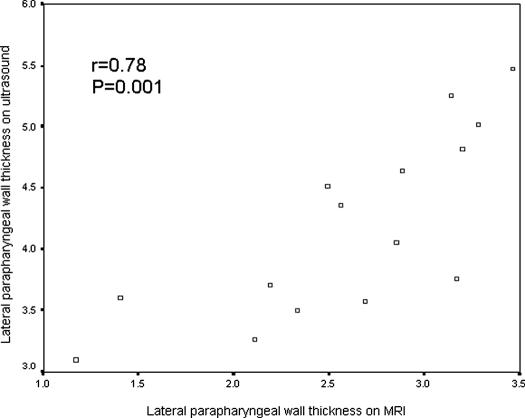
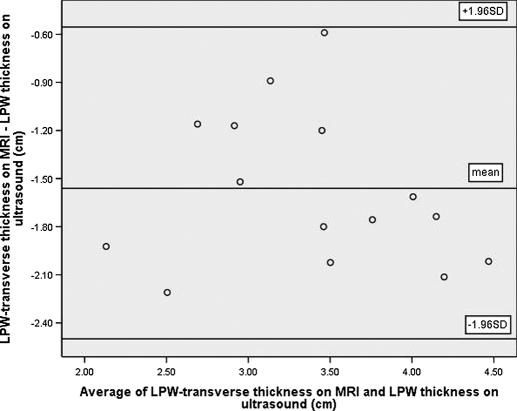
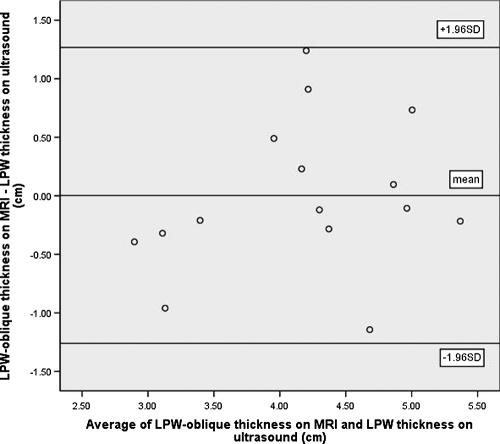
Among the 15 subjects who participated in both ultrasound and MRI examinations, 14 were found to have significant OSA (AHI ≥ 10/h). Their mean age was 51 years (range 41-72 years), and mean BMI was 28.4 kg/m2 (range 22.3-39.1 kg/m2). Sonographic measurement of the LPW thickness had high reproducibility, with intraclass correlation coefficients of 0.90 (95% confidence intervals [CI]: 0.71-0.97; standard error of measurement: 0.24cm) and 0.97 (95% CI: 0.92-0.99; standard error of measurement: 0.13 cm) for intraoperator and interoperator reliability, respectively. There was good correlation between the LPW thickness measured by ultrasound and LPW-transverse thickness measured by MRI (r = 0.78, P = 0.001) (Figure 4). The Bland-Altman plots showed poor agreement between ultrasound and MRI measurements because all LPW thickness measured by ultrasound overestimated LPW-transverse thickness measured by MRI, with the limits of agreement (-0.62 cm; −2.54 cm) (Figure 5). For the additional measurements of LPW-oblique thickness on MRI, Bland-Altman plots showed much closer agreement between ultrasound and MRI measurements, with limits of agreements (1.28cm; −1.30cm) (Figure 6).
Figure 4.
Pearson correlation between the lateral parapharyngeal wall (LPW) thickness on ultrasound and LPW-transverse thickness measured by magnetic resonance imaging (MRI).
Figure 5.
Bland-Altman plot demonstrates poor agreement between lateral parapharyngeal wall (LPW)-transverse thickness measured by magnetic resonance imaging (MRI) and LPW thickness measured by ultrasound. Due to the differences in both the site and the plane of measurements, all LPW thickness measurements are overestimated on ultrasound (limits of agreements: −0.62cm; −2.54cm).
Figure 6.
Bland-Altman plot demonstrates closer agreement between lateral parapharyngeal wall (LPW)-oblique thickness on magnetic resonance imaging (MRI) and LPW thickness on ultrasound, with limits of agreements: (1.28cm; −1.30cm).
Independent Factors Associated with AHI
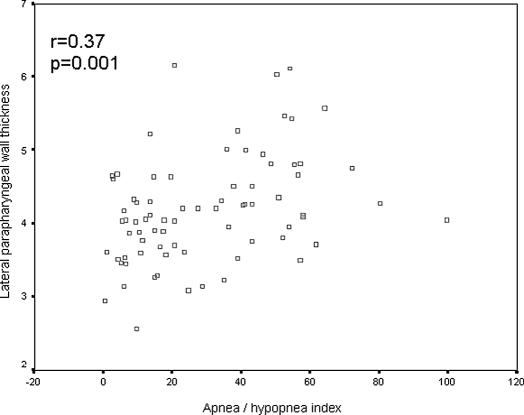
There was a positive correlation between AHI and the LPW thickness measured on ultrasound (r = 0.37, P = 0.001) (Figure 7). AHI also had positive correlations with neck circumference (r = 0.34, P = 0.002) and with BMI (r = 0.34, P = 0.003). On forward stepwise multiple linear regression analysis, the LPW thickness had a positive and independent association (r2 = 0.12, P = 0.002) with AHI after adjustment for age, sex, neck circumference, and BMI. The other variables had no significant association with AHI. When data from the 14 women were excluded and the analyses were repeated on men only (n = 62), the LPW thickness maintained its significant association with AHI on Pearson correlation (r = 0.35, P = 0.006) and forward stepwise multiple regression (r2 = 0.099, P = 0.013).
Figure 7.
Pearson correlation between the lateral parapharyngeal wall thickness measured on ultrasound and the apnea-hypopnea index.
DISCUSSION
To the best of our knowledge, this has been the first study to explore the potential role of ultrasound imaging in assessing parapharyngeal soft tissue structure in relation to OSA. Using novel sonographic imaging techniques, we have demonstrated good intraoperator and interoperator reliability for ultrasound measurement of the LPW thickness, and there was close correlation (r = 0.78) between ultrasound and MRI measurements of the LPW thickness. We have also shown that the LPW thickness measured by ultrasound was higher in subjects with significant OSA than those without, whereas the LPW thickness had significant and independent positive correlation with AHI on multivariate analysis. The association of LPW thickness with AHI remained significant when only male subjects were included for analysis.
Upper airway imaging is a useful research tool that has improved our understanding of the biomechanics, pathophysiology, and treatment of OSA. A number of different imaging modalities have been used to evaluate the upper airway and surrounding structures, including acoustic reflection, fluoroscopy, nasopharyngoscopy, cephalometry, computed tomography, and MRI.17 The LPW thickness measured by MRI has been suggested to play an important role in airway narrowing in patients with OSA. Previous studies have shown that the LPW thickness measured by MRI is larger in apneic than in normal subjects at the site of the smallest airway area,10 with an inverse relationship between airway caliber and the LPW size.18 In addition, it has been shown that the LPW thickness decreases with application of continuous positive airway pressure in normal subjects.18
Although MRI is a noninvasive imaging tool that provides good tissue definition, it is expensive and not easily available. Ultrasound, on the other hand, is a relatively simple and noninvasive imaging tool that is readily available without causing any claustrophobic effects. The LPW thickness measured on ultrasound was at a site close to that measured by MRI. The sonographic measurement at this site was chosen because this was the only location with an appropriate visible landmark (internal carotid artery). The small diameter of the internal carotid artery could help locate the measurement plane within a narrow range and ensure the reproducibility of the sonographic measurements of LPW thickness. The LPW-transverse thickness on MRI was measured in cross-section at a level defined by the smallest airway cross-sectional area, whereas that on ultrasound was measured in an oblique coronal plane defined by anatomic landmarks. Therefore the sites and planes for measurements of LPW thickness on MRI and ultrasound were not the same, and this could account for the degree of overestimation of all LPW thickness on ultrasound when compared with the LPW-transverse thickness on MRI in the Bland-Altman plot. Although there was some discrepancy in the absolute measurements of the LPW thickness on MRI and ultrasound, the values were highly correlated on Pearson correlation. Additional MRI measurements of LPW-oblique thickness were made at locations similar to those obtained by ultrasound. Although these axial slice measurements were still not exactly in the same plane or site as the ultrasound measurements, the Bland-Altman plot showed much closer agreement.
The LPW consists of various muscles, including the hypoglossus, styloglossus, stylohyoid stylopharyngeaus, palatoglossus, palatopharyngeus, and pharyngeal constrictors.10 All of these muscles, together with lymphatic tissues, contribute to the LPW, as defined on MRI and ultrasound, although neither imaging techniques could show the resolution of specific muscles. The increase in size of soft-tissue structures in the LPW might create compressive effect on the airway. The lateral airway narrowing leads to development of an elliptical configuration in the anterior-posterior dimension of the airway, in contrast with the normal airway, which has the longest axis in the lateral dimension.10 This change in configuration might predispose subjects with OSA to airway closure during sleep.10
There is strong evidence that excess weight is a causal factor in OSA.6 In a longitudinal analysis of a subset (n = 690) of the Wisconsin cohort with a 4-year follow-up, Peppard et al19 have shown that a 10% increase in weight is associated with a 6-fold greater risk of developing OSA among persons initially free of OSA. Neck circumference, a surrogate measure of neck fat, seems to be a better predictor of the presence of OSA than is overall obesity.14 However, neck circumference is a gross measurement of a combination of structures, including subcutaneous fat, neck muscle, parapharyngeal fat, and parapharyngeal wall muscle. It remains uncertain which structures in the neck are most important in the pathogenesis of OSA. It has been suggested that fat deposits, particularly at the lateral parapharyngeal space, might play a key role in the pathogenesis of OSA,20,21 whereas other studies have suggested that increased parapharyngeal wall thickness is a major cause of OSA.10,18 Enlargement of soft-tissue structures, particularly the LPW, is associated with an increased likelihood of OSA among patients presenting to sleep disorders centers.22 The results of our study support the idea that parapharyngeal wall thickness correlates with the severity of OSA. Further studies involving more subjects are needed to clarify the contribution of parapharyngeal wall thickness and other structures in the pathogenesis of OSA.
One major limitation of ultrasound imaging is that fat deposit in the neck region cannot be differentiated from other soft-tissue structures, and the association of the fat deposit with OSA could not be evaluated in this study. Another limitation of this study is that, during ultrasound examination, the neck of the patient was slightly extended in order to allow more space for scanning with the transducer. If the neck had not been slightly extended, the acoustic window for visualization of the internal carotid artery and the LPW would have been much reduced by the mandible. The extended-neck position made the subject's head slightly more elevated than that on MRI, which might inadvertently affect the degree of narrowing of airway. However, we believe that this did not significantly affect measurement of the adjacent soft-tissue structures in this study.
In conclusion, we have shown that sonographic measurement of the LPW thickness is a novel and reliable method with a strong correlation with that made by MRI. The sonographic measurement also correlates with the severity of OSA. Sonographic measurement of the LPW thickness provides an alternative tool to MRI and may have the potential of wider application in sleep apnea research in view of its easy accessibility and lower cost.
ACKNOWLEDGMENT
We would like to thank Dr. YL Chan for his advice and the nurses of the Respiratory Medicine Division, The Chinese University of Hong Kong, for their technical support throughout the study. Special thanks are extended to Ms. Ly Mee Yu, Statistician, for her advice in statistical analysis.
Footnotes
Disclosure Statement
This is not an industry supported study. The authors have indicated no financial conflicts of interest.
REFERENCES
- 1.Engleman HM, Douglas NJ. Sleepiness, cognitive function, and quality of life in obstructive sleep apnoea/hypopnoea syndrome. Thorax. 2004;59:618–22. doi: 10.1136/thx.2003.015867. [DOI] [PMC free article] [PubMed] [Google Scholar]
- 2.Young T, Palta M, Dempsey J, Skatrud J, Weber S, Badr S. The occurrence of sleep-disordered breathing among middle-aged adults. N Engl J Med. 1993;329:1230–5. doi: 10.1056/NEJM199304293281704. [DOI] [PubMed] [Google Scholar]
- 3.Ip MS, Lam B, Lauder IJ, et al. A community study of sleep-disordered breathing in middle-aged Chinese men in Hong Kong. Chest. 2001;119:62–9. doi: 10.1378/chest.119.1.62. [DOI] [PubMed] [Google Scholar]
- 4.Hui DS, Ko FW, Chan JK, et al. Sleep disordered breathing and CPAP compliance in a group of commercial bus drivers in Hong Kong. Respirology. 2006;11:723–30. doi: 10.1111/j.1440-1843.2006.00932.x. [DOI] [PubMed] [Google Scholar]
- 5.White DP. Pathogenesis of obstructive and central sleep apnea. Am J Respir Crit Care Med. 2005;172:1363–70. doi: 10.1164/rccm.200412-1631SO. [DOI] [PubMed] [Google Scholar]
- 6.Young T, Skatrud J, Peppard PE. Risk factors for obstructive sleep apnea in adults. JAMA. 2004;291:2013–6. doi: 10.1001/jama.291.16.2013. [DOI] [PubMed] [Google Scholar]
- 7.Hui DS, Ko FW, Chu AS, et al. Cephalometric assessment of craniofacial morphology in Chinese patients with OSA. Respir Med. 2003;97:640–46. doi: 10.1053/rmed.2003.1494. [DOI] [PubMed] [Google Scholar]
- 8.Lam B, Ooi CG, Peh WC, et al. Computed tomographic evaluation of the role of craniofacial and upper airway morphology in obstructive sleep apnea in Chinese. Respir Med. 2004;98:301–7. doi: 10.1016/j.rmed.2003.10.009. [DOI] [PubMed] [Google Scholar]
- 9.Mathew OP, Remmers JE. Respiratory failure of the upper airway. In: Saunders NA, Sullivan CE, editors. Sleep and Breathing. New York: Dekker; 1984. pp. 163–200. [Google Scholar]
- 10.Schwab RJ, Gupta KB, Gefter WB, Metzger LJ, Hoffman EA, Pack AI. Upper airway and soft tissue anatomy in normal subjects and patients with sleep-disordered breathing. Significance of the lateral pharyngeal walls. Am J Respir Crit Care Med. 1995;152:1673–89. doi: 10.1164/ajrccm.152.5.7582313. [DOI] [PubMed] [Google Scholar]
- 11.Hui DS, Ko FW, Fok JP, et al. The effects of nasal CPAP on platelet activation in obstructive sleep apnea. Chest. 2004;125:1768–75. doi: 10.1378/chest.125.5.1768. [DOI] [PubMed] [Google Scholar]
- Rechtschaffen A, Kales A. Los Angeles: Brain Information Service, Brain Information Institute, University of California; 1968. A manual of standardized terminology, techniques and scoring system for sleep stages of human subjects. [Google Scholar]
- 13.EEG arousals: scoring rules and examples: a preliminary report from the Sleep Disorders Atlas Task Force of the American Sleep Disorders Association. Sleep. 1992;15:173–84. [PubMed] [Google Scholar]
- 14.Davies RJ, Stradling JR. The relationship between neck circumference, radiographic pharyngeal anatomy, and the obstructive sleep apnoea syndrome. Eur Respir J. 1990;3:509–14. [PubMed] [Google Scholar]
- 15.Schwab RJ, Pasirstein M, Pierson R, et al. Identification of upper airway anatomic risk factors for obstructive sleep apnea with volumetric magnetic resonance imaging. Am J Respir Crit Care Med. 2003;168:522–30. doi: 10.1164/rccm.200208-866OC. [DOI] [PubMed] [Google Scholar]
- 16.Trudo FJ, Gefter WB, Welch KC, Gupta KB, Maislin G, Schwab RJ. State-related changes in upper airway caliber and surrounding soft-tissue structures in normal subjects. Am J Respir Crit Care Med. 1998;158:1259–70. doi: 10.1164/ajrccm.158.4.9712063. [DOI] [PubMed] [Google Scholar]
- 17.Schwab RJ, Goldberg AN. Upper airway assessment. Radiographic and other imaging techniques. In: Coleman J, editor. Sleep Apnea, Part I. Otolaryngol Clin North Am. Philadelphia: WB Saunders; 1998. pp. 931–68. [DOI] [PubMed] [Google Scholar]
- 18.Schwab RJ, Pack AI, Gupta KB, et al. Upper airway and soft tissue structural changes induced by CPAP in normal subjects. Am J Respir Crit Care Med. 1996;154:1106–16. doi: 10.1164/ajrccm.154.4.8887615. [DOI] [PubMed] [Google Scholar]
- 19.Peppard PE, Young T, Palta M, et al. Longitudinal study of moderate weight change and sleep-disordered breathing. JAMA. 2000;284:3015–21. doi: 10.1001/jama.284.23.3015. [DOI] [PubMed] [Google Scholar]
- 20.Horner RL, Mohiaddin RH, Lowell DG, et al. Sites and sizes of fat deposits around the pharynx in obese patients with obstructive sleep apnoea and weight matched controls. Eur Respir J. 1989;2:613–22. [PubMed] [Google Scholar]
- 21.Shelton KE, Woodson H, Gay S, Suratt PM. Pharyngeal fat in obstructive sleep apnea. Am Rev Respir Dis. 1993;148:462–6. doi: 10.1164/ajrccm/148.2.462. [DOI] [PubMed] [Google Scholar]
- 22.Schellenberg JB, Maislin G, Schwab RJ. Physical findings and the risk for obstructive sleep apnea. Am J Respir Crit Care Med. 2000;162:740–8. doi: 10.1164/ajrccm.162.2.9908123. [DOI] [PubMed] [Google Scholar]


