Abstract
Hepatic homeostasis is essential for survival in critically ill and burned patients. Insulin administration improves survival and decreases infections in these patients. To determine the molecular mechanisms, the aim of the present study was to establish a stress model using primary human hepatocytes (PHHs) and to study the effects of insulin on the hepatic inflammatory signaling cascade. Liver tissue was obtained from general surgical patients, and PHHs were isolated and maintained in culture. Primary hepatocyte cultures were challenged with various doses of lipopolysaccharide (LPS), and the inflammatory signal transcription cascade was determined by real-time PCR. In subsequent experiments, primary hepatocyte cultures were challenged with LPS and insulin was added in various doses. Glucose was determined by colorimetric assays. PHHs treated with 100 μg/mL LPS showed a profound inflammatory reaction with increased expression of interleukin (IL)-6, IL-10, IL-1β, tumor necrosis factor (TNF), and signal transducer and activator of transcription 5 (STAT-5). Insulin at 10 IU/mL significantly decreased IL-6, TNF, and IL-1β at pretranslational levels, an effect associated with decreased STAT-5 mRNA expression (P < 0.05). Glucose concentration and cellular metabolic activity were not different between controls and insulin-treated cells. Based on our results, we suggest that primary hepatocyte cultures can be used to study the effect of LPS on the inflammatory cascade. Insulin decreases hepatic cytokine expression, which is associated with decreased STAT-5 expression.
INTRODUCTION
In critical illness and burns, alterations in glucose metabolism occur, including hyperglycemia associated with insulin resistance (1). During the acute phase, postburn adaptive activation of endocrine responses take place, including increased release of catecholamines, cortisol, and glucagon and reduced glucose uptake capacity. In prolonged critical illness, neuroendocrine changes and associated hyperglycemia lead to more extensive metabolic changes that may be associated with development of complications and poor prognosis (2,3). A recent study showed that patients with hyperglycemia had higher infarct segment length, higher myocardial performance index, and lower transmitral Doppler flow, pulmonary flow analysis, and ejection fraction compared with normoglycemic patients. Plasma interleukin (IL)-18, C-reactive protein (CRP), and cytotoxic T cells were higher in the hyperglycemic than in normoglycemic patients. Thus, hyperglycemia is associated with increased levels of inflammatory markers, enhanced expression of cytotoxic T cells, and reduced expression of T cells, which are implicated in limiting the immune process during myocardial infarction (4). The adverse outcome associated with hyperglycemia led van den Berghe and colleagues (5,6) to conduct multiple clinical studies. They showed that insulin administered to maintain glucose at levels lower then 110 mg/dL decreased mortality in surgically and critically ill patients and prevented the incidence of infections, sepsis, and sepsis-associated multiorgan failure (5). Ellger et al. (7) confirmed improved survival with the use of insulin in rabbits undergoing open-heart manipulation. In a recent intent-to-treat study, the effects of insulin in medical ICU patients were investigated (6). Intensive insulin therapy did not significantly reduce in-hospital mortality but significantly reduced newly acquired kidney injury, accelerated weaning from mechanical ventilation, and resulted in earlier discharge from the ICU and the hospital. Recent in vitro and in vivo studies investigated the effect of glucose on the signaling cascade and cytokines in smooth muscle and endothelial cells. Data suggest that hyperglycemia increases reactive oxygen species (ROS) resulting in increased phospholipase A2 and C and nuclear factor-κB (NF-κB). Increased NF-κB stimulates tumor necrosis factor (TNF) expression, which in an autocrine fashion increases ROS. TNF, IL-1, and IL-6 also inhibit insulin signaling, which exacerbates inflammation and ROS formation (8–11).
The liver, as one of the main metabolic and inflammatory organs, plays a major role after stress and, therefore, our group focused its research effort on the hepatic poststress response. To determine the cellular and molecular effects of insulin on liver, we proposed that an in vitro model would be most suitable to study the molecular and signaling effects of insulin. Therefore, the aim of the present study was two-fold. First, we tested the hypothesis that adult primary human hepatocytes undergo a stress response and, therefore, can be used as a system to study the effect of stress on the liver. Second, we aimed to determine whether insulin administration to primary human hepatocytes (PHHs) alters the hepatic stress and signaling response, and whether we find indicators for insulin acting as an antiinflammatory mediator per se or exerting its effects through modulation of glucose serum levels.
MATERIALS AND METHODS
Reagents
Collagenase (type IV), HEPES, Earle’s balanced salt solution (EBSS), and other buffer supplements were purchased from Sigma (Taufkirchen, Germany). Collagen I–coated plates (Biocoat) were purchased from BD (Bedford, UK), Percoll from Amersham, and fetal calf serum (FCS) from Biochrom (Berlin, Germany). Dulbecco’s modified Eagle’s medium (DMEM) with 4.5 g/L glucose was obtained from Biowhittaker (Verviers, Belgium), and all other media additives were purchased from Serva (Heidelberg, Germany).
Hepatocyte Preparation and Culture
Tissue samples from human liver resection were obtained from patients undergoing partial hepatectomy for metastatic liver tumors of colorectal cancer. The tissue was obtained at the furthest site possible from the cancer to avoid oncogenic or inflammatory effects on the normal liver tissue by the primary disease. Experimental procedures were performed according to the guidelines of the charitable state-controlled foundation, Human Tissue and Cell Research (HTCR), with informed patient’s consent (12) and approved by the local ethics committee of the University of Regensburg. Human hepatocytes were isolated using a modified two-step EGTA/ collagenase perfusion procedure and maintained in culture as described (13,14). Viability of isolated hepatocytes was determined by trypan blue exclusion, and cells with viability >85% were used for cell culture. Cells were plated on collagen-precoated six-well plates at a density of 1.2 × 10⁵ cells/cm2 in an appropriate volume of culture media. The medium consisted of DMEM with 10% FCS, 2 mM l-glutamine, and supplements (7.3 ng/mL glucagon, 0.5 mU/mL insulin, 8 μg/mL hydrocortisone, 100 μg/mL streptomycin, and 100 U/mL penicillin). After 16 h of plating, the medium was replaced with medium without serum and insulin. Cells were incubated at 37°C in a humidified incubator with 5% CO2, and media were changed daily unless otherwise stated. Viability of hepatocytes during the culture period was monitored by cell morphology (light microscopy, image analysis) and determination of enzyme release into culture medium (AST activity).
The importance of nonparenchymal cells to mount a response to a lipopolysaccharide (LPS) challenge was demonstrated when these cells were removed from the PHH culture by an additional purification step (Percoll purification) (15). It was recently shown that direct contact between hepatocytes and Kupffer cells affects cell function and viability of both types of cells (16).
Additionally, we performed a Percoll purification step to determine the composition of the primary hepatocyte fractions and virtually removed Kupffer, endothelial, and hepaticstellate cells. Because cytokine activation was very low (1/20 to 1/40) in Percoll-purified PHH, all activation experiments were carried out without the second purification step.
Quantification of mRNA Expression by Real-Time PCR
RNA was isolated from the purified cells, and PCR was performed for various sequences of parenchymal and nonparenchymal liver cells. Integrity of the RNA was verified by agarose gel electrophoresis and by visualization of ribosomal RNA by ethidium bromide staining. First-strand cDNA was synthesized using 1 μg total RNA and the avian myeloblastosis virus reverse transcription reaction (Promega, Madison, WI, USA). Transcript levels were quantified using real-time RT-PCR technology (Lightcycler, Roche, Penzberg, Germany). The QuantiTect Primer Assay for CD31 (QT00081172) was obtained from Qiagen (Hilden, Germany). The sense and reverse primers are shown in Table 1.
Table 1.
Oligonucleotide sequence for real-time PCR
| Sequence, 5′to 3′ | Sequence length, bp | Concentration, mM | Annealing temperature, °C | ||
|---|---|---|---|---|---|
| β-Actin | Forward
Reverse |
AGA GGG AAA TCG TGC GTG AC
CAA TAG TGA TGA CCT GGC CGT |
138 | 3 | 62 |
| GAPDH | Forward
Reverse |
GCG GGG CTC TCC AGA ACA TCA T
CCA GCC CCA GCG TCA AAG GTG |
301 | 3 | 64 |
| IL-1β | Forward
Reverse |
CAG GCC GCG TCA GTT GTT GT
CCG GAG CGT GCA GTT CAG TG |
195 | 3 | 60 |
| TNF-α | Forward
Reverse |
CGC CAC CAC GCT CTT CTG C
ACG GCG ATG CGG CTG ATG |
354 | 2 | 64 |
| IL-6 | Forward
Reverse |
CCC AGT ACC CCC AGG AGA AGA
GTT GGG TCA GGG GTG GTT ATT G |
426 | 3 | 60 |
| IL-10 | Forward
Reverse |
GAC CCA GCC CCT TGA GAA ACC T
GCC CCA AGC CCA GAG ACA AGA T |
359 | 3 | 64 |
| IFN-γ | Forward
Reverse |
GGG TTC TCT TGG CTG TTA CT
TTG GCT CTG CAT TAT TTT TC |
166 | 3 | 58 |
| STAT-5 | Forward
Reverse |
TCA TCA TCG AGA AGC AGC C
TTC CGT CAC AGA CTC TGC AC |
317 | 3 | 60 |
| α-SMA | Forward
Reverse |
CGT GGC TAT TCC TTC GTT AC
TGC CAG CAG ACT CCA TCC |
174 | 3 | 57 |
| CD68 | Forward
Reverse |
AGC CCA GGA TTC ACC AGT T
GGT TTT GTT GGG GTT CAG TAC |
144 | 3 | 57 |
| Albumin | Forward
Reverse |
GCTGCCATGGAGATCTGCTTGA
GCAAGTCAGCAGGCATCTCATC |
174 | 3 | 53 |
| CK18 | Forward
Reverse |
CCCGCTACGCCCTACAGA
GCGGGTGGTGGTCTTTTG |
248 | 3 | 53 |
For PCR, 1 to 3 μL cDNA preparation, 2.4 μL 25 mM MgCl2, 0.5 μM forward and reverse primer, and 2 μL SybrGreen LightCycler Mix (Roche, Mannheim, Germany) were applied in a total volume of 20 μL. PCR programs for each transcript were performed according to the manufacturer’s instructions with individual modifications. MgCl2 concentration and annealing temperature were optimized for each primer set. The PCR reaction was evaluated by melting curve analysis following the manufacturer’s instructions and checking the PCR products on 1.8% agarose gels. Each quantitative PCR was performed at least in duplicate, for 3 sets of RNA preparations.
LPS Stimulation of PHH
To induce an inflammatory reaction, LPS (E. coli LPS serotype 0111:B4; Sigma) was added to PHHs 48 h after perfusion and isolation. Twenty-four hours before the experiments, cells were plated in FCS-and insulin-free media. We conducted a dose-response study with LPS using various doses: 10 ng/mL, 100 ng/mL, 1 μg/mL, 10 μg/mL, 100 μg/mL, and 500 μg/mL.
Insulin Administration to PHHs
After conducting the LPS dose-response study, PHHs were stimulated with 100 μg/mL LPS. After 30 min of LPS incubation, insulin was added to the media. The first experiments were conducted to perform a dose-response study; thus various doses of insulin were added. After incubating the cells for 4, 8, 12, and 24 h, supernatant and cells were harvested for further analysis. The insulin doses tested were 0.5, 2.5, 5, 10, and 50 IE/mL.
For measurements of cell activity, the CellTiter 96 Aqueous nonradioactive cell proliferation assay (cat. no. G5421; Promega) was performed according to the kit guidelines. Briefly, cells were treated with serum-free medium alone (control), with LPS or insulin alone, or with the combination of LPS and insulin as described above. After 12 and 24 h, the conversion of a tetrazolim compound [3-(4,5-dimethylthiazol-2-yl)-5-(3-carboxymethoxyphenyl)-2-(4-sulfophenyl)-2H-tetrazolium, inner salt, MTS] into aqueous, soluble formazan by metabolically active cells was determined by measuring the absorbance at 490 nm. The absorbance is directly proportional to the number of metabolically active cells.
RNA expression of cells was determined as described above. Supernatant cytokine concentration was determined using human ELISA (R&D Systems).
Statistical analysis was performed using ANOVA with Bonferroni correction and Student t test when appropriate. Significance was accepted at P < 0.05.
RESULTS
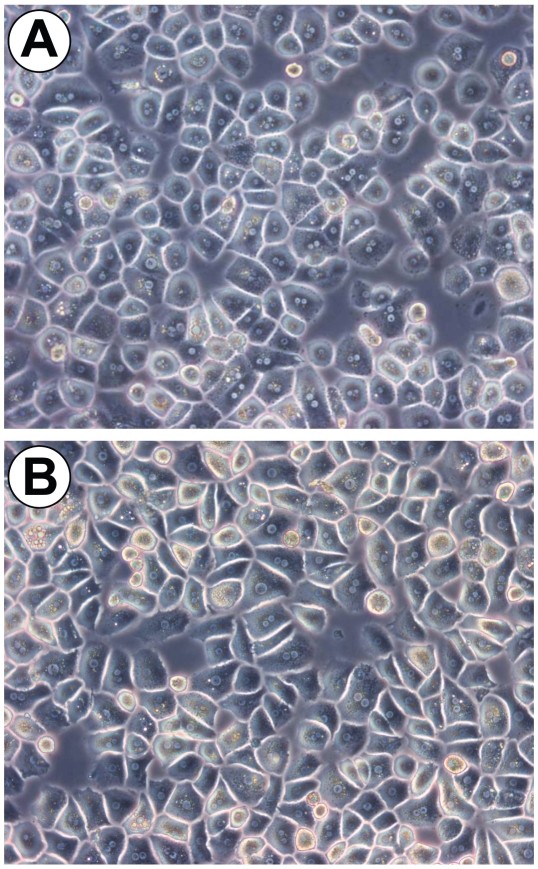
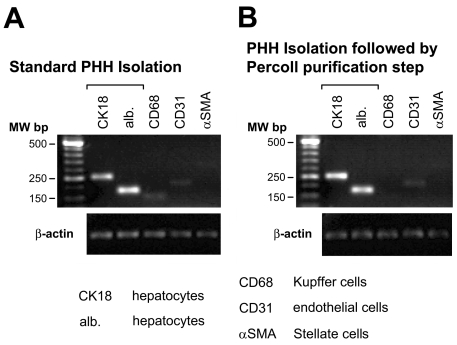
Perfusion and standard isolation of PHHs resulted in healthy and viable cells, with at least 80% viability. Figure 1A depicts a typical primary human hepatocyte cell culture. To prove the contribution of accompanying nonparenchymal cells, we performed a RT-PCR analysis of freshly isolated hepatocytes. We could detect signals of particular CD68 (Kupffer cell) and CD31 (endothelial cell) in isolated hepatocytes only because of the high sensitivity of RT-PCR analysis (Figure 2A). To resemble the situation in the intact liver, standard PHH cultures were used for the activation experiments, although primary hepatocytes could be purified to a degree at which almost no signal of Kupffer cells (Figures 1B and 2B) was detected.
Figure 1.
Primary human hepatocyte cells. (A) Perfusion and standard isolation of primary hepatocytes resulted in healthy and viable cells, with at least 80% viability. (B) Additional density gradient purification resulted in highly purified hepatocyte cultures. Magnification 320×.
Figure 2.
PCR characterization of primary human hepatocytes. (A) PHHs obtained by standard isolation protocol showed a low percentage of nonparenchymal cells. (B) Additional purification of PHHs by density gradient centrifugation resulted in highly purified PHHs with no detectable Kupffer cells (CD68).
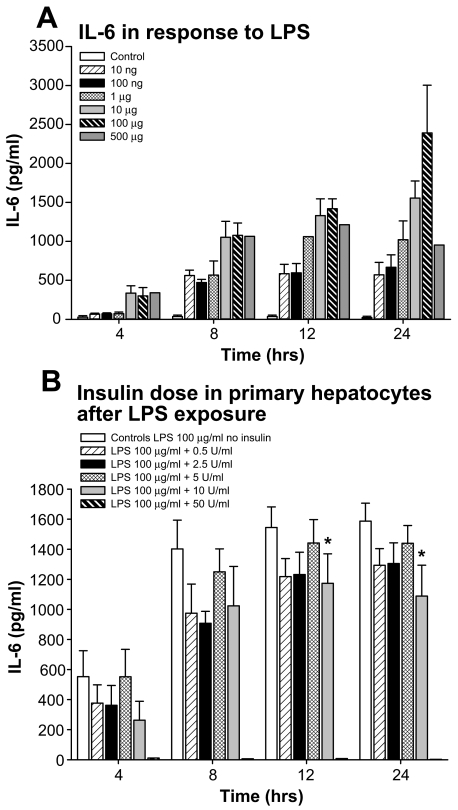
Initially, we measured IL-6 levels in response to different doses of LPS at various time points. We found that LPS causes a significant increase in IL-6 in the supernatant. An LPS dose of 100 μg/mL resulted in the greatest IL-6 increase 8, 12, and, 24 h after LPS administration (Figure 3). Therefore, for all further studies, we used a dosage of 100 μg/mL LPS. In the subsequent study, we conducted a dose-response study for insulin in primary hepatocytes exposed to 100 μg/mL LPS. As depicted in Figure 3B, insulin given at 10 IU/mL significantly attenuates IL-6 expression at 12 and 24 h after LPS administration (P < 0.05) (Figure 3B).
Figure 3.
Dose response for LPS at various doses and various time points. We found that LPS causes a significant increase in IL-6 in the supernatant. We found that 100 μg/mL resulted in the greatest IL-6 increase 24 h after LPS administration. Similarly, the insulin dose response showed that insulin at 10 IU/mL demonstrated significant effects when hepatocytes were exposed to 100 μg/mL LPS. *Significant difference between controls and insulin 10 U/mL after LPS administration, P < 0.05.
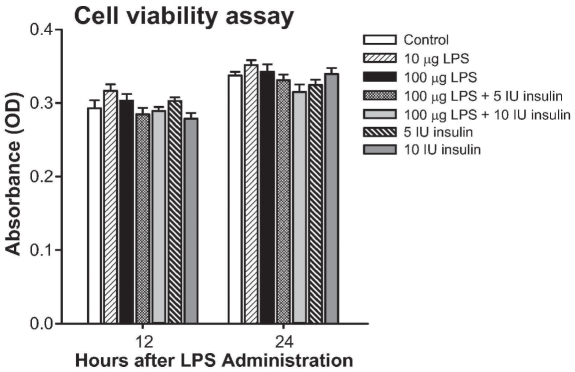
Cell proliferation and activity as measured by XTT colorimetric assay showed that there was no difference between LPS, insulin, or the combination at various doses (Figure 4). However, insulin administration at 50 IU/mL caused cell death, (Figure 4).
Figure 4.
Cell proliferation and activity as measured by XTT colorimetric assay showed that there was no difference between LPS, insulin, or the combination at various doses.
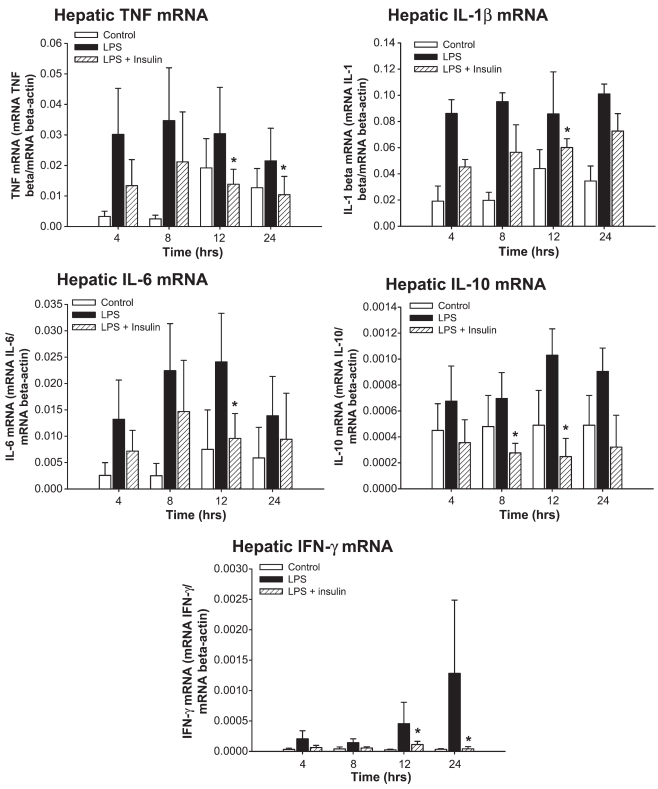
Insulin at a dose of 10 IU/mL significantly decreased the gene expression for hepatic TNF at 12 and 24 h (P < 0.05) (Figure 5). Insulin furthermore significantly decreased hepatic IL-1βmRNA expression 12 h after LPS administration (P < 0.05) (Figure 5). Hepatic IL-6 mRNA was significantly decreased at 12 h after LPS administration (P < 0.05) (Figure 5). Insulin further significantly decreased hepatic IL-10 mRNA at 8 and 12 h after LPS (P < 0.05) (Figure 5). Finally, insulin decreased hepatic IFN-γmRNA at 12 and 24 h after LPS (P < 0.05) (Figure 5).
Figure 5.
Insulin at a dose of 10 IU/mL significantly decreased the gene expression of hepatic TNF at 12 and 24 h, hepatic IL-1βmRNA expression 12 h, hepatic IL-6 mRNA at 12 h, hepatic IL-10 mRNA at 8 and 12 h, and hepatic IFN-γmRNA at 12 and 24 h after LPS administration. *Significant difference between LPS and LPS plus insulin, P < 0.05.
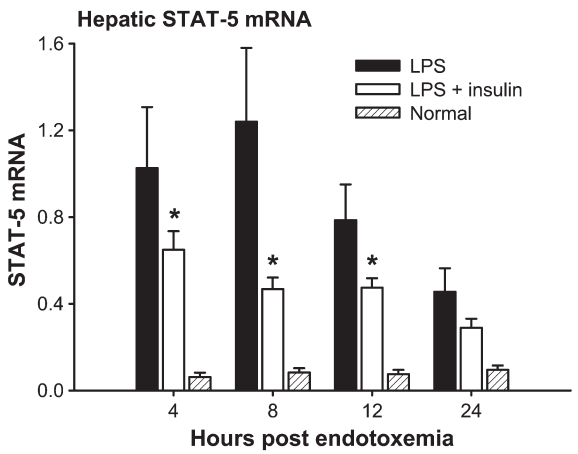
Decreased cytokine mRNA expression was associated with an attenuated expression of signal transducer and activator of transcription-5 (STAT-5) mRNA. Insulin decreased STAT-5 mRNA at 4, 8, and 12 h after LPS administration compared with LPS alone (P < 0.05) (Figure 6). We determined glucose levels 12 h after LPS administration and found no difference between groups, suggesting that insulin acts directly rather than indirectly (data not shown).
Figure 6.
Insulin decreased hepatic STAT-5 mRNA at 4, 8, and 12 h after LPS administration compared with LPS alone. *Significant difference between LPS and LPS plus insulin, P < 0.05.
DISCUSSION
Insulin administration at a dose that kept blood glucose below 110 mg/dL decreased early and late mortality in critically ill patients who underwent thoracic surgery and prevented the incidence of multiorgan failure in patients with a septic focus (5). The mechanisms by which insulin administration exerts these positive effects are not entirely defined. There is evidence that insulin per se acts as an antiinflammatory molecule (9,17–23), but there is also evidence that insulin acts through modulation of glucose levels (24–30). In a burn and endotoxemic rodent model, we found that insulin administration decreased proinflammatory and increased antiinflammatory mediators associated with improved hepatic function and structure (20,21,23,31). In severely burned patients, insulin improves the inflammatory response and attenuates the acute-phase response (22).
The cellular and molecular mechanisms by which insulin exerts its effects are still not fully understood. To obtain knowledge on molecular biology about the effects of insulin during the aftermath of stress, we hypothesized that a human in vitro model is more suitable than a murine in vivo model. Therefore, we tested the hypothesis that adult PHHs undergo a stress response and can be used as a system to study the effect of stress on the liver. In the present study, we showed that primary human hepatocyte cultures obtained by a standard isolation protocol respond to LPS in an inflammatory fashion by producing inflammatory cytokines. This was not expected, as we had tested other cell systems, such as HepG2, C3A, and HL-7702, and they did not respond to stress and did not represent a relevant model to study stress-related responses (data not shown). We also conducted an experiment in which we purified hepatocytes to a degree with almost no detectable Kupffer cells (natural impurity of hepatocytes) and administered LPS. We found that even highly purified hepatocytes are able to answer to the LPS stress without Kupffer cells; however, the magnitude of this response is 20- to 40-fold lower, and therefore, not a proper biological model (data not shown). Our data are in agreement with an earlier report (unpublished data) that indicates that PHHs, and particularly hepatocytes in contact with Kupffer cells, are able to respond to stress and can be used as an in vitro model to study the effects of stress and to further study possible perturbations to attenuate the inflammatory response.
Considerations have to be made about the origin of the samples and their stress response. Tissue samples were obtained from patients undergoing partial hepatectomy for metastatic liver tumors of colorectal cancer. It seems possible that proximity to the cancer metastasis could affect hepatocyte function in a paracrine fashion, particularly in terms of TNF production. To avoid external influence, we did let the cells rest for 2 days before conducting experiments. TNF acts very rapidly, and we suggest that TNF and other inflammatory markers should markedly decrease over these 3 days. In addition, we used each patient sample as its own control, comparing the baseline to minimize variability and errors due different patient samples. In addition, a concern may be that variable endotoxin contamination of the hepatocyte culture system or the variable effect of endotoxin tolerance in cells exposed to endotoxin before the test dose of endotoxin could be present. To avoid endotoxin contamination or conditioning, all isolation and culture steps were performed with LPS-free agents. We could not control previous LPS exposure or tolerance, but we used each patient cells as their own control and, therefore, avoided intrapatient variability and accounted for possible LPS tolerance.
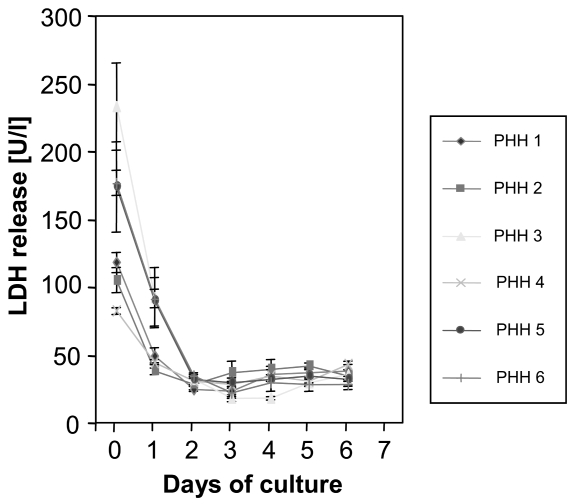
Possible concerns about our study include how the paracrine action of metastatic cancer cells affects the primary hepatocyte cell culture in terms of metabolism and inflammation. By letting the cells rest for 3 days, could this mean that the cells being studied were senescent or undergoing necrosis? Are cells in an inflammatory state to begin with? To diminish possible effects, we let the cells rest for 3 days before we conducted the experiments. Our data showed that resting over 3 days improves liver enzymes, implying less cell stress and damage. We were never able to detect any cytokines in the supernatant, and therefore suggest that inflammation is not an important factor. In addition, during the isolation process of human hepatocytes from resected liver tissue, we included numerous steps for fractioning and washing in many buffers. This process results in an enormous dilution of potentially released cytokines. When we established this model, we made repeated attempts to measure inflammatory cytokines in the supernatant (culture media). In none of the samples were there ever measurable amounts of these mediators. In terms of letting these cells rest for 3 days, we propose that these hepatocytes are influenced by the enormous stress during the isolation process (digestion with enzymes, etc.). Therefore, any stimulation of hepatocytes at this stage would be completely unspecific. However, we have conducted extensive studies with regard to postpreparation cellular integrity (LDH, AST, ALT release). We showed that hepatocytes resume physiologic functions sufficient to provide reproducible experimental conditions after 48 h. In our experiments, we expanded this time period of in vitro adaptation up to 72 h simply to make sure we achieved a noninflammatory and regenerative state (Figure 7).
Figure 7.
Lactate dehydrogenase (LDH) release in isolated hepatocytes. LDH release indicates that membrane integrity of hepatocytes is partly damaged during the process of isolation (day 0 = fresh isolated hepatocytes). After seeding onto collagen coated dishes, hepatocytes recover and some necrotic cells are constantly removed by a daily medium change, which is demonstrated by dropping of LDH enzyme activity to low levels in the medium after 2 days. Six different preparations of PHHs are shown.
After we found that PHHs respond to the LPS stimulus, we investigated the effect of insulin on the inflammatory response in this cell system. We have shown that insulin administration attenuates proinflammatory cytokine protein and mRNA expression in a dose-dependent fashion. Insulin decreased IL-6, TNF, and IL-1βmRNA. In contrast to in vivo data, insulin also decreased hepatic IL-10 and γ-interferon (IFN-γ) mRNA. Insulin administration in vivo increased systemic concentration of IL-10 and IFN-γ. The finding that insulin reduces IL-10 mRNA expression before the reduction of inflammatory gene expression is a paradox, as this should increase the intensity of the inflammatory response to the LPS. Possible explanations could be that first, insulin downregulates inflammatory signals including the antiinflammatory signals, or second, that there is a difference between systemic expression and liver expression. In the present study, we found that insulin decreased IL-10. The antiinflammatory effects of insulin are mediated by STAT-5. We found that insulin significantly decreased expression of STAT-5 at various time points compared with endotoxemic control cells. STAT-5 is a very important signal transcription factor, and its downregulation with insulin indicates an antiinflammatory property of insulin. As we could not detect any difference in glucose levels, we suggest that the changes are due to direct action of insulin rather than an indirect effect via glucose modulation.
We hypothesize that inflammation drives hypermetabolism (32). In the present study, we found that cytokines were not detectable in freshly isolated hepatocytes in the beginning of the study but increased with LPS, implying that an inflammatory response is occurring and that hepatocyte cultures were affected. However, as insulin administration had an antiinflammatory effect, we suggest that even if unresponsiveness or pre-stress is present, insulin exerts beneficial effects. We have no real explanation why cell viability was not improved with insulin administration after LPS administration. One possible explanation could be that cell activity and metabolism showed no difference between LPS, insulin, or LPS plus insulin at various doses and no effect of the LPS and insulin on glucose levels because hepatocytes have been stimulated to a hyper-metabolic state unaffected by insulin levels.
Sepsis and septic shock represent clinical pathophysiologic states for which a sufficient therapy is not existent; therefore, sepsis is associated with a high mortality (33). The increase of proinflammatory mediators such as cytokines and acute-phase proteins leads to protein degradation, catabolism, and hypermetabolism (34,35). As a consequence, the structure and function of essential organs, such as muscle, heart, immune system, and liver, are compromised and contribute to multiorgan failure and mortality (34–36). The magnitude and duration of proinflammatory mediator release determines the development and incidence of tissue damage, multiorgan failure, or even death (35,37–39). The liver–gut axis plays a crucial role during hypermetabolism. To restore systemic homeostasis, the liver reprioritizes its synthesis from constitutive hepatic proteins toward acute-phase proteins (40). An extensive acute-phase response, however, has been shown to increase morbidity and mortality (40). In the present study, we have shown that insulin administration downregulates proinflammatory mediators in a dose-dependent fashion. A signal transcription factor that appears to be involved is STAT-5. As we detected no difference in glucose concentration and cellular metabolism, we suggest that the beneficial effects of insulin are due to its direct antiinflammatory effect and not glucose modulation.
ACKNOWLEDGMENTS
This study was supported by the American Surgical Association Foundation, Shriners Hospitals for Children 8660, and Deutsche Forschungsgemein-schaft DFG (Je 233/6–1).
Footnotes
Online address: http://www.molmed.org
REFERENCES
- 1.Carter EA, Burks D, Fischman AJ, White M, Tompkins RG. Insulin resistance in thermally-injured rats is associated with post-receptor alterations in skeletal muscle, liver and adipose tissue. Int J Mol Med. 2004;14:653–8. [PubMed] [Google Scholar]
- 2.Van den Berghe G. Insulin therapy for the critically ill patient. Clin Cornerstone. 2003;5:56–63. doi: 10.1016/s1098-3597(03)90018-4. [DOI] [PubMed] [Google Scholar]
- 3.Van den Berghe G, et al. Outcome benefit of intensive insulin therapy in the critically ill: insulin dose versus glycemic control. Crit Care Med. 2003;31:359–66. doi: 10.1097/01.CCM.0000045568.12881.10. [DOI] [PubMed] [Google Scholar]
- 4.Koenig W. Insulin resistance, heart disease and inflammation. Identifying the ‘at-risk’ patient: the earlier the better? The role of inflammatory markers. Int J Clin Pract Suppl. 2002 Oct;:23–30. [PubMed] [Google Scholar]
- 5.van den Berghe G, Wouters P, Weekers F, et al. Intensive insulin therapy in critically ill patients. N Engl J Med. 2001;345:1359–67. doi: 10.1056/NEJMoa011300. [DOI] [PubMed] [Google Scholar]
- 6.Van den Berghe G, et al. Intensive insulin therapy in the medical ICU. N Engl J Med. 2006;354:449–61. doi: 10.1056/NEJMoa052521. [DOI] [PubMed] [Google Scholar]
- 7.Ellger B, et al. Survival benefits of intensive insulin therapy in critical illness: impact of maintaining normoglycemia versus glycemia-independent actions of insulin. Diabetes. 2006;55:1096–105. doi: 10.2337/diabetes.55.04.06.db05-1434. [DOI] [PubMed] [Google Scholar]
- 8.Cosentino F, et al. High glucose causes up-regulation of cyclooxygenase-2 and alters prostanoid profile in human endothelial cells: role of protein kinase C and reactive oxygen species. Circulation. 2003;107:1017–23. doi: 10.1161/01.cir.0000051367.92927.07. [DOI] [PubMed] [Google Scholar]
- 9.Dandona P, et al. Insulin inhibits intranuclear nuclear factor kappaB and stimulates IkappaB in mononuclear cells in obese subjects: evidence for an antiinflammatory effect? J Clin Endocrinol Metab. 2001;86:3257–65. doi: 10.1210/jcem.86.7.7623. [DOI] [PubMed] [Google Scholar]
- 10.Guha M, Bai W, Nadler JL, Natarajan R. Molecular mechanisms of tumor necrosis factor alpha gene expression in monocytic cells via hyperglycemia-induced oxidant stress-dependent and -independent pathways. J Biol Chem. 2000;275:17728–39. doi: 10.1074/jbc.275.23.17728. [DOI] [PubMed] [Google Scholar]
- 11.Yano M, et al. Short-term exposure of high glucose concentration induces generation of reactive oxygen species in endothelial cells: implication for the oxidative stress associated with postprandial hyperglycemia. Redox Rep. 2004;9:111–6. doi: 10.1179/135100004225004779. [DOI] [PubMed] [Google Scholar]
- 12.Thasler WE, Weiss TS, Schillhorn K, Stoll PT, Irrgang B, Jauch KW. Charitable State-Controlled Foundation Human Tissue and Cell Research: Ethic and legal aspects in the supply of surgically removed human tissue for research in the academic and commercial sector in Germany. Cell Tissue Bank. 2003;4:49–56. doi: 10.1023/A:1026392429112. [DOI] [PubMed] [Google Scholar]
- 13.Thasler WE, et al. Repression of cytochrome P450 activity in human hepatocytes in vitro by a novel hepatotrophic factor, augmenter of liver regeneration. J Pharmacol Exp Ther. 2006;316:822–9. doi: 10.1124/jpet.105.094201. [DOI] [PubMed] [Google Scholar]
- 14.Weiss TS, Pahernik S, Scheruebl I, Jauch KW, Thasler WE. Cellular damage to human hepatocytes through repeated application of 5-aminolevulinic acid. J Hepatol. 2003;38:476–82. doi: 10.1016/s0168-8278(02)00454-3. [DOI] [PubMed] [Google Scholar]
- 15.Hoebe KH, Witkamp RF, Fink-Gremmels J, Van Miert AS, Monshouwer M. Direct cell-to-cell contact between Kupffer cells and hepatocytes augments endotoxin-induced hepatic injury. Am J Physiol Gastrointest Liver Physiol. 2001;280:G720–8. doi: 10.1152/ajpgi.2001.280.4.G720. [DOI] [PubMed] [Google Scholar]
- 16.Zinchenko YS, Schrum LW, Clemens M, Coger RN. Hepatocyte and kupffer cells co-cultured on micropatterned surfaces to optimize hepatocyte function. Tissue Eng. 2006;12:751–61. doi: 10.1089/ten.2006.12.751. [DOI] [PubMed] [Google Scholar]
- 17.Aljada A, Ghanim H, Mohanty P, Kapur N, Dandona P. Insulin inhibits the proinflammatory transcription factor early growth response gene-1 (Egr)-1 expression in mononuclear cells (MNC) and reduces plasma tissue factor (TF) and plasminogen activator inhibitor-1 (PAI-1) concentrations. J Clin Endocrinol Metab. 2002;87:1419–22. doi: 10.1210/jcem.87.3.8462. [DOI] [PubMed] [Google Scholar]
- 18.Aljada A, Ghanim H, Saadeh R, Dandona P. Insulin inhibits NFkappaB and MCP-1 expression in human aortic endothelial cells. J Clin Endocrinol Metab. 2001;86:450–3. doi: 10.1210/jcem.86.1.7278. [DOI] [PubMed] [Google Scholar]
- 19.Dandona P, Aljada A, Dhindsa S, Garg R. Insulin as an antiinflammatory and antiatherosclerotic hormone. Clin Cornerstone Suppl. 2003;4:S13–20. doi: 10.1016/s1098-3597(03)90062-7. [DOI] [PubMed] [Google Scholar]
- 20.Jeschke MG, Einspanier R, Klein D, Jauch KW. Insulin attenuates the systemic inflammatory response to thermal trauma. Mol Med. 2002;8:443–50. [PMC free article] [PubMed] [Google Scholar]
- 21.Jeschke MG, Klein D, Bolder U, Einspanier R. Insulin attenuates the systemic inflammatory response in endotoxemic rats. Endocrinology. 2004;145:4084–93. doi: 10.1210/en.2004-0592. [DOI] [PubMed] [Google Scholar]
- 22.Jeschke MG, Klein D, Herndon DN. Insulin treatment improves the systemic inflammatory reaction to severe trauma. Ann Surg. 2004;239:553–60. doi: 10.1097/01.sla.0000118569.10289.ad. [DOI] [PMC free article] [PubMed] [Google Scholar]
- 23.Jeschke MG, et al. Insulin prevents liver damage and preserves liver function in lipopolysaccharide-induced endotoxemic rats. J Hepatol. 2005;42:870–9. doi: 10.1016/j.jhep.2004.12.036. [DOI] [PubMed] [Google Scholar]
- 24.Das UN. Insulin in sepsis and septic shock. J Assoc Physicians India. 2003;51:695–700. [PubMed] [Google Scholar]
- 25.Das UN. Insulin and the critically ill. Crit Care. 2002;6:262–3. doi: 10.1186/cc1501. [DOI] [PMC free article] [PubMed] [Google Scholar]
- 26.Das UN. Insulin and inflammation: further evidence and discussion. Nutrition. 2002;18:526–7. doi: 10.1016/s0899-9007(02)00767-0. [DOI] [PubMed] [Google Scholar]
- 27.Esposito K, et al. Inflammatory cytokine concentrations are acutely increased by hyperglycemia in humans: role of oxidative stress. Circulation. 2002;106:2067–72. doi: 10.1161/01.cir.0000034509.14906.ae. [DOI] [PubMed] [Google Scholar]
- 28.Gore DC, Chinkes D, Heggers J, Herndon DN, Wolf SE, Desai M. Association of hyperglycemia with increased mortality after severe burn injury. J Trauma. 2001;51:540–4. doi: 10.1097/00005373-200109000-00021. [DOI] [PubMed] [Google Scholar]
- 29.Gore DC, Chinkes DL, Hart DW, Wolf SE, Herndon DN, Sanford AP. Hyperglycemia exacerbates muscle protein catabolism in burn-injured patients. Crit Care Med. 2002;30:2438–42. doi: 10.1097/00003246-200211000-00006. [DOI] [PubMed] [Google Scholar]
- 30.Ling PR, Mueller C, Smith RJ, Bistrian BR. Hyperglycemia induced by glucose infusion causes hepatic oxidative stress and systemic inflammation, but not STAT3 or MAP kinase activation in liver in rats. Metabolism. 2003;52:868–74. doi: 10.1016/s0026-0495(03)00057-x. [DOI] [PubMed] [Google Scholar]
- 31.Jeschke MG, Mlcak RP, Finnerty CC, Herndon DN. Changes in liver function and size after a severe thermal injury. Shock. 2007;28:172–7. doi: 10.1097/shk.0b013e318047b9e2. [DOI] [PubMed] [Google Scholar]
- 32.Finnerty CC, et al. Cytokine expression profile over time in severely burned pediatric patients. Shock. 2006;26:13–9. doi: 10.1097/01.shk.0000223120.26394.7d. [DOI] [PubMed] [Google Scholar]
- 33.Rivers E, et al. Early goal-directed therapy in the treatment of severe sepsis and septic shock. N Engl J Med. 2001;345:1368–77. doi: 10.1056/NEJMoa010307. [DOI] [PubMed] [Google Scholar]
- 34.Rennie MJ. Muscle protein turnover and the wasting due to injury and disease. Br Med Bull. 1985;41:257–64. doi: 10.1093/oxfordjournals.bmb.a072060. [DOI] [PubMed] [Google Scholar]
- 35.Tracey KJ, et al. Anticachectin/TNF monoclonal antibodies prevent septic shock during lethal bacteraemia. Nature. 1987;330:662–4. doi: 10.1038/330662a0. [DOI] [PubMed] [Google Scholar]
- 36.Takala J, et al. Increased mortality associated with growth hormone treatment in critically ill adults. N Engl J Med. 1999;341:785–92. doi: 10.1056/NEJM199909093411102. [DOI] [PubMed] [Google Scholar]
- 37.Tracey KJ, et al. Cachectin/tumor necrosis factor induces lethal shock and stress hormone responses in the dog. Surg Gynecol Obstet. 1987;164:415–22. [PubMed] [Google Scholar]
- 38.Wang H, et al. HMG-1 as a late mediator of endotoxin lethality in mice. Science. 1999;285:248–51. doi: 10.1126/science.285.5425.248. [DOI] [PubMed] [Google Scholar]
- 39.Wang H, et al. Proinflammatory cytokines (tumor necrosis factor and interleukin 1) stimulate release of high mobility group protein-1 by pituicytes. Surgery. 1999;126:389–92. [PubMed] [Google Scholar]
- 40.Moshage H. Cytokines and the hepatic acute phase response. J Pathol. 1997;181:257–66. doi: 10.1002/(SICI)1096-9896(199703)181:3<257::AID-PATH756>3.0.CO;2-U. [DOI] [PubMed] [Google Scholar]


