

Abstract
Background
The use and correct interpretation of bone densitometry measurements in paediatric patients relies on the availability of appropriate reference data. Ideally, such data should be matched for sex, chronological age, height, weight, pubertal development and ethnicity.
Aim
To provide UK‐specific reference data for the Hologic QDR Discovery dual‐energy x ray absorptiometry (DXA) scanners.
Methods
Healthy, Caucasian children aged 5–18 years were recruited from local schools, colleges, general practitioner surgeries and staff from the University of Manchester, Manchester, UK. Suitable participants had DXA measurements taken of the lumbar spine, hip and total body. Sex‐specific reference centile curves for bone mineral apparent density (BMAD; spine and femoral neck) are provided, using the approach suggested by Mølgaard et al. to interpret the scans. LMS (λ, μ, ς) tables for calculation of individual standard deviation scores (SDSs) were produced; a weblink is provided to these tables to allow calculation of an individual child's SDSs.
Results
The total study population consisted of 442 participants (239 male). The total numbers of scans available for analysis were 431 of the lumbar spine, 426 of the total body and 393 of the proximal femur. Data are provided for clinical interpretation of the spine and femoral neck scans based on BMAD (g/cm3), which reduces the size dependence of DXA areal bone mineral density (g/cm2). The spine and total‐body data are also presented for interpretation of results using the approach suggested by Mølgaard et al.
Conclusions
This article provides the first sex‐specific and ethnicity‐specific reference databases for UK, which should allow the clinician to assess bone mineral density in paediatric patients, measured by the Hologic QDR Discovery DXA scanner.
Dual‐energy x ray absorptiometry (DXA) is the most widely used bone densitometry technique in children. DXA allows measurement of paediatric bone status by measuring the amount of mineral within a given area of bone (areal bone mineral density (aBMD), g/cm2), bone area (cm2) and bone mineral content (BMC, g). The most common sites for measurement are the lumbar spine, total body and proximal femur.
The use and correct interpretation of bone densitometry measurements in paediatric patients relies on the availability of appropriate reference data. Ideally, such data should be matched for sex,1,2,3 chronological and skeletal age, height, weight, pubertal development and ethnicity.1,4,5 In most cases, manufacturer‐specific reference data are used; other sources include locally derived data or those published in the literature.6,7,8,9,10,11,12,13,14,15,16 Many current DXA reference databases include insufficient participants, combine sex and ethnicities, and were performed on older versions of the scanner, which include different acquisition modes (eg, the Hologic 1000 uses the pencil‐beam mode, the current Hologic scanners use the fan‐beam mode) or software analysis programs. The reference database selected for scan interpretation can considerably affect the standard deviation score (SDS may also be referred to as z score) obtained from the scanner, whereby an individual may be inaccurately classified as having “low bone density for chronological age”, arbitrarily defined as an SDS >2 standard deviations (SDs) below the age‐matched mean17 or normal.18 Additionally, the methods used to analyse the scans and separate the soft tissue from bone have been designed for use in adults. As children grow and their bones gain mineral, the detection of the bone edges will change, and therefore cause problems with scan analysis. Software for paediatric analysis is available, but often results of paediatric and adult analysis options differ,19 and it is imperative to know which analysis mode has been used.20 Therefore, it is essential to have knowledge of the software version and analysis option used, the reference database against which comparisons are made, the population on which the reference data are based and what parameters change when software or machine upgrades occur. Software version and analysis mode should always be recorded in the report.21
In 2004, the largest paediatric, sex‐specific and ethnicity‐specific reference databases for the Hologic 4500 DXA scanner were presented22 (444 spine, 1047 hip and 1948 total‐body scans): these data were gathered retrospectively in the US. Currently, no UK paediatric reference data are available for the use of the Hologic QDR Discovery (formerly QDR 4500A).
The primary aim of our study was to provide sex‐specific reference centile curves for Caucasian UK children for the Hologic QDR Discovery (Bedford, Massachusetts, USA) DXA scanner, derived using the lambda, mu, sigma (LMS) technique given by Cole and Green.23 These reference centile curves will enable the clinician to estimate the centile on which children's DXA‐measured bone parameter falls in reference to their age or height. We provide LMS data (appendix is available at http://adc.bmjjournals.com/supplemental) to enable the calculation of an individual's SDS either for use in a clinical setting—for example, the change in bone response to treatment with a bisphosphonate—or for research studies. Spine and femoral neck data have been presented as bone mineral apparent density (BMAD, g/cm3), a measure that is less dependent on bone size than aBMD.12,24 The centile curves can also be used in conjunction with current height reference centile curves (Child Growth Foundation) to interpret data using the method suggested by Mølgaard et al.14
Participants and methods
Participants
The total study population consisted of 442 healthy Caucasian children and young adults (239 male, 203 female) aged 5–18 years. Research participants were recruited by advertisement in schools, colleges, the University of Manchester and general practitioner surgeries within the Greater Manchester region, UK. Initially, all schools and colleges within a local authority area were sent letters requesting that we recruit our participants through them; any institution that agreed to participate was then used for recruitment via letters and posters. General practitioner surgeries in the Manchester Primary Care Trust were also used for recruitment. Participants who expressed an interest in taking part in the study completed a screening questionnaire to ensure that they fulfilled the recruitment criteria. Inclusion criteria were Caucasian ethnic origin and aged 5–18 years. Exclusion criteria were as follows: (1) inability to give informed consent, (2) height or weight outside the 0.4th and 99.6th centiles on current growth reference curves,25,26 (3) history of recurrent low trauma fractures or any fracture in the past 12 months, (4) prolonged periods of immobilisation in the past 12 months, (5) systemic disease, (6) any condition, or use of any drugs known to affect bone health (children were included if they used inhaled corticosteroids because of evidence suggesting that these drugs do not adversely affect BMD),27 (7) participation in research involving ionising radiation in the past 12 months, (8) first‐degree relative with primary osteoporosis and (9) in females, current or past pregnancy.
The study was approved by the North West Multi‐centre Research Ethics Committee and was carried out in accordance with the Declaration of Helsinki. Informed written consent was obtained from the parents or guardians of each child aged <16 years and from participants aged >16 years. Verbal consent was obtained from children whose parents or guardians provided the written consent.
Socioeconomic status
Research participant's postcodes were used to determine the Townsend Material Deprivation Score as an indicator of their socioeconomic status, using data from the 2001 UK census.28
Anthropometric measurements
Standing and sitting heights were measured (table 1) to the nearest millimetre using a portable stadiometer (Leicester Height Measure, Child Growth Foundation, Leicester, UK). Participants were weighed fully clothed, except for shoes and coat, to the nearest 0.1 kg, using Seca digital scales (Autoweigh Scales, Elland, UK). Body mass index (BMI) was calculated as weight (kg) divided by height2 (m2). Height, weight and BMI SDS for each participant were calculated using the current UK reference data.25,26
Table 1 Descriptive characteristics of the study population.
| Males | Females | |||
|---|---|---|---|---|
| Mean (SD) | SDS | Mean (SD) | SDS | |
| Age (years) | 12.01 (3.13) | 11.86 (3.70) | ||
| Height (m) | 1.52 (0.19) | 0.20 (0.99) | 1.46 (0.17) | 0.12 (0.96) |
| Weight (kg) | 46.25 (17.83) | 0.43 (1.02) | 43.02 (16.3) | 0.29 (1.08) |
| BMI (kg/m2) | 19.25 (3.7) | 0.43 (1.06) | 19.39 (4.10) | 0.29 (1.10) |
BMI, body mass index; SDS, standard deviation score.
Bone densitometry assessment
The total‐body, lumbar spine (L1–L4) and left femoral neck (femoral neck, from proximal femur scans) measurements were taken using the Hologic QDR Discovery DXA fan‐beam scanner (software V.12.1, fast‐array mode). Lumbar spine and proximal femur scans were analysed using the auto low‐density option, which uses algorithms to improve the accuracy of edge detection of the bones in younger children and individuals with low BMD. Total‐body scans were analysed using the adult analysis algorithm. BMAD was calculated for the lumbar spine using the geometric assumptions made by Carter et al,24 and for the femoral neck using the method of Lu et al.12 In contrast with the model in Carter et al's paper, we calculated the volume of each individual vertebral body (L1–L4) and summed the result rather than calculating the volume from L2–L4 bone area.
BMAD calculation
(a) BMAD of the lumbar spine (LS) (equation 1):
where ν1 is the volume of lumbar vertebra and L1 = a13/2 (a1 is the area of L1), and similarly for L2–L4; BMC1–BMC 4 are BMC values of each individual vertebral body.
(b) BMAD of the femoral neck (FN) (equation 2):
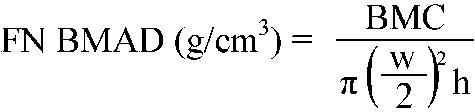 |
where BMC is the bone mineral content of the femoral neck, w is the femoral neck width (femoral neck area/height), and h is the height of the scanned region of the femoral neck. The value of h depends on the scanner used. For the Hologic QDR Discovery, h = 15.12 mm (Dr T Kelly, Hologic, Waltham, MA, USA, personal communication, 2004).
In our clinical radiology department, the coefficient of variation for adult measurements of the lumbar spine and proximal femur were 1.1% and 1.3%, respectively. The total estimated effective dose for scans of the total body, lumbar spine and proximal femur was 10.8 μSv.30
The Mølgaard approach
To understand whether a child's low aBMD and BMAD is due to short bones (height for age), narrow bones (bone area for height) or light bones—that is, whether his or her BMC is appropriate or reduced for the bone area—the approach given by Mølgaard et al14 can be used. Such an approach may be applied to data of the lumbar spine or the total body. The first step determines whether the child's height for age is normal or reduced. This can be determined by plotting the child's standing height on the current Child Growth Foundation reference centile curves; each of the nine plotted centile curves is ⅔ SD apart.31 The SDS values for the second step (bone area for height) and the third step (BMC for bone area) can be calculated from our data (appendix available at http://adc.bmjjournals.com/supplemental) by using equation 3.
Statistical analysis
Reference plots showing 5th, 25th, 50th, 75th and 95th centiles are computed using Cole and Greens's23 LMS method. Each sex is fitted separately. This parameterises the relationship between the variable of interest and age (or height/weight) as a function of three smooth curves known as lambda, mu and sigma.
L is a parameter (from a Box–Cox transformation) that transforms the data at the particular age to a normal distribution; M represents the median value at the particular age, and S is the coefficient of variation of the transformed data at that particular age. L, M and S are represented by smooth cubic spline curves as a function of age, and the degrees of freedom (df) of these curves are selected as a compromise between the smoothness of the resultant curves and the degree to which it follows all the features. Following Cole and Green,23 we first set L and S so that df = 1 (constant across age) and increase the degree of freedom associated with M to yield a reasonable fit to the data—guided by the pseudo‐likelihood test of Cole and Green23 and the diagnostics listed below. We then increase the degrees of freedom associated with S and then with L to obtain the final fit.
The quality of the final fits is assessed by visual inspection of the fitted data, worm plots,32 normal quantile plots of the SDS, plots of SDS against age and plots of smoothed empirical quantiles.
Although the data include ages 5–18 years, the charts shown are truncated to cover the age range 6–17 years to reflect the greater uncertainty in the fitted values at the extremes of the age range.
Bootstrap resampling was used to assess the accuracy of the derived reference charts. Samples were drawn from the data, stratifying by age (3‐year age bands) and sex to maintain the structure of the data. The LMS model was refitted to these resamples and selected quantiles were recomputed. Empirical 95% confidence intervals were then estimated based on the distribution of the resampled quantiles and plotted as shaded regions as a function of age; 1000 resamples were used.
The data were fitted using the freely available Fortran code.23 An R interface to this code has been developed and the plots and tables have been produced in R.33
Subsidiary analyses investigated correlations between the fitted z scores, age and Townsend scores. Spearman correlation coefficients are presented along with their associated significance levels.
Calculation of SDS
To accompany the reference centile curves, the LMS tables are provided in the appendix (available at adc.bmjjournals.com/supplemental) to enable calculation of an individual child's SDS either related to age (BMAD) or height (Mølgaard et al's approach). By reading off the L, M and S values for the age or height of a patient, and given the value y (eg, area, BMC or BMAD) for that patient, the SDS corresponding to the y value is given by equation 3
 |
Results
From the original cohort of 442 participants, seven individuals were excluded before data analysis as they had low BMAD for age, skeletal disproportion or abnormal bone geometry suggestive of a skeletal dysplasia; these individuals underwent a thorough clinical assessment for medical conditions that are known to be associated with reduced BMD. Therefore, the total study population consisted of 435 participants (235 male). Scans of the proximal femur were performed in only 396 participants because the protocol was modified part way through the study when hip scanning in children became feasible using the QDR Discovery DXA scanner. Owing to technical reasons (eg, movement) or the presence of artefacts (eg, navel rings), four scans of the lumbar spine, nine of the total body and three of the proximal femur were excluded. The total number of scans available for analysis were 431 of the lumbar spine, 426 of the total body and 393 of the proximal femur.
The Townsend Deprivation Score was determined for the locality of 382 participants. The median score was −0.38, close to the population average, with an interquartile range of −2.5 to 2.6. In all, 43% of the sample had Townsend Scores >0 and the distribution was skewed towards higher deprivation scores (range −4.8 to 13.9).
Table 1 shows the height, weight and BMI SDS values for the study population. Both males and females were slightly taller, heavier and fatter than those from the current UK reference data.25,26 The SD values are close to the expected value of 1. Both weight and BMI SDS showed a trend towards increasing deviation with age (weight: r = 0.14, p = 0.004; BMI: r = 0.14, p = 0.002), with the youngest participants having a mean SDS close to 0.
Height, weight and BMI SDS values are calculated from UK growth reference centile curves.29
Reference centile curves
Results are presented separately for each sex. We have produced reference centile curves (available at http://adc.bmjjournals.com/supplemental) for the lumbar spine and femoral neck BMAD by age (fig 1). To calculate whether children's bones are of an appropriate size for their height, and appropriately mineralised for their size, bone area for height and BMC for the bone area reference centile curves are given for the lumbar spine (fig 2)and total body (fig 3). We also present an example of estimates of the accuracy of the derived centiles (fig 4).

Figure 1 Reference centile curves for bone mineral apparent density (BMAD) by age in males and females. (A,B) Lumbar spine. (C,D) Femoral neck.

Figure 2 Reference centile curves for (A,B) lumbar spine bone area for height and (C,D) lumbar spine bone mineral content (BMC) for bone area in males and females.

Figure 3 Reference centile curves for (A,B) total body bone area for height and (C,D) total body bone mineral content (BMC) for bone area in males and females.

Figure 4 Approximate 95% confidence intervals (CI) on the 5th, 50th and 95th centile lines for males and females, as estimated by bootstrap resampling of the data. The thick lines show the centile and the shaded region indicates the 95% CI. (A) Lumbar spine bone mineral apparent density (BMAD). (B) Femoral neck BMAD.
Examples of how to interpret scans of patients who have presented to the Manchester Paediatric Metabolic Bone Disease Clinic are provided at http://adc.bmjjournals.com/supplemental.
Discussion
We present sex‐specific reference data for the Hologic QDR Discovery DXA scanner in a cohort of healthy Caucasian children aged 6–17 years from the Greater Manchester region in the UK. These data may be used for calculation of age‐matched SDS values for the lumbar spine and femoral neck BMAD. We also provide data for assessment of bone status based on the Mølgaard approach.14
In adults, BMD measured by DXA predicts the risk of osteoporotic fractures in a similar way to blood pressure predicting the risk of stroke.34 In postmenopausal Caucasian women, the World Health Organization arbitrarily defined osteopenia as aBMD <−1 SD and aBMD >−2.5SD, and osteoporosis as aBMD <−2.5SD below the mean for young adult women, defined as the “t score”.35 Therefore, t scores must be used only in adults; they are not appropriate for use in children. No similar definitions of osteopenia or osteoporosis are available in children. However, in girls with a previous forearm fracture, Goulding et al36 observed that for every SD decrease in total‐body BMD, the risk of new fractures at any site doubled during the 4 years after the initial fracture. Thus, the results from this cohort follow‐up study in children support the concept that low BMD is the major contributing factor to skeletal fragility, and therefore its measurement aids assessment of children who are at risk of fragility fractures.
DXA measurements (aBMD) are size dependent, as the measurements are from a two‐dimensional image projection of a three‐dimensional structure, thus not accounting for the depth of the bone. The result of this is an underestimation of BMD in small children and overestimation in large children. In a growing child, this will cause inaccuracies, and the size dependence of DXA must be accounted for when interpreting measurements. Some correction methods do exist.14,24,37,38,39,40 One of the most common correction methods is calculating a “volumetric” density, also known as BMAD,24,37,38 which corrects for bone size. The most common site for BMAD calculation is the lumbar spine24,37,38; femoral neck BMAD may also be calculated.12,37,38 Although this does not fully correct for size,40 BMAD is a much better reflection of volumetric density than is an aBMD measurement.12,41 Despite this, there is no direct evidence for which approach is the best—for example, aBMD for age, BMAD on height adjustment. It is important to use a consistently method and have knowledge of the pitfalls and limitations of each method.21,42 Fewtrell et al41 evaluated several methods of adjustment of aBMD, by using an arbitrary definition of normal as > −2SDS and abnormal as < −2SDS. All methods classified fewer patients as abnormal than using aBMD. However, Fewtrell et al41 noted that it is not possible to determine which method is the best. Comprehensive guidelines are available for the interpretation of paediatric bone densitometry measurements.17,21 Pragmatically, an SDS of ⩾−2 below the age‐matched mean may be defined as a low bone density for age.17,21 However, a patient's BMAD SDS must always be interpreted in the context of a full clinical history and thorough examination; a child must not be labelled as having osteoporosis on the basis of aBMD or BMAD SDS alone.17,21
The Mølgaard approach assesses both bone size, an important determinant of bone strength, and mineral content.14 This allows the clinician to further understand the causes of a child's low aBMD or low BMAD based on the premise that in some cases the children may be just small for their age with appropriately mineralised bones for their size. When aBMD or BMAD is normal, the child may also have small bones. As bone size is an important independent component of bone strength,43 having small bones for height will reduce bone strength and may increase a child's risk of fracture. Data are analysed in three steps: (1) assess the child's height for their age (short bones); (2) assess whether the bones are the appropriate size for their height (narrow bones); (3) assess whether bones are sufficiently mineralised for their size (light bones). The first step can be calculated using the contemporary UK Child Growth Foundation Growth Charts; each of the nine plotted centiles represents ⅔ SDS. The second and third steps can be calculated from data provided in this paper. An example of the application of this is in children with cystic fibrosis in whom linear growth is impaired and aBMD is often reported as low.44,45,46,47,48 In patients with cystic fibrosis aged <19 years, Laursen et al49 found that the height SDS values were reduced, indicating short bones, and the bone areas for height SDS values were reduced, indicating narrow bones. The BMC for age was reduced; however, BMC for bone area was increased, indicating that younger patients with cystic fibrosis had smaller bones with higher than normal BMC. These results suggest that impaired bone growth in patients with cystic fibrosis may lead to lower aBMD values even when the volumetric BMD is normal.39 In addition, the smaller bones of the children with cystic fibrosis may lead them to increased risk of bone fragility as they will be intrinsically weaker than those of children with larger bones with the same volumetric bone density.43
There are some limitations to this study. Firstly, the children and young adults in our study cohort were taller, heavier and fatter than those in the UK reference population.29 These differences are likely to be due to secular changes.50,51 Secondly, although our recruitment method aimed to gather a sample representative of participants throughout Greater Manchester, we did not use a systematic population sampling approach. Previous experience suggested that such sampling was associated with low response rates, and would be no more representative than a volunteer sample recruited by advertisement. The sample obtained was reasonably representative of the diversity of affluence, as assessed by the Townsend Material Deprivation Score, which is associated with the children's place of residence. In our population, there was a slight bias towards the less privileged areas. However, we do not have direct measures of socioeconomic status, and the individuals who participated may not have been representative of their domicile areas. We found a significant positive association between deprivation score and body weight SDS (r = 0.11, p = 0.04), which is also reflected in BMI SDS (r = 0.10, p = 0.06). None of the other variables presented here show any association with the Townsend Score, suggesting that the effect of any sampling bias will be small. Thirdly, data at the upper and lower extremities of the age range of our cohort (5‐year olds and 18‐year olds) are few. For this reason the current data are provided for ages 6–17 years only; further recruitment to extend the age range of our data will be performed. Finally, our current reference centile curves consist of five centiles rather than the nine centiles that are currently included in the growth reference centile.25,26 Our dataset is currently not large enough to include extreme centiles; these centiles will be added to future versions of these charts when further data are collected.
What is already known on this topic
Currently, no UK‐specific reference data for Hologic Discovery dual‐energy x ray absorptiometry (DXA) scanners exist.
The most accurate interpretation of DXA data relies on the availability of appropriate reference data.
What this study adds
These data are the first UK, ethnicity‐specific and sex‐specific reference data of a UK paediatric population, for the Hologic QDR Discovery scanner.
The paper explains to the clinician how to interpret, assess and monitor data in paediatric patients, and allows several methods of interpretation.
Conclusion
We have presented a sex‐specific and ethnicity‐specific reference database for 6–17‐year‐old Caucasian UK children and young adults for the Hologic Discovery DXA scanner using the fast‐array mode, software V.12.1. It is imperative that the reference data from our study be compared against data obtained from the Hologic QDR Discovery using the same scan mode and software version (V.12.1). Cross‐calibration or reanalysis of scans should be performed if alternative scan‐acquisition modes or software versions are used.52
To our knowledge, these are the first sex‐specific UK reference data for the Hologic QDR Discovery scanner. These reference data are intended to assist the clinician in the interpretation, assessment and monitoring of bone densitometry results in the paediatric patient. Without appropriate reference data, the clinical care of children with bone diseases will be adversely affected and may lead to inappropriate management, with consequences for treatment, future care and bone health.
Supplementary Material
Acknowledgements
We thank the research participants and their families, the schools where recruitment was undertaken, our dedicated team of radiographers, Mr Mike Machin and Dr Elizabeth Harrison.
Abbreviations
aBMD - areal bone mineral density
BMAD - bone mineral apparent density
BMC - bone mineral content
BMI - body mass index
DXA - dual‐energy x ray absorptiometry
SDS - standard deviation score
Footnotes
Funding: RLA received a Linda Edwards memorial PhD studentship from the National Osteoporosis Society, Camerton, Bath, UK, in 2003. The National Osteoporosis Society funded the initial part of the study (1997–1998).
Competing interests: None.
References
- 1.Bachrach L K, Hastie T, Wang M ‐ C.et al Bone mineral acquisition in healthy Asian, Hispanic, black, and Caucasian youth: a longitudinal study. J Clin Endocrinol Metab 1999844702–4712. [DOI] [PubMed] [Google Scholar]
- 2.Neu C, Manz F, Rauch F.et al Bone densities and bone size at the distal radius in healthy children and adolescents: a study using peripheral quantitative computed tomography. Bone 200128227–232. [DOI] [PubMed] [Google Scholar]
- 3.Schoenau E, Neu C, Rauch F.et al Gender‐specific pubertal changes in volumetric cortical bone mineral density at the proximal radius. Bone 200231110–113. [DOI] [PubMed] [Google Scholar]
- 4.Wang M C, Aguirre M, Bhudhikanok G S.et al Bone mass and hip axis length in healthy Asian, black, Hispanic, and white American youths. J Bone Miner Res 1997121922–1935. [DOI] [PubMed] [Google Scholar]
- 5.Nelson D, Simpson P, Johnson C.et al The accumulation of whole body skeletal mass in third‐ and fourth‐grade children: effects of age, gender, ethnicity and body composition. Bone 19972073–78. [DOI] [PubMed] [Google Scholar]
- 6.Bonjour J, Theintz G, Buchs B.et al Critical years and stages of puberty for spinal and femoral bone mass accumulation during adolescence. J Clin Endocrinol Metab 199173555–563. [DOI] [PubMed] [Google Scholar]
- 7.Henderson R, Lark R, JE N et al Paediatric reference data for dual energy X‐ray absorptiometry measures of normal bone density in the distal femur. Am J Roentgenol 2002178439–443. [DOI] [PubMed] [Google Scholar]
- 8.Binkley T, Specker B, Wittig T. Centile curves for bone densitometry measurements in healthy males and females aged 5–22 years. J Clin Densitom 20025343–353. [DOI] [PubMed] [Google Scholar]
- 9.Boot A M, de Ridder M A J, Pols H A P.et al Bone mineral density in children and adolescents: relation to puberty, calcium intake, and physical activity. J Clin Endocrinol Metab 19978257–62. [DOI] [PubMed] [Google Scholar]
- 10.Faulkner R A, Bailey D A, Drinkwater D T.et al Bone densitometry in Canadian children 8–17 years of age. Calcif Tissue Int 199659344–351. [DOI] [PubMed] [Google Scholar]
- 11.Lu P W, Briody J N, Ogle G D.et al Bone mineral density of total body, spine, and femoral neck in children and young adults: a cross‐sectional and longitudinal study. J Bone Miner Res 199491451–1458. [DOI] [PubMed] [Google Scholar]
- 12.Lu P, Cowell C, Lloyd‐Jones S.et al Volumetric bone mineral density in normal subjects, aged 5–27 years. J Clin Endocrinol Metab 1996811586–1590. [DOI] [PubMed] [Google Scholar]
- 13.Maynard L M, Guo S S, Chumlea W C.et al Total‐body and regional bone mineral content and areal bone mineral density in children aged 8–18 y: the Fels Longitudinal Study. Am J Clin Nutr 1998681111–1117. [DOI] [PubMed] [Google Scholar]
- 14.Mølgaard C, Thomsen B, Prentice A.et al Whole body bone mineral content in healthy children and adolescents. Arch Dis Child 1997769–15. [DOI] [PMC free article] [PubMed] [Google Scholar]
- 15.van der Sluis I, de Ridder M, Boot A.et al Reference data for bone density and body composition measured with dual energy x‐ray absorptiometry in white children and young adults. Arch Dis Child 200287341–347. [DOI] [PMC free article] [PubMed] [Google Scholar]
- 16.Zanchetta J R, Plotkin H, Filgueira M L A. Bone mass in children: normative values for the 2–20‐year‐old population. Bone 199516S393–S399. [DOI] [PubMed] [Google Scholar]
- 17.Khan A A, Bachrach L, Brown J P.et al Standards and guidelines for performing central dual‐energy x‐ray absorptiometry in premenopausal women, men, and children. J Clin Densitom 2004751–64. [DOI] [PubMed] [Google Scholar]
- 18.Leonard M, Propert K, Zemel B.et al Discrepancies in pediatric bone mineral density reference data: potential for misdiagnosis of osteopenia. J Pediatr 1999135(pt 1)182–188. [DOI] [PubMed] [Google Scholar]
- 19.Ashby R, Mughal M Z, Adams J E. Total body scans in paediatric subjects by Hologic QDR‐4500A: comparison of adult and paediatric total body analysis algorithms. Osteoporos Int 200314(Suppl 4)S25 [Google Scholar]
- 20.Leonard M B, Feldman H I, Zemel B S.et al Evaluation of low density spine software for the assessment of bone mineral density in children. J Bone Miner Res 1998131687–1690. [DOI] [PubMed] [Google Scholar]
- 21. Adams JE, Shaw N, eds. A practical guide to bone densitometry in children. 1st edn. Bath, UK: National Osteoporosis Society, 2004
- 22.Zemel B, Leonard M, Kalkwarf H.et al Reference data for the whole body, lumbar spine and proximal femur for American children relative to age, gender and body size. Am Soc Bone Miner Res 200419S231 [Google Scholar]
- 23.Cole T J, Green P J. Smoothing reference centile curves: the LMS method and penalized likelehood. Stat Med 1992111305–1319. [DOI] [PubMed] [Google Scholar]
- 24.Carter D, Bouxsein M, Marcus R. New approaches for interpreting projected bone densitometry data. J Bone Miner Res 19927137–145. [DOI] [PubMed] [Google Scholar]
- 25.Cole T J, Freeman J V, Preece M A. Body mass index reference curves for the UK, 1990. Arch Dis Child 19957325–29. [DOI] [PMC free article] [PubMed] [Google Scholar]
- 26.Freeman J V, Cole T J, Chinn S.et al Cross sectional stature and weight reference curves for the UK, 1990. Arch Dis Child 19957317–24. [DOI] [PMC free article] [PubMed] [Google Scholar]
- 27.Reilly S M, Hambleton G, Adams J E.et al Bone density in asthmatic children treated with inhaled corticosteroids. Arch Dis Child 200184183–184. [DOI] [PMC free article] [PubMed] [Google Scholar]
- 28.Phillimore P, Beattie A, Townsend P. Widening inequality of health in northern England, 1981–91. BMJ 19943081125–1128. [DOI] [PMC free article] [PubMed] [Google Scholar]
- 29.Cole T J, Freeman J, Preece M. Body mass reference curves for the UK, 1990. Arch Dis Child 19957325–29. [DOI] [PMC free article] [PubMed] [Google Scholar]
- 30.Blake G.Radiation protection—doses and legislation. fundamentals of bone densitometry. 2nd edn. Bath,UK: National Osteoporosis Society, 1998
- 31.Cole T J. Do growth chart centiles need a face lift? BMJ 1994308641–642. [DOI] [PMC free article] [PubMed] [Google Scholar]
- 32.van Buuren S, Fredriks M. Worm plot: a simple diagnostic device for modelling growth reference curves. Stat Med 2001201259–1277. [DOI] [PubMed] [Google Scholar]
- 33.R Development Core Team A language and environment for statistical computing. Vienna, Austria: R Development Core Team,
- 34.Marshall D, Johnell O, Wedel H. Meta‐analysis of how well measures of bone mineral density predict occurrence of osteoporotic fractures. BMJ 19963121254–1259. [DOI] [PMC free article] [PubMed] [Google Scholar]
- 35.World Health Organization Assessment of fracture risk and its implication to screening for postmenopausal osteoporosis. Technical Report Number 843. Geneva: WHO, 1994 [PubMed]
- 36.Goulding A, Jones I, Taylor R.et al More broken bones: a 4‐year double cohort study of young girls with and without distal forearm fractures. J Bone Miner Res 2000152011–2018. [DOI] [PubMed] [Google Scholar]
- 37.Katzman D, Bachrach L, Carter D.et al Clinical and anthropometric correlates of bone mineral acquisition in healthy adolescent girls. J Clin Endocrinol Metab 1991731332–1339. [DOI] [PubMed] [Google Scholar]
- 38.Kroger H, Kontaniemi A, Vainio P.et al Bone densitometry of the spine and femur in children by dual‐energy x‐ray absorptiometry. Bone Miner 19921775–85. [DOI] [PubMed] [Google Scholar]
- 39.Prentice A, Parsons T, Cole T. Uncritical use of bone mineral density in absorptiometry may lead to size‐related artifacts in the identification of bone mineral determinants. Am J Clin Nutr 199460837–842. [DOI] [PubMed] [Google Scholar]
- 40.Nevill A, Holder R, Maffulli N.et al Adjusting bone mass for differences in projected bone area and other confounding variables: an allometric perspective. J Bone Miner Res 200217703–708. [DOI] [PubMed] [Google Scholar]
- 41.Fewtrell M S, Gordon I, Biassoni L.et al Dual X‐ray absorptiometry (DXA) of the lumbar spine in a clinical paediatric setting: does the method of size‐adjustment matter? Bone 200537413–419. [DOI] [PubMed] [Google Scholar]
- 42.Fewtrell M. Bone densitometry in children assessed by dual energy x‐ray absorptiometry: uses and pitfalls. Arch Dis Child 200388795–798. [DOI] [PMC free article] [PubMed] [Google Scholar]
- 43.Frost H. On our age‐related bone loss: insights from a new paradigm. J Bone Miner Res 1997121539–1546. [DOI] [PubMed] [Google Scholar]
- 44.Buntain H M, Schluter P J, Bell S C.et al A controlled longitudinal study of bone mass accrual in children and adolescents with cystic fibrosis. Thorax 200661146–154. [DOI] [PMC free article] [PubMed] [Google Scholar]
- 45.Conway S P, Morton A M, Oldroyd B.et al Osteoporosis and osteopenia in adults and adolescents with cystic fibrosis: prevalence and associated factors. Thorax 200055798–804. [DOI] [PMC free article] [PubMed] [Google Scholar]
- 46.Haworth C S, Selby P L, Webb A K.et al Low bone mineral density in adults with cystic fibrosis. Thorax 199954961–967. [DOI] [PMC free article] [PubMed] [Google Scholar]
- 47.Bachrach L K, Loutit C W, Moss R B. Osteopenia in adults with cystic fibrosis. Am J Med 19949627–34. [DOI] [PubMed] [Google Scholar]
- 48.Grey A B, Ames R W, Matthews R D.et al Bone mineral density and body composition in adult patients with cystic fibrosis. Thorax 199348589–593. [DOI] [PMC free article] [PubMed] [Google Scholar]
- 49.Laursen E M, Molgaard C, Michaelsen K F.et al Bone mineral status in 134 patients with cystic fibrosis. Arch Dis Child 199981235–240. [DOI] [PMC free article] [PubMed] [Google Scholar]
- 50.Cole T J. Secular trends in growth. Proc Nutr Soc 200059317–324. [DOI] [PubMed] [Google Scholar]
- 51.McCarthy H D, Ellis S M, Cole T J. Central overweight and obesity in British youth aged 11–16 years: cross sectional surveys of waist circumference. BMJ 2003326624. [DOI] [PMC free article] [PubMed] [Google Scholar]
- 52.Shypailo R J, Ellis K J. Bone assessment in children: comparison of fan‐beam DXA analysis. J Clin Densitom 20058445–453. [DOI] [PubMed] [Google Scholar]
Associated Data
This section collects any data citations, data availability statements, or supplementary materials included in this article.