

Abstract
It is unknown to what extent the heterogeneity of antigen presenting cells (APC) influences the IFN-γ response of CD4 memory cells. We restimulated DO11.10 T cell receptor (TCR)-transgenic cells and wild-type CD4 memory cells with OVA-peptide 323 – 339 presented on purified dendritic cells (DC), macrophages, and B cells. Using IFN-γ ELISPOT assays we measured the number of cytokine producing T cells and the amount of cytokine produced by individual T cells at different time points after antigen encounter. The data showed that, when CD4 cells recognized antigen on DC, the induction of cytokine production was accelerated compared to macrophages and B cells. In contrast, the per-cell cytokine productivity was independent of the type of APC by which the T cells were re-stimulated. Moreover, the peptide concentration required for CD4 cell activation was comparable for the different APC. The data suggest that DC induce cytokine production in memory cells with accelerated activation kinetics, whereas 24 h of antigen stimulation on DC, macrophages, and B cells results in comparable levels of T cell activation. These data have implications for the understanding of T cell memory responses when T cells re-encounter antigen on different APC as well as for the monitoring of memory T cell responses ex vivo.
Introduction
Antigen-specific T cells commonly occur in low frequencies in vivo. Therefore, the detection and assessment of exact numbers of T cells in freshly isolated cell material such as lymphoid tissues and peripheral blood continues to be a major challenge [1, 2]. This information, however, is critical for the understanding of the adaptive T cell response in immune-mediated conditions such as allergy, transplantation, autoimmunity, and immune responses to tumors. Moreover, exact information about memory cell frequencies is paramount for the assessment of the efficacy of therapeutic immune interventions in these clinical conditions. In addition to the low frequencies of antigen-specific T cells, the determinant-heterogeneity of relevant antigens and the polymorphic/polygenic MHC system need to be taken into account when T cell immunity is to be measured comprehensively.
The advent of the tetramer technology has represented a major step towards accomplishing this goal [3, 4]. MHC-tetramers allow the identification of specific T cells by virtue of specific binding of MHC-peptide ligands to the T cell receptor (TCR). A weakness of the tetramer approach is that it determines the mere physical presence of T cells rather than their function. Chronically stimulated T cells frequently develop various states of unresponsiveness, including TCR zeta chain phosphorylation defects [5]. CD8 cells, engaged in the presence or absence of CD4 cell help, occur in similar frequencies after the primary immune response, but differ fundamentally in terms of functionality. The former represent memory cells that can exert effector functions, while the latter are “lethargic cells” that undergo apoptosis after antigen re-encounter and do not mediate immunity [6–8]. Functional T cells occur in different effector classes, such as Th1, Th2, and beyond [9–11]. In order to understand T cell-mediated immunity, it is essential to determine the function of T cells in addition to their specificity.
Assays that measure the function of antigen-specific T cells critically depend on antigen presenting cells (APC). In the absence of antigen, T cells are in a non-activated state and do not exert effector functions, such as the secretion of cytokines. An antigen encounter can lead to the activation of specific T cells, however, the outcome of T cell activation is thought to depend critically on the APC type/subtype on which the antigen is presented [12–14]. For example, the production of IFN-γ by primed Th1 memory cells is regulated by the ability of APC to produce IL-12 [15, 16]. One might therefore assume that a memory T cell capable of producing IFN-γ will secrete this cytokine only when it encounters an antigen on a dendritic cell (DC) or a macrophage, but not on a B cell. Assays aiming at the functional detection of antigen-specific T cells are typically performed with bulk cell populations, such as human peripheral mononuclear cells (PBMC) or murine lymphoid tissues. Such samples contain a heterogeneous APC population in which B cells are by far the most prevalent type. In these functional T cell assays, which are performed with cells in single cell suspension, the likelihood that a given T cell will encounter its specific antigen presented by a given APC will be a random event, and most T cells will recognize antigen presented by B cells. IFN-γ production is the most widely used measurement in functional T cell assays. It is not known whether the true numbers of antigen-specific T cells are quantified in these bulk populations, since B cells by far outnumber macrophages and DC, and may not elicit cytokine production in a large number of T cells that are capable of producing IFN-γ in vivo. Thus, the numbers of T cells specific for the antigen of interest might be markedly underestimated, because of the low prevalence of macrophages and DC in the assay.
Are ex vivo functional T cell measurements challenging because the “APC-compartment” limits the detection of antigen-specific T cells? If so, would assay optimizations, such as the use of purified DC, enhance the ability to detect all the antigen-specific T cells that have the capacity to secrete IFN-γ under optimized conditions of activation? We sought to gain insight into this question by using IFN-γ ELISPOT assays that allow the visualization and quantification of the secretory activity of individual T cells. We were particularly interested in the impact of APC function on T cell effector function because of its relevance for immune monitoring and therefore we focused our study on IFN-γ production. We measured the kinetics of cytokine production and the per-cell productivity of DO11.10 TCR-transgenic cells and wild-type OVA 323–339-specific CD4 memory cells after their encounter with antigen presented on B cells, macrophages, and DC of different maturation stages.
Materials and Methods
Mice, transgenic cells, antigens, immunizations
BALB/c mice and DO11.10 TCR transgenic mice (H-2d) [17] were purchased from The Jackson Laboratory (Bar Harbor, ME) and maintained at the animal facility of Case Western Reserve University (Cleveland, OH) under pathogen-free conditions. Female mice were used at 6–10 weeks of age in all immunization experiments, older mice (> 30 weeks) were used for isolation of DC for higher bone marrow cell yield. OVA 323–339 (KISQAVHAAHAEINEAG), an I-Ad -restricted peptide [18, 19] was purchased from Princeton Biomolecules (Langhorne, PA). The peptide was dissolved in double-distilled water at a concentration of 2 mM, aliquoted in a volume of 500μl, and stored at −20°C. Complete Freund’s Adjuvant (CFA) was prepared by mixing Mycobacterium tuberculosis H37RA (Difco, Detroit, MI) at 2.5 mg/ml into incomplete 0 Freund’s Adjuvant (IFA) (Life Technologies, Grand Island, NY). For immunizations, BALB/c mice were injected s.c. with 100 μl of 1 mg/mL OVA peptide in CFA and spleen cells were isolated at 21 days after immunization. Spleen cells from DO11.10 mice were cultured with OVA peptide 323–339 at 10 μg/ml for 7 days before the cells were plated in ELISPOT assays. This protocol induces a memory phenotype in essentially all DO11.10 cells [20–23]. For IFN-γ ELISPOTs, CD4 cells were separated from these restimulated spleen cells as described below.
Isolation of DC and macrophages from bone marrow cultures
Bone marrow cells were harvested from > 30 week old female BALB/c mice. Mice in the middle of their natural life span were used because their bone marrow yields higher cell numbers than young mice. Femurs were flushed with DMEM (Life Technologies, Rockville, MD), and cells were passed through a 70-μm cell strainer, washed 1x with DMEM and incubated in 0.83% NH4Cl to lyse erythrocytes. The cells were then incubated for 1h at 4° C with a cocktail of antibodies purified from supernatants of B hybridomas GK1.5 (anti-CD4), 53-6.72 (anti-CD8), RA3-3A1/61 (anti-B220), H116-32 (anti-I-AK), and 10-3.6.2 (anti- 10-3.6.2 (anti-I-Ak) (American Type Culture Collection (ATCC), Manassas, VA); each antibody was present at 20 μg/108 bone marrow cells. The cells were pelleted and resuspended for 1 h at 37°C in complement (Accurate, Westbury, NY) diluted 1:10 in RPMI 1640 (Life Technologies). Cells were cultured in 24-well plates (106 cells/well) in RPMI 1640 supplemented with 5% FCS, 50 μM 2-ME, 25 mM HEPES, 1mM sodium pyruvate, L-glutamine, penicillin/streptomycin, and 500 U/ml GM-CSF (PharMingen, San Diego, CA). Non-adherent cells were removed every 2 days by gently swirling the plates, removing approximately 2/3rd of the medium, and replacing it with fresh medium containing GM-CSF. Immature DCs were harvested on day 4, mature DCs on day 6. DCs were discriminated from macrophages by typical dendritic morphology as well as expression of high levels of CD11c and low expression of macrophage markers (F4/80 and CD11b) and the purity was routinely >90%. CD80 and CD86 staining demonstrated that mature DCs expressed higher levels of the maturation markers CD80 and CD86 compared to immature DC (Fig. 1).
Fig. 1.

Expression of costimulatory molecules CD80 and CD86 in immature and mature DCs. Immature (day 4) or mature (day 6) DCs were isolated from bone marrow cultures, stained for expression of co-stimulatory molecules CD80 or CD86 and examined by flow cytometry.
Bone marrow-derived macrophages were obtained from mouse femur bone marrow precursors cultured for 12 days in Petri dishes with standard medium containing 20% conditioned medium produced by M-CSF producing LADMAC cells. Standard Medium consisted of DMEM supplemented with 10% heat-inactivated FCS, 5 × 10⁻⁵ M 2-ME, 1mM sodium pyruvate, HEPES buffer, and penicillin/streptomycin (Life Technologies). Macrophages were detached with trypsin and a cell lifter (Corning-Costar, Corning, NY). The resulting cells were adherent, with macrophage like morphology and >98 % of the cells were CD11b-positive by flow-cytometry.
Cell separations
B cells were isolated from BALB/c spleens using commercially available B cell columns (Cedarlane, Hornby, ON, Canada) according to the instructions of the manufacturer. CD4 cells were separated by negative selection using CD4 isolation columns (R&D Systems, Minneapolis, MN). These columns routinely yielded a purity of > 95% as confirmed by FACS analysis. The resulting cells were washed, counted and resuspended at appropriate concentrations for use in the various assays.
ELISPOT assays
ELISPOT assays were performed as previously described [21]. Briefly, ELISPOT plates (Whatman Inc., Clifton, NJ) were coated overnight at 4°C with IFN-γ capture antibody (R46A2, 4 μg/ml). The plates were washed three times with PBS, then blocked with 1% BSA in PBS for 2h at room temperature. After washing, APC were plated in serum-free medium, HL-1 (BioWhittaker, Walkersville, MA), supplemented with L-glutamine and penicillin/streptomycin at the cell numbers specified for the individual experiments and OVA peptide at a final concentration of 100 μg/ml unless specified differently. CD4 cells were plated at 75,000 cells/well or as specified. As a positive control, anti-CD3 (2C11) mAb at 1 μg/ml was used. This antibody invariably stimulates T cells in the positive control wells to produce IFN-γ spots that are “too numerous too count”, corresponding to approximately 500 cells in all ELISPOT assays performed. After a 24 h incubation (or as specified differently) at 37°C in 5% CO2, the cells were removed by washing three times with PBS followed by four times with PBS containing 0.05% Tween (PBST).
Biotinylated IFN-γ detection antibody (XMG1.1-biotin, 0.25 μg/ml) was added and the plates were incubated at 4°C overnight. In the kinetics experiments, the cultures from time points earlier than 24h were terminated by washing the plates three times with PBS. The plates were stored until the harvest of the 24h plate, at which time plates were washed four times with PBST with subsequent addition of biotinylated IFN-γ detection antibody for an overnight incubation at 4°C. The plates were washed three times with PBST and subsequently streptavidin-HRP conjugate (DAKO, Carpinteria, CA) was added at a 1/2,000 dilution, incubated for 2 h at room temperature, and removed by washing twice with PBST and PBS. The spots were visualized by adding HRP substrate 3-amino-9-ethylcarbozole (Pierce, Rockford, IL). The plates were then washed with distilled water and air-dried. The resulting spots were counted using a computer assisted ELISPOT image analyzer (Series 1 ImmunoSpot Analyzer, Cellular Technology, Cleveland, OH) customized for analyzing ELISPOTs to meet objective criteria for size, chromatic density, shape, and color.
FACS analysis
Antibodies and appropriate isotype controls (eBioscience, San Diego CA) were used as follows: anti-CD80 (clone 16-10A1) and anti-CD86 (clone GL1). Isolated DCs were incubated for 20 min at 4°C in blocking buffer which contained 10% normal mouse serum in FACS buffer (0.1% BSA in PBS). Cells were washed 2x in FACS buffer, fixed using Cytofix/perm solution (BD Pharmingen, San Diego CA), and examined on a LSR I flow cytometer (BD Bioscience). All data were analyzed using FlowJo analysis software (Tree Star Inc, Ashland OR).
Results
Different activation kinetics of CD4 cells stimulated by different APC
Spleen cells from DO11.10 TCR-transgenic mice were isolated and cultured in vitro with OVA:323–339 peptide for seven days as described in Materials and Methods. After the in vitro stimulation these cells exhibit a Th1 memory phenotype as manifested by IFN-γ production and proliferation upon restimulation and express CD45RBlo CD44hi, L-selectinlo, a surface marker profile typical for memory cells [20–23]. These cells were stimulated with OVA:323–339 peptide in the presence of splenic B cells, macrophages and DC (both mature and immature), and IFN-γ ELISPOT assays of various durations were performed (Fig. 2A). When stimulated on mature DC, DO11.10 cells reached close to maximal activation within 4 hours. Their antigen encounter on immature DC resulted in half-maximal stimulation by this time point; maximal stimulation on these DC was reached at 6 h. In contrast, it took 24 h for the same number of DO11.10 cells to engage in IFN-γ production when antigen was recognized on B cells. The activation of DO11.10 cells on macrophages was intermediate between DC and B cells. In spite of the different time intervals at which IFN-γ production was induced in the individual DO11.10 cells, after 24 h stimulation the numbers of DO11.10 cells producing cytokine were comparable, irrespective of the APC type on which the T cells recognized their cognate antigen.
Fig. 2.

Frequencies of the DO11.10 cells (A) and wild-type OVA peptide-specific CD4 cells (B) as a function of time when activated on different APC types. DO11.10 cells and wild-type CD4 cells were stimulated with OVA peptide in the presence of immature DC, mature DC, macrophages, and B cells in IFN-γ ELISPOT assays. The cultures were terminated at the indicated time points by washing the plates in preparation for the addition of the secondary (“cytokine capture”) antibody. Instead of immediately adding the antibody, the membranes from early time points (2, 4, 6, and 12h) were subsequently stored until the harvest of the latest time point at 24h, at which time the membranes of all time points were washed or re-washed and the ELISPOT assay was continued for all plates/time points. DO11.10 cell and wild-type CD4 cell frequencies are shown. APC numbers were not limiting (as established in separate experiments, data not shown) with 25,000 DC, 50,000 macrophages, and 50,000 B cells plated per well for 10,000 DO11.10 cells and 75,000 wild-type CD4 cells, respectively. The results are representative for 3 independent experiments for both T cell groups. Each data point represents the mean of triplicate wells with the SD shown.
To complement the data obtained with the TCR-transgenic DO11.10 cells, we tested the activation kinetics of non-transgenic, wild-type CD4 memory cells under the above conditions. BALB/c mice were immunized with OVA:323–339 peptide, and their spleen CD4 cells were tested on the different APC populations in the presence of the OVA peptide (Fig. 2B). Compared to B cells, mature DC induced accelerated cytokine production in these primary CD4 cells. By 12 h, IFN-γ producing T cells reached close to maximal numbers when stimulated on DC, while cytokine producing T cells were not yet detected when B cells were the APC. Macrophages activated the primary CD4 cells at intermediate time intervals. Similar to the DO11.10 cells, the numbers of cytokine producing cells came close to one another by 24 h. This finding matches our previously published observation [24] and unpublished data from our laboratory that cytokine production in primary lymph node or spleen cells of mice, or human PBMC reaches maximal numbers within 24 hours of an ELISPOT assay.
Similar per cell IFN-γ productivity of CD4 cells stimulated by different APC
The above analysis focused on the time intervals at which T cells engage in cytokine production, but did not take into account the amount of cytokine produced by the individual T cells. The spot size in ELISPOTs provides information on the per cell cytokine productivity [21]. At 4h, the spots were relatively small for both immature and mature DC (approximately 0.05 mm2 on average, Fig. 3A), although the numbers of IFN-γ producing DO11.10 cells had already reached the levels seen after the entire duration of the assay (24h, Fig. 2A). The spot size continued to increase until 12h (Fig. 3A), whereas the numbers of cytokine producing cells re-stimulated on mature DC remained constant, as described above (Fig. 2A). DC, macrophages, and B cells induced spots of similar size in DO11.10 cells at all time points (Fig 3A), which is in striking contrast to the differences that were seen in the frequencies of cytokine producing cells that had been re-stimulated with the various APC. This APC–independent per-cell cytokine productivity was also seen for the primary CD4 cells (Fig. 3B). Detailed analysis of the spot size distribution showed that spot sizes under each condition followed a Gaussian distribution – the size distribution curves largely overlapped for both TCR-transgenic and wild-type CD4 cells after activation on the various types of APC at different time points (Fig. 3C, size distribution curves are illustrated for the DO11.10 cells). Therefore, the time intervals at which CD4 cells were activated on different APCs were markedly different, but the rate at which the cytokine was released per cell was largely unaffected by the different types of APC once cytokine production was initiated.
Fig. 3.

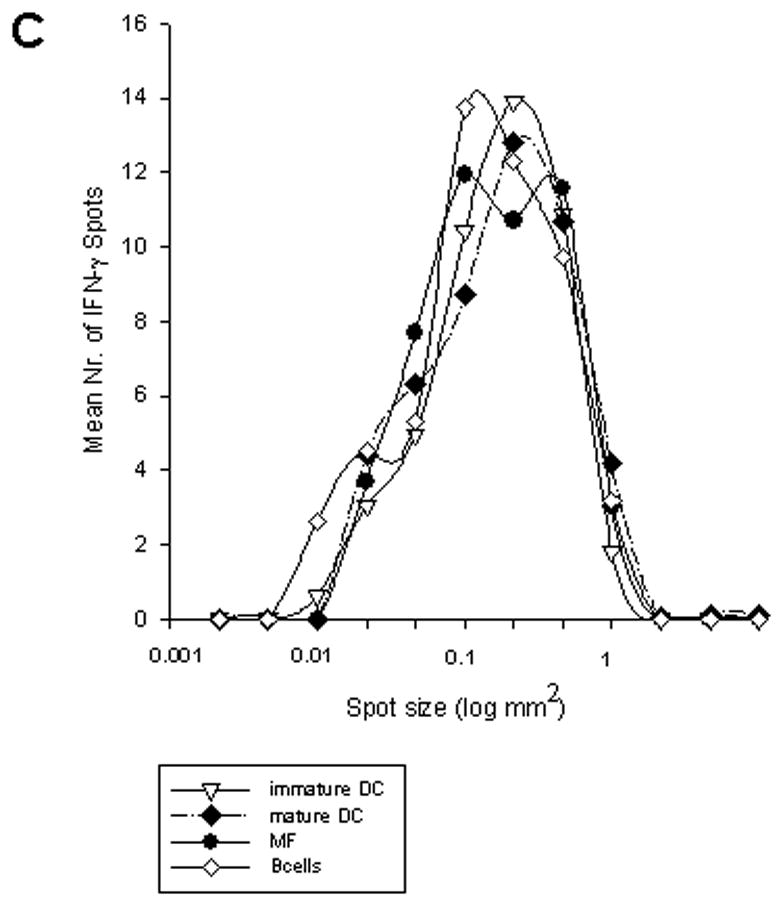
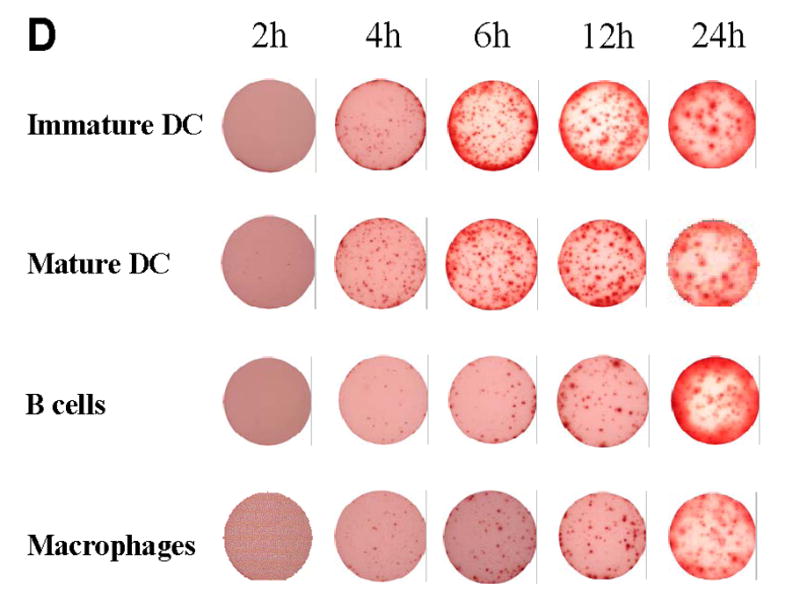
DO11.10 cells (A) and OVA peptide-specific CD4 cells (B) were stimulated with OVA peptide in the presence of immature DC, mature DC, macrophages, and B cells in IFN-γ ELISPOT assays of different durations as described in Fig. 2. Mean spot-sizes of DO11.10 and wild-type CD4 cells are shown for the individual time points. The results are representative for 3 independent experiments for both T cell groups. Each data point represents the mean of triplicate wells with SD are shown. C, spot size distribution for DO11.10 cells stimulated with maximal concentrations of OVA peptide (100μg/ml) in the presence of immature DC, mature DC, macrophages, and B cells in 24h IFN-γ ELISPOT assays. The numbers of IFN-γ spots in individual different spot size categories, corrected for the total numbers of IFN-γ spots for each APC type are shown. D, Characteristic images of ELISPOT wells at different time points of DO11.10 cell activation with OVA peptide on different APC are shown.
Similar antigen dose effect on IFN-γ production by CD4 cells activated on different APC
APC of different lineages express different levels of costimulatory molecules. For the activation of naïve T cells the signal afforded by the extent of TCR ligation (Signal 1, a function of MHC-peptide density on the APC and of the TCR’s affinity for the peptide) and by costimulatory molecules and their ligands (Signal 2, including CD40/CD40L, CD80/86/CD28, OX40/OX40L, and 4-1BBL/4-1BB) are additive [25]. These factors are also known to affect T memory/effector cell activation [26, 27]. Consequently, one might expect that different antigen doses (constituting Signal 1) will be required for T cell triggering upon antigen recognition on different APC. The dose response curve for an APC that expressed high-density costimulatory molecules (DC) would be expected to be left-shifted relative to an APC that expresses low levels of costimulatory molecules (such as a B cell). To test this hypothesis, we titrated soluble OVA-peptide over a wide range of concentrations in 24h IFN-γ ELISPOT assays. Because the peptide binds directly to MHC class II molecules on the cell surface, this system is independent of potential differences in antigen processing by the different APC, thus directly comparing costimulatory properties. APC numbers in these experiments were not limiting as tested in preliminary experiments using maximal peptide concentrations (100μg/ml, data not shown) and were similar for the different APC populations (in the range of 25,000 to 50,000).
Dose-response curves of DO11.10 cells re-stimulated with OVA-peptide on different APC were strikingly similar, with DC inducing slightly higher numbers at two of the lower peptide concentrations (Fig. 4A). The response curves were also largely comparable in all types of APC when both peptide dose and the number of DO11.10 cells were titrated (Fig. 5A–C). Although the data for different APC in Fig. 5 were generated in different experiments, the dose response curves showed half-maximal peptide concentration values (Keff) in a narrow range, between 1.3 and 3.5 μg/ml of the peptide (Fig. 5D) with one outlier (3,125 DO11.10 cells on mature DC, Keff of 0.3, Fig. 5D). Similarly, wild-type CD4 cells exhibited dose response curves that were overlapping one another at all concentrations. (Fig. 4B). The data show that the peptide concentration required for inducing IFN-γ production in transgenic DO11.10 and wild-type OVA-peptide specific cells is largely independent of the APC type.
Fig. 4.

Frequencies of IFN-γ producing DO11.10 and OVA-specific CD4 cells as a function of peptide dose and activation on different APC. DO11.10 cells (A) and OVA peptide-specific CD4 cells (B) were stimulated with increasing doses of OVA peptide in the presence of immature DC, mature DC, macrophages, and B cells in 24h IFN-γ ELISPOT assays. The means of triplicate wells with SD are shown.
Fig. 5.


Frequencies of IFN-γ producing DO11.10 cells as a function of peptide dose, T cell number, and APC type. Different numbers of DO11.10 cells were stimulated with increasing doses of OVA peptide in the presence of macrophages (A), mature DC (B), and B cells (C) in 24h IFN-γ ELISPOT assays as described in Fig. 2. The results are representative of 3 independent experiments, different APC were tested in separate experiments. Peptide concentrations at which 50% of the DO11.10 cells became activated (Keff values) were calculated from the dose-response curves in the experiments shown in A–C (D).
Discussion
To our knowledge, the data presented here represent the first in-depth study of the secretory IFN-γ response by CD4 memory cells upon antigen encounter on different APC types. The findings have implications for CD4 cell biology in general and are important for immune monitoring.
The type of APC critically defines the outcome of T cell activation. DC are known as the most potent APC. They actively transfer antigen from the immune periphery to draining lymph nodes where they play a critical role in the priming of naïve T cells [28]. In contrast, antigen encounter by naïve CD4 cells on B cells results in the induction of tolerance [29]. In vivo, a highly developed lymphoid architecture along with defined migration pathways ascertain the encounter of naïve CD4 cells with the proper APC [30–32]. For CD8 cells, chemokines have recently been shown to play a critical role in attracting the few antigen-specific naïve cells to the site of DC-CD4 cell interaction in lymph nodes [33]. The impact of the APC type on memory CD4 cell function upon antigen re-encounter is less well defined. We analyzed the role of different APC for the induction of IFN-γ production by CD4 memory cells.
DO11.10 cells provided a defined population of CD4 cells for our study. DO11.10 cells are naïve at isolation from the transgenic mouse and, like naïve CD4 cells in general, do not produce IFN-γ [34]. In order to convert these cells into IFN-γ producing memory cells we primed them in vitro with their cognate peptide OVA: 223-239. After one week of culture, all T cells express activation markers and undergo proliferation, but only about 1 % have yet committed to IFN-γ expression by this early time point [21, 35]. The data obtained in this set of experiments reproduced this observation made by us and by others– the maximal numbers of IFN-γ producing DO11.10 cells (after one week in culture) were in the range of 1–2 % of the DO11.10 cells plated (Figs. 2A & 5A–C). Importantly, within 24h of antigen stimulation CD4 cells reached these maximum numbers irrespective of the type of APC on which they encountered antigen. However, the time intervals at which IFN-γ production was induced varied significantly for the different APC.
When DC presented the antigen, nearly all DO11.10 cells capable of IFN-γ production started to secrete the cytokine within 4h. However, when the antigen was presented by B cells, after 4h only ~1/10th of the DO11.10 cells secreted the cytokine, and it took 24h for all DO11.10 cells capable of producing the cytokine to engage in secretory activity. The time intervals at which individual CD4 cells became activated on DC or B cells were fundamentally different, even though all other parameters were kept constant. We used peptide for stimulation, which directly binds to class II molecules on the surface of the APC, bypassing the need for (and possible differences in) antigen processing. The peptide dose used was identical in these experiments. The APC were present in a monolayer, and in an approximately 4-fold excess over the DO11.10 cells, assuring instantaneous contact of the T cells with the APC. Although DC can actively capture T cells with their dendrites, in this setting they should not be at an advantage because of their ability to make rapid and efficient contact. Indeed, the ability to make mere contact between the APC and the T cells appeared not to be a critical factor in defining the activation kinetics because titrating DC, B cells and macrophages, as well as CD4 cells over a wide range did not alter the peptide titration results described above. The difference between the more rapid time of induction of IFN-γ production between DC and B cells or macrophages could result from enhanced membrane mobility. Although the timing of the initial contact and the ratio of APC coming into contact with T cells was the same for DC and B cells, DC are likely to provide a larger contact area for the T cell interaction, because they are able to engulf T cells with their dendrites [28]. This could result in the engagement of a higher number of TCR and other molecules on the surface of the T cell that are engaged in generating the activation signal cascade [36]. T cells have been found to “count” the number of TCR that are involved in the interaction with the APC, and a T cell becomes activated once a critical threshold number is reached [37, 38]. In the case of such enhanced membrane interactions, DC should be able to more rapidly engage the critical number of TCR compared to B cells. In addition, DC express higher densities of costimulatory molecules that may also contribute to the differences seen. Finally, IL-12 facilitates IFN-γ expression in T cells [15, 16]. DC, capable of producing IL-12, can provide such “costimulation”, while B cells, which do not produce IL-12, cannot. While all of these mechanisms, and possibly others, are likely to contribute to the different activation kinetics seen among the APC, IL-12 may play a dominant role. Thus, when we studied the induction of IFN-γ production by CD4 memory cells on IL-12 knockout (KO) vs. wild-type APC, we observed a mere delay in the activation kinetics: the production of IFN-γ was delayed on IL-12 KO APC, but after 24 h the differences were no longer seen [39].
Once T cells engage in IFN-γ production, they appear to secrete at a rather constant rate over a prolonged period of time. The spot sizes and densities steadily increase over the first 12 hours of antigen exposure. The rate of increase was similar for the different APC (Fig. 3A and B). While the time period required to initiate cytokine production showed characteristic APC-dependent differences, CD4 cells secreted IFN-γ at a constant rate once they had engaged in cytokine production. This rate was independent of the APC presenting the antigen and independent of the quality of the signal that had initially led to the activation of the T cell.
In ELISPOT assays the cytokine is continuously captured on the membrane around the secreting cell, providing an “integral” of cytokine produced over time. Therefore, it might be unexpected that spot numbers can decline after reaching a peak – as seen for DO11.10 cells activated on DC (Fig. 2A). This decline in spot numbers was invariably associated with a tendency for the spots to become fainter and more diffuse (see Fig 3D, 12h vs. 24h). The phenomenon is likely to result from lateral diffusion and dissociation of the plate-bound cytokine after the cells stop secreting. Thus, in previous work we made the observation that spots grew fainter and became larger when plates were stored with PBS after cell removal as opposed to immediate development [24]. Therefore, these data obtained with DO11.10 cells suggest that they stop producing IFN-γ after 12 hours when activated on DC, while these T cell cells still produce the cytokine at the 24th hour after when B cells function as APC.
Measurements of per cell produced cytokine by ELISPOT (or by intracytoplasmic staining) typically result in a Gaussian distribution [21, 40] as we have seen in this study. That is, even in a clonal population of T cells (such as the DO11.10 cells), the amount of per-cell produced cytokine varied over a wide range following a normal distribution. This observation possibly results from the different TCR- and costimulatory molecule density on T cells: when T cells are stained for such cell surface markers, each of them show normal distribution. Therefore, there will be some cells that receive stronger signals than others even when the T cells are clonal. Normal distribution of spots was seen at all time points tested, and with all APC types. Although the kinetics with which T cells became activated on the different APC showed a characteristic pattern, the mean spot size (and normal distribution) was similar for CD4 cells activated on the different APC. IFN-γ production by CD4 cells therefore not only occurred at the same average-rate, but also with the same per-cell productivity range. This notion has implications for the image analysis of ELISPOTs, demonstrating that one set of gating parameters can be used to discern single IFN-γ producing cells independent of the type of APC that induced the cytokine production.
When DO11.10 cells are compared with wild-type CD4 cells, DO.11.10 cells were activated with accelerated kinetics on all types of APC studied. DO11.10 cells were primed in vitro 7 days prior to the ELISPOTs, thus they were tested in a pre-activated state. The CD4 cells isolated from OVA peptide immunized wild-type mice were primed 3 weeks earlier by the immunization. It is possible that the difference in antigen history of the CD4 cells, that is, the time at which the antigen was last encountered, explains the difference in activation kinetics. Indeed, we have previously established that the time elapsed since the last antigen encounter can determine the activation threshold for T cells [24]. However, despite the delayed activation kinetics compared to the DO11.10 cells, frequencies (Fig. 2B) and per cell productivity (Fig. 3B) of wild-type CD4 cells approximated one another after 24 hours, when they were stimulated on the different types of APC (although at different levels compared to the DO11.10 cells).
The dependence of IFN-γ production by CD4 cells on different types of APC is of great interest for immune monitoring. When CD4 cells are studied in isolates of peripheral blood or lymphoid tissues ex vivo, single cell suspensions are tested that contain different APC lineages. It is unclear to what extent this APC heterogeneity in the assay system can affect the result. Another aspect that is poorly understood is whether the detection of antigen-specific CD4 cells is limited by the availability of certain APC types such as DC in the test material.
DC constitute a low percentage of the APC in bulk samples. The antigen specific cells of interest frequently occur at low frequencies as well. Since the samples are tested in single cell suspensions, they lack the structures that guide APC-T cell interactions in vivo. In the presence of mixed APC populations, the probability with which a given (low frequency) T cell will encounter its cognate antigen on a particular (low frequency) type of APC will be a chance event. Consequently, a substantial proportion of the antigen specific T cells will go undetected if the measured effector function critically depends on a rare type of APC. For the purpose of immune monitoring, our data suggest that differences in activation kinetics imposed by different APC should not impact the results when the cells are stimulated for 24h. Empirically, 24h stimulation cultures have been found most suitable for the ELISPOT assay. Our data provide an explanation as to why 24h culture duration is required for the assay. The data should also help to interpret IFN-γ ELISPOT assays aimed at assessing the clonal sizes of antigen-specific T cells in vivo in freshly isolated bulk cell populations.
In summary, high-resolution analysis of IFN-γ production by CD4 cells showed accelerated activation kinetics of TCR transgenic and wild-type CD4 cells on DC compared to macrophages and B cells. By 24 h after activation, these differences are no longer detectable. Therefore, the impact of APC on the IFN-γ response of CD4 memory cells is limited to the early stages of the cytokine response.
Acknowledgments
We thank Dr. Ioana Moldovan for valuable discussions. This work was supported by grants to P.V.L from the National Institutes of Health (DK-48799, AI-42635, AI/DK44484). P.A.O. was supported by a Fellowship by the Deutsche Forschungsgemeinschaft.
Footnotes
Publisher's Disclaimer: This is a PDF file of an unedited manuscript that has been accepted for publication. As a service to our customers we are providing this early version of the manuscript. The manuscript will undergo copyediting, typesetting, and review of the resulting proof before it is published in its final citable form. Please note that during the production process errors may be discovered which could affect the content, and all legal disclaimers that apply to the journal pertain.
References
- 1.Helms T, Boehm BO, Asaad RJ, Trezza RP, Lehmann PV, Tary-Lehmann M. Direct visualization of cytokine-producing recall antigen-specific CD4 memory T cells in healthy individuals and HIV patients. J Immunol. 2000;164(7):3723–32. doi: 10.4049/jimmunol.164.7.3723. [DOI] [PubMed] [Google Scholar]
- 2.Targoni OS, Baus J, Hofstetter HH, Hesse MD, Karulin AY, Boehm BO, Forsthuber TG, Lehmann PV. Frequencies of neuroantigen-specific T cells in the central nervous system versus the immune periphery during the course of experimental allergic encephalomyelitis. J Immunol. 2001;166(7):4757–64. doi: 10.4049/jimmunol.166.7.4757. [DOI] [PubMed] [Google Scholar]
- 3.Altman JD, Moss PA, Goulder PJ, Barouch DH, McHeyzer-Williams MG, Bell JI, McMichael AJ, Davis MM. Phenotypic analysis of antigen-specific T lymphocytes. Science. 1996;274(5284):94–6. doi: 10.1126/science.274.5284.94. [DOI] [PubMed] [Google Scholar]
- 4.Murali-Krishna K, Altman JD, Suresh M, Sourdive DJ, Zajac AJ, Miller JD, Slansky J, Ahmed R. Counting antigen-specific CD8 T cells: a reevaluation of bystander activation during viral infection. Immunity. 1998;8(2):177–87. doi: 10.1016/s1074-7613(00)80470-7. [DOI] [PubMed] [Google Scholar]
- 5.Migita K, Eguchi K, Kawabe Y, Tsukada T, Ichinose Y, Nagataki S, Ochi A. Defective TCR-mediated signaling in anergic T cells. J Immunol. 1995;155(11):5083–7. [PubMed] [Google Scholar]
- 6.Bourgeois C, Rocha B, Tanchot C. A role for CD40 expression on CD8+ T cells in the generation of CD8+ T cell memory. Science. 2002;297(5589):2060–3. doi: 10.1126/science.1072615. [DOI] [PubMed] [Google Scholar]
- 7.Rocha B, Tanchot C. Towards a cellular definition of CD8+ T-cell memory: the role of CD4+ T-cell help in CD8+ T-cell responses. Curr Opin Immunol. 2004;16(3):259–63. doi: 10.1016/j.coi.2004.03.004. [DOI] [PubMed] [Google Scholar]
- 8.Sun JC, Bevan MJ. Defective CD8 T cell memory following acute infection without CD4 T cell help. Science. 2003;300(5617):339–42. doi: 10.1126/science.1083317. [DOI] [PMC free article] [PubMed] [Google Scholar]
- 9.McGuirk P, Mills KH. Pathogen-specific regulatory T cells provoke a shift in the Th1/Th2 paradigm in immunity to infectious diseases. Trends Immunol. 2002;23(9):450–5. doi: 10.1016/s1471-4906(02)02288-3. [DOI] [PubMed] [Google Scholar]
- 10.Street NE, Mosmann TR. Functional diversity of T lymphocytes due to secretion of different cytokine patterns. Faseb J. 1991;5(2):171–7. doi: 10.1096/fasebj.5.2.1825981. [DOI] [PubMed] [Google Scholar]
- 11.Yip HC, Karulin AY, Tary-Lehmann M, et al. Adjuvant-guided type-1 and type-2 immunity: infectious/noninfectious dichotomy defines the class of response. J Immunol. 1999;162(7):3942–9. [PubMed] [Google Scholar]
- 12.Fitch FW, McKisic MD, Lancki DW, Gajewski TF. Differential regulation of murine T lymphocyte subsets. Annu Rev Immunol. 1993;11:29–48. doi: 10.1146/annurev.iy.11.040193.000333. [DOI] [PubMed] [Google Scholar]
- 13.Hawiger D, Inaba K, Dorsett Y, et al. Dendritic cells induce peripheral T cell unresponsiveness under steady state conditions in vivo. J Exp Med. 2001;194(6):769–79. doi: 10.1084/jem.194.6.769. [DOI] [PMC free article] [PubMed] [Google Scholar]
- 14.Morelli AE, Rubin JP, Erdos G, et al. CD4+ T cell responses elicited by different subsets of human skin migratory dendritic cells. J Immunol. 2005;175(12):7905–15. doi: 10.4049/jimmunol.175.12.7905. [DOI] [PubMed] [Google Scholar]
- 15.Manetti R, Parronchi P, Giudizi MG, Piccinni MP, Maggi E, Trinchieri G, Romagnani S. Natural killer cell stimulatory factor (interleukin 12 [IL-12]) induces T helper type 1 (Th1)-specific immune responses and inhibits the development of IL-4-producing Th cells. J Exp Med. 1993;177(4):1199–204. doi: 10.1084/jem.177.4.1199. [DOI] [PMC free article] [PubMed] [Google Scholar]
- 16.Hsieh CS, Macatonia SE, Tripp CS, Wolf SF, O’Garra A, Murphy KM. Development of TH1 CD4+ T cells through IL-12 produced by Listeria-induced macrophages. Science. 1993;260(5107):547–9. doi: 10.1126/science.8097338. [DOI] [PubMed] [Google Scholar]
- 17.Murphy KM, Heimberger AB, Loh DY. Induction by antigen of intrathymic apoptosis of CD4+CD8+TCRlo thymocytes in vivo. Science. 1990;250(4988):1720–3. doi: 10.1126/science.2125367. [DOI] [PubMed] [Google Scholar]
- 18.Robertson JM, Jensen PE, Evavold BD. DO11.10 and OT-II T cells recognize a C-terminal ovalbumin 323-339 epitope. J Immunol. 2000;164(9):4706–12. doi: 10.4049/jimmunol.164.9.4706. [DOI] [PubMed] [Google Scholar]
- 19.Shimonkevitz R, Colon S, Kappler JW, Marrack P, Grey HM. Antigen recognition by H-2-restricted T cells. II. A tryptic ovalbumin peptide that substitutes for processed antigen. J Immunol. 1984;133(4):2067–74. [PubMed] [Google Scholar]
- 20.Hosken NA, Shibuya K, Heath AW, Murphy KM, O’Garra A. The effect of antigen dose on CD4+ T helper cell phenotype development in a T cell receptor-alpha beta-transgenic model. J Exp Med. 1995;182(5):1579–84. doi: 10.1084/jem.182.5.1579. [DOI] [PMC free article] [PubMed] [Google Scholar]
- 21.Karulin AY, Hesse MD, Tary-Lehmann M, Lehmann PV. Single-cytokine-producing CD4 memory cells predominate in type 1 and type 2 immunity. J Immunol. 2000;164(4):1862–72. doi: 10.4049/jimmunol.164.4.1862. [DOI] [PubMed] [Google Scholar]
- 22.Lee WT, Pelletier WJ. Visualizing memory phenotype development after in vitro stimulation of CD4(+) T cells. Cell Immunol. 1998;188(1):1–11. doi: 10.1006/cimm.1998.1341. [DOI] [PubMed] [Google Scholar]
- 23.Schweitzer AN, Sharpe AH. Studies using antigen-presenting cells lacking expression of both B7-1 (CD80) and B7-2 (CD86) show distinct requirements for B7 molecules during priming versus restimulation of Th2 but not Th1 cytokine production. J Immunol. 1998;161(6):2762–71. [PubMed] [Google Scholar]
- 24.Hesse MD, Karulin AY, Boehm BO, Lehmann PV, Tary-Lehmann M. A T cell clone’s avidity is a function of its activation state. J Immunol. 2001;167(3):1353–61. doi: 10.4049/jimmunol.167.3.1353. [DOI] [PubMed] [Google Scholar]
- 25.Acuto O, Michel F. CD28-mediated co-stimulation: a quantitative support for TCR signalling. Nat Rev Immunol. 2003;3(12):939–51. doi: 10.1038/nri1248. [DOI] [PubMed] [Google Scholar]
- 26.Bertram EM, Dawicki W, Sedgmen B, Bramson JL, Lynch DH, Watts TH. A switch in costimulation from CD28 to 4-1BB during primary versus secondary CD8 T cell response to influenza in vivo. J Immunol. 2004;172(2):981–8. doi: 10.4049/jimmunol.172.2.981. [DOI] [PubMed] [Google Scholar]
- 27.Ott PA, Berner BR, Herzog BA, et al. CD28 costimulation enhances the sensitivity of the ELISPOT assay for detection of antigen-specific memory effector CD4 and CD8 cell populations in human diseases. J Immunol Methods. 2004;285(2):223–35. doi: 10.1016/j.jim.2003.12.007. [DOI] [PubMed] [Google Scholar]
- 28.Banchereau J, Steinman RM. Dendritic cells and the control of immunity. Nature. 1998;392(6673):245–52. doi: 10.1038/32588. [DOI] [PubMed] [Google Scholar]
- 29.Melo ME, El-Amine M, Tonnetti L, Fleischman L, Scott DW. Gene therapeutic approaches to induction and maintenance of tolerance. Int Rev Immunol. 2001;20(5):627–45. doi: 10.3109/08830180109045582. [DOI] [PubMed] [Google Scholar]
- 30.Forster R, Schubel A, Breitfeld D, Kremmer E, Renner-Muller I, Wolf E, Lipp M. CCR7 coordinates the primary immune response by establishing functional microenvironments in secondary lymphoid organs. Cell. 1999;99(1):23–33. doi: 10.1016/s0092-8674(00)80059-8. [DOI] [PubMed] [Google Scholar]
- 31.Gunn MD, Kyuwa S, Tam C, Kakiuchi T, Matsuzawa A, Williams LT, Nakano H. Mice lacking expression of secondary lymphoid organ chemokine have defects in lymphocyte homing and dendritic cell localization. J Exp Med. 1999;189(3):451–60. doi: 10.1084/jem.189.3.451. [DOI] [PMC free article] [PubMed] [Google Scholar]
- 32.Sumen C, Mempel TR, Mazo IB, von Andrian UH. Intravital microscopy: visualizing immunity in context. Immunity. 2004;21(3):315–29. doi: 10.1016/j.immuni.2004.08.006. [DOI] [PubMed] [Google Scholar]
- 33.Castellino F, Huang AY, Altan-Bonnet G, Stoll S, Scheinecker C, Germain RN. Chemokines enhance immunity by guiding naive CD8+ T cells to sites of CD4+ T cell-dendritic cell interaction. Nature. 2006;440(7086):890–5. doi: 10.1038/nature04651. [DOI] [PubMed] [Google Scholar]
- 34.Wang X, Mosmann T. In vivo priming of CD4 T cells that produce interleukin (IL)-2 but not IL-4 or interferon (IFN)-gamma, and can subsequently differentiate into IL-4- or IFN-gamma-secreting cells. J Exp Med. 2001;194(8):1069–80. doi: 10.1084/jem.194.8.1069. [DOI] [PMC free article] [PubMed] [Google Scholar]
- 35.Rogers WO, Weaver CT, Kraus LA, Li J, Li L, Bucy RP. Visualization of antigen-specific T cell activation and cytokine expression in vivo. J Immunol. 1997;158(2):649–57. [PubMed] [Google Scholar]
- 36.Kinashi T. Intracellular signalling controlling integrin activation in lymphocytes. Nat Rev Immunol. 2005;5(7):546–59. doi: 10.1038/nri1646. [DOI] [PubMed] [Google Scholar]
- 37.Rachmilewitz J, Lanzavecchia A. A temporal and spatial summation model for T-cell activation: signal integration and antigen decoding. Trends Immunol. 2002;23(12):592–5. doi: 10.1016/s1471-4906(02)02342-6. [DOI] [PubMed] [Google Scholar]
- 38.Valitutti S, Muller S, Cella M, Padovan E, Lanzavecchia A. Serial triggering of many T-cell receptors by a few peptide-MHC complexes. Nature. 1995;375(6527):148–51. doi: 10.1038/375148a0. [DOI] [PubMed] [Google Scholar]
- 39.Hofstetter HH, Karulin AY, Forsthuber TG, Ott PA, Tary-Lehmann M, Lehmann PV. The cytokine signature of MOG-specific CD4 cells in the EAE of C57BL/6 mice. J Neuroimmunol. 2005;170(1–2):105–14. doi: 10.1016/j.jneuroim.2005.09.004. [DOI] [PubMed] [Google Scholar]
- 40.Guerkov RE, Targoni OS, Kreher CR, Boehm BO, Herrera MT, Tary-Lehmann M, Lehmann PV, Schwander SK. Detection of low-frequency antigen-specific IL-10-producing CD4(+) T cells via ELISPOT in PBMC: cognate vs. nonspecific production of the cytokine. J Immunol Methods. 2003;279(1–2):111–21. doi: 10.1016/s0022-1759(03)00240-0. [DOI] [PubMed] [Google Scholar]