Abstract
A sensitive and specific liquid chromatography-mass spectrometry (LC-MS) method has been developed and validated for the enantioselective determination of ifosfamide [(R)-IF and (S)-IF] in human plasma and for the detection of the N-dechloroethylated metabolites of IF, 2-N-dechloroethylifosfamide [(R)-2-DCl-IF and (S)-2-DCl-IF] and 3-N-dechloroethylifosfamide [(R)-3-DCl-IF and (S)-3-DCl-IF]. IF, 2-DCl-IF and 3-DCl-IF were extracted from plasma using solid-phase extraction and resolved by liquid chromatography on a column containing a Chirabiotic T chiral stationary phase. The enantioselective separations were achieved using a mobile phase composed of 2-propanol:methanol (60:40 v/v) and a flow rate of 0.5 ml/min. The observed enantioselectivities (α) for IF, 2-DCl-IF and 3-DCl-IF were 1.20, 1.17 and 1.20, respectively. The calibration curve was linear in the concentration range of 37.50-4800 ng/ml for each ifosfamide enantiomer (r2 > 0.997). The lower limit of detection (LLOD) was 5.00 ng/ml. The inter- and intra-day precision ranged from 3.63 to 15.8 % relative standard deviation (RSD) and 10.1 to 14.3 % RSD, respectively, and the accuracy ranged from 89.2 to 101.5 % of the nominal values. The method was applied to the analysis of plasma samples obtained from a cancer patient who received 3.75 g/m2/d dose of (R,S)-ifosfamide as a 96-h continuous infusion.
Keywords: chiral separations, cancer chemotherapy, ifosfamide metabolites, chirobiotic T CSP
Introduction
Ifosfamide (IF; Fig. 1) is an alkylating oxazaphosphorine anticancer agent routinely used in the treatment of a variety of pediatric and adult tumors including soft tissue sarcomas and lymphomas [1-5]. IF contains a chiral center at the phosphorus atom and is clinically administrated as a racemic (50:50) mixture of (R)-IF and (S)-IF.
Figure 1.
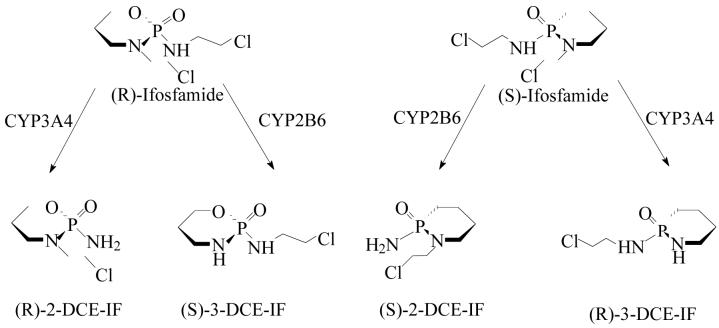
The N-dechloroethylation of (R)- and (S)-ifosfamide by cytochrome P450 enzymes (CYP 3A4 and CYP 2B6) to yield the 2-N-dechloroethyl (2-DCE-IFF) and 3-N-dechloroethyl (3-DCE-IFF) metabolites. Reprinted with permission from [11].
IF is a prodrug and requires biotransformation via cytochrome P450 (CYP) enzymes in order to exert its cytotoxic activity. The hepatic metabolism of IF has been extensively studied and occurs in the liver by two major pathways, Fig. 1 [6-11]. One pathway involves the 4-hydroxylation of IF and eventually leads to the production of the cytotoxic isophosphoramide mustard [6]. The 4-hydroxylation of R-IF is catalyzed by CYP3A4 and the 4-hydroxylation of S-IF by CYP2B6 [10,11].
The second pathway involves the oxidation of either the exocyclic-N2- or endocylic-N3-chloroethyl moieties producing the therapeutically inactive 2-N-dechloroethyl-ifosfamide [(R)- and (S)-2-DCl-IF] and 3-N-dechloroethylifosfamide [(R)- and (S)-3-DCl-IF] [6,12], Fig. 1. (S)-IF is metabolized to (R)-3-DCl-IF by CYP3A4 and (S)-2-DCl-IF by CYP2B6 while the (R)-IF enantiomer is metabolized to (R)-2-DCl-IF by CYP3A4 and (S)-3-DCl-IF by CYP2B6, where the apparent change in configuration at the chiral phosphorous moiety is a function of the Cahn-Ingold-Prelog nomenclature [11,13].
Clinically, the N-dechloroethylation pathway has been associated with treatment-ending central nervous system (CNS) toxicity [5,7-9]. The N-dechloroethylation pathway is regioselective and enantioselective [10,11] and, as a result, (R)-IF and (S)-IF have distinct efficacy and toxicity profiles. Clinical studies and in in vitro experiments have demonstrated that (S)-IF is more extensively cleared by N-dechloroethylation than (R)-IF [9,14-17]. In addition, clinical studies have indicated that treatment related CNS toxicities were associated with inter-patient variations in the cumulative urinary excretion of the (S)-IF metabolite (R)-3-DCl-IF [9,16]. Thus, it is important that clinical studies include an enantioselective determination of the disposition of (R)- and (S)-IF as well as a measurement of the relative concentrations of their N-decholorethylated metabolites [16,17].
A number of enantioselective gas chromatography and HPLC methods have been developed for quantifying (R)- and (S)-IF and their respective N-dechloroethylated metabolites. Gas chromatography methods utilizing chiral stationary phases (CSPs) coated on glass capillaries have been extensively used for the enantioselective analysis of IF enantiomers in human plasma and urine [14,18-21]. These assays were also capable of the enantioselective resolution of 2-DCl-IF and 3-DCl-IF and, when coupled with mass spectrometric or nitrogen-selective detectors, able to quantify these compounds in biological matrices.
HPLC has also been used to resolve (R,S)-IF by applying different methods of detection including ultraviolet [22], fluorescence [10,15] or mass spectrometry detection [14,17,23,24]. Blaschke reported the initial separation using a polyacrylamide CSP [25] and subsequent enantioselective separations were achieved using the Chiracel OD [26] and AGP [27] CSPs. The latter assays were validated and used to assay plasma samples obtained during clinical studies. The Chiracel OD CSP was also used to simultaneously enantioselectively resolve (R,S)-IF, (R,S)-2-DCl-IF and (R,S)-3-DCl-IF in plasma and urine, but the liquid chromatography assay was not validated or applied to samples obtained during a clinical study [21].
However, a key problem in the application of enantioselective HPLC methods to routine clinical analysis is the fact that IF and its N-dechloroethylated metabolites lack a strong chromophore, see Fig. 1. When UV detection was used, the target compounds were monitored at λ = 205-210 nm, which made the analysis difficult due to solvent absorption at the same wavelength. A more sensitive achiral LC-MS method for the separation and analysis of IF and its N-dechloroethylated metabolites in rat microsomal medium has been recently reported [23], and our laboratory has reported preliminary results with an enantioselective LC-MS method [28]. In the latter approach, (R,S)-IF and (R,S)-2-DCl-IF were enantioselectively resolved using a CSP containing the macrocyclic antibiotic teicoplanin, the Chirabiotic T CSP, and detected by mass spectrometry using either an electrospray or atmospheric pressure chemical ionization interface. However, (R,S)-3-DCl-IF was not enantioselectively separated under the chromatographic conditions used in the study [28].
We now report the development and validation of an enantioselective LC-MS assay for the determination of (R)- and (S)-IF in human plasma. The assay utilizes the Chirabiotic T CSP chiral column and the chiral separations were achieved using a polar organic mode, where the mobile phase was composed of 2-propanol:methanol (60:40 v/v) solvents. The reported method is also able to enantioselectively resolve (R,S)-2-DCl-IF and (R,S)-3-DCl-IF and can be used to determine the relative concentrations of the compounds in human plasma. The assay has been applied to the study of plasma samples obtained from a clinical study employing (R,S)-IF.
2. Experimental
2.1. Materials
(R, S)-IF was obtained from Sequoia Research Products Ltd (Oxford, UK). (R)-IF and (S)-IF were prepared by Advanced Separation Technologies Inc. (Whippany, NJ, USA) using an enantioselective HPLC separation of (R,S)-IF accomplished using a Chirabiotic T2 (10μm) chiral column and a mobile phase composed of water:2-propanol (80:20 v/v) delivered at a flow rate of 30 ml/min. (R, S)-2-DCl-IF and (R,S)-3-DCl-IF were generously provided by the Central Analytical Services Department of Asta Group Research (Frankfurt, Germany). (R)-IF and (S)-IF standards were kindly provided by Prof. G. Blaschke (Westfalishe Wilhelms- Universität Münster, Münster, Germany).
HPLC grade 2-propanol, methanol, acetonitrile, ethanol and hexane were purchased from Fisher Scientific (Fair Lawn, NJ, USA). HPLC-reagent grade ammonium acetate was obtained from J.T. Baker (Phillipsburg, NJ, USA). Formic Acid 96%, ethylenediaminetetraacetic acid disodium salt dehydrates 99%, magnesium chloride and β-nicotinamide adenine dinucleotide phosphate reduced tetrasodium salts were obtained from Sigma-Aldrich (St. Louis, MO, USA). Purified water was obtained using a Milli-Q water purification system (Millipore, Milford, MA, USA). Pooled control human plasma was received from the Apheresis Unit, National Institute on Aging (Baltimore, MD, USA). Solid phase extraction cartridges were Oasis HLB 1cc, 30mg (Waters, Milford, MA, USA). Solid phase extraction was performed using a 12-port vacuum manifold, PrepSep from Fisher Scientific (Fair Lawn, NJ, USA).
2.2. Equipment
The analytical system consisted of a LC system Series 1100 (Agilent Technologies, Palo Alto, Ca, USA) equipped with a vacuum degasser (G1322 A), a binary pump (1312 A), an auto sampler (G1313A), a thermostated column compartment (G1316 A) and a MSD mass spectrometer fitted with an electrospray ionization source operated in single ion monitoring (SIM) mode. The designated ions of interest were m/z 283.0 for [M+Na] of R-IF and S-IF and m/z 199.1 for [M+H] of 2-DCl-IF and 3-DCl-IF. The MSD parameters were optimized and were as follows: fragmentor: 70V; drying gas flow rate: 10.0 L/min; nebulizer pressure: 35 psig; drying gas temperature: 350 °C and capillary voltage: 3000 V. Data was acquired by ChemStation software.
2.3. Chromatographic Conditions
The chiral separation of (R)- and (S)-IF, (R)- and (S)-2-DCl-IF and (R)- and (S)-3-DCl-IF was achieved using a Chirabiotic T column (250 × 4.6 mm I.D., 5 um particle size) connected with a Chirabiotic T guard column (20.0 × 4.0 mm I.D.), both purchased from Advanced Separation Technologies Inc.(Whippany, NJ, USA).
The chromatography was carried out using isocratic elution mode with a mobile phase consisting of 2-propanol:methanol (60:40 v/v) at a flow rate of 0.5 ml/min. The column was kept at room temperature and the volume of injection was 10 μl. The auto sampler temperature was kept at 4°C. (R)- and (S)-IF, (R)- and (S)-2-DCl-IF and (R)- and (S)-3-DCl-IF were quantified based on calibration curves generated for (R)- and (S)-IF. All analytes were quantified on the basis of peak area.
2.4. Peak assignment
The identification of the chromatographic peaks corresponding to (R)- and (S)-IF was accomplished using the (R)-IF and (S)-IF standards provided by Prof. G. Blaschke. The chromatographic peaks corresponding to (R)- and (S)-2-DCl-IF and (R)- and (S)-3-DCl-IF were identified by injection of metabolite preparations generated from rat liver microsome incubations with (R)-IF or (S)-IF. The incubations were carried out using Sprague-Dawley male rat liver microsomes (pooled from rats approximately 8 weeks of age, 20 mg protein/mL) purchased from Xenotech, LLC (Leneka, KS,USA) following a previously described protocol [11]. In brief, the incubations were performed in 1.0 ml total incubation volume containing 610 μl potassium phosphate buffer (100 mM, pH 7.4), 60 μl EDTA (1mM), 30 μl MgCl2 (3mM), 50 μl microsomes (0.5 mg/ml protein), 200 μl NADPH (40 mg/ml), and (S)-IF or (R)-IF (200 μM). Incubation mixtures minus NADPH were preincubated for 3 min at 37 °C and then initiated by addition of NADPH. Reactions were carried out in a 37 °C water bath. Following 180 min of incubation, 890 μl of ammonium acetate buffer [10 mM, pH 8.22] was added and the samples were extracted by solid phase extraction as described in section 2.5. A 10 μl aliquot of the resulting extract from each incubation was injected onto the chromatographic system and the order of elution of (R)-2-DCl-IF and (S)-3-DCl-IF was obtained from the (R)-IF incubation and (S)-2-DCl-IF and (R)-3-DCl-IF from the (S)-IF incubation. The obtained biotransformation compounds were analyzed under the same chromatographic conditions described at section 2.3.
2.5. Standard solutions
A stock solution of (R,S)-IF (1000 μg/ml) was prepared in methanol and aliquots were diluted with methanol to produce eight working solutions at the following concentrations for each enantiomer: 48.00; 24.00; 12.00; 6.00; 3.00; 1.50, 0.750 and 0.375 μg/ml. Quality control solutions were prepared in a similar fashion at concentrations of 0.90, 20.00, and 45.00 μg/ml. Stock, working solutions and quality control solutions were prepared fresh weekly.
Plasma calibration standards and plasma quality controls were prepared on the day of analysis by spiking the appropriate working standard solution into 100 μl of plasma, or 2-propanol:methanol (60:40 v/v); the latter was used for the determination of extraction efficiency.
2.6. Plasma Sample Preparation
After thawing, plasma samples were centrifuged at 15000 × g at 4.0°C for 20 min. Aliquots of 100 μl of plasma were transferred to different glass tubes and 10 μl of appropriate working standard solution and 890 μl of ammonium acetate buffer [10 mM, pH 8.22] were added to each tube. The resulting solutions were vortex-mixed for 10 s and transferred to preconditioned 1 ml SPE cartridges. The cartridges were conditioned by eluting two times with 1 ml of methanol, followed by 1 ml water and then 1 ml of ammonium acetate buffer [10 mM, pH 8.22]. After addition of the total plasma sample (1 ml), the cartridges were washed with 1 ml of water followed by 1 ml of water:methanol (95:5 v/v). The retained compounds were eluted with 1 ml of methanol. The methanol was evaporated to dryness in a Speed Vac (Thermo Savant, NY) for 10 min at 30°C and the resulting dry residue was dissolved in 100 μl of 2-propanol:methanol (60:40 v/v), vortex-mixed for 10 sec, transferred into amber vials and 10 μl of the extracted plasma was injected into the HPLC system for analysis.
2.7. Method Validation for (R)-IF and (S)-IF
Linearity was determined using calibration standards prepared as described in Section 2.5. Eight plasma calibration standards (4.800; 2.400; 1.200; 0.600; 0.300; 0.150, 0.075 and 0.0375 μg/ml) were prepared in triplicate using drug-free plasma. Calibration curves were prepared daily prior to each batch analysis. Quality controls and diluted quality controls were randomly included in all analysis to validate each sample run. The calibration curves were obtained by polynomial linear regression analysis of the peak area of IF versus the nominal concentration of each IF enantiomer. Calibration curves were used to calculate the concentrations of (R)- and (S)-IF in the quality control and human samples according to peak area. For selectivity purposes, analysis of drug-free plasma was included in all analytical runs.
The extraction efficiency of IF from spiked plasma was determined by analyzing quality control samples at three different concentrations: 0.09; 2.00, and 4.50 μg/ml. The peak area of five replicates of each extracted quality control was compared with the area of five replicate injections of quality controls in 2-propanol:methanol (60:40 v/v) at the same concentrations to derive a percent extraction.
The precision and accuracy of the method was evaluated by replicate analysis of the three quality control samples (0.09; 2.00, and 4.50 μg/ml). Calibration standards and quality controls samples in plasma were prepared five times for each concentration on the same day to determine intra-day accuracy and precision. Precision was estimated from the coefficients of variation (C.V. %) and the accuracy was evaluated by back-calculation and expressed as the percent deviation between amount found and amount added at the three concentrations examined.
The acceptance criteria for the limits of quantification were defined as the precision and accuracy for three extracted samples must be ≤ 20%. The limit of detection was determined by the lowest concentration of analyte which resulted in a signal-to-noise ratio of three.
The stability of IF in plasma was assessed by analyzing three aliquots of the quality control samples following storage in different conditions. The stability of IF in plasma was evaluated under the following conditions: (a) room temperature for 4 h (bench-top stability) and 35 h after solid-phase extraction (autosampler stability) and (b) after storage at −80°C and exposure to three freeze-thaw cycles. Variation of less than 15% in the concentration of the samples was the criteria for the stability evaluation.
2.8. Application of the method
The validated method was applied to the quantification of (R)-IF, (S)-IF and the determination of the relative concentrations of their corresponding N-dechloroethylated metabolites in human plasma obtained from cancer patients who had received 3.75g/m2/d dose of (R,S)-IF administered as a 96-h continuous infusion. The samples were analyzed as part of the protocol “The relationship of cytochrome P450 3A4 and cytochrome P450 2B6 to the therapeutic index of high-dose intravenous ifosfamide” (NIA Protocol # 2003-117). After obtaining informed consent, venous blood samples (7 ml) were collected using heparinized vacutainer tubes at 0 (predose) and 3, 6, 12, 18, 24, 30, 36, 48, 72 and 96 h during the infusion and 0, 2, 4, 6, 12, 18 and 24 h post-infusion.
3. Results and Discussion
3.1. Optimization of the chromatographic conditions
The initial studies of the LC-MS enantioselective separations of IF, 2-DCl-IF and 3-DCl-IF on the Chirabiotic T CSP utilized a mobile phase composed of ammonium acetate [10 mM, pH 7.0] modified with 2-propanol using a gradient of 2-propanol from 5% to 18% [28]. Under these conditions, IF and 2-DCl-IF were enantioselectively resolved with enatioselectivity factors (α) of 1.1 for each compound, while 3-DCl-IF was not resolved. In this study, the initial mobile phase was ammonium acetate [10 mM, pH 7.0]: 2-propanol (90:10, v/v) delivered in an isocratic mode and the chromatographic results were the same as the previous study (data not presented).
The effect on the enantioselective separations produced by systematically changing the reversed phase conditions was investigated. In these studies, the flow rate was altered, 1.0, 0.5 and 0.2 ml/min, the ammonium acetate buffer was replaced by 0.01% formic acid, and the organic modifier was changed to acetonitrile or methanol. None of these approaches improved the observed α values for IF and 2-DCl-IF or produced an enantioselective resolution of 3-DCl-IF (data not presented).
Since IF-related CNS toxicity has been associated with increased production of (R)-3-DCl-IF [9,16], the enantioselective resolution of (R,S)-3-DCl-IF was one of the key acceptance criteria for the bioanalytical assay. One of the advantages of the Chirabiotic T CSP is that it has been shown to achieve enantioselective separations in reversed phase, normal phase and polar organic modes [29]. Because of the hydrophilic nature of the analytes and the desire to have a mobile phase that was compatible with mass spectrometric detection, the polar organic mode was investigated and the effects on retention and enantioselectivity of phases composed of methanol, ethanol, 2-propanol and acetonitrile were examined, Table 1.
Table 1.
Chromatographic results obtained on the Chirabiotic T column for the enantioselective separation of (R,S)-IF, (R,S)-2-DCl-IF and (R,S)-3-DCl-IF; where: k2 = the retention of the second eluting enantiomer, α = the enantioselectivity, Rs = enantiomeric resolution, MeOH = methanol, IPA = 2-propanol, EtOH = ethanol, ACN = acetonitrile. See text for chromatographic conditions.
| Mobile Phase | Ifosfamide | 2-DCl-IF | 3-DCl-IF | ||||||
|---|---|---|---|---|---|---|---|---|---|
| k2 | α | Rs | k2 | α | Rs | k2 | α | Rs | |
| MeOH | 2.2 | 1.3 | 1.5 | 4.0 | 1.3 | 2.2 | 5.2 | 1.2 | 1.8 |
| IPA | 10.3 | 1.9 | 1.9 | 26 | 1.6 | 4.4 | 40 | 1.4 | 2.4 |
| ACN | 4.1 | 1.0 | - | 1.5 | 1.0 | - | 1.5 | 1.0 | - |
| ACN:IPA (30:70) |
1.7 | 1.1 | 0.73 | 2.8 | 1.0 | 0.70 | 3.5 | 1.1 | 0.90 |
| MeOH:IPA (35:65) |
2.3 | 1.2 | 1.6 | 3.7 | 1.2 | 2.6 | 5.1 | 1.2 | 1.9 |
| MeOH:IPA (40:60) |
2.0 | 1.2 | 1.8 | 3.6 | 1.2 | 2.6 | 4.6 | 1.2 | 1.9 |
| EtOH:IPA (50:50) |
3.9 | 1.5 | 1.9 | 8.0 | 1.4 | 1.8 | 11.1 | 1.3 | 1.7 |
| EtOH:IPA (40:60) |
4.2 | 1.5 | 2.2 | 6.1 | 1.4 | 1.8 | 12.9 | 1.3 | 2.0 |
| EtOH:IPA (70:30) |
2.9 | 1.3 | 1.9 | 5.7 | 1.3 | 1.9 | 7.7 | 1.2 | 1.8 |
When the mobile phase was composed of methanol or 2-propanol, baseline enantioselective resolutions of IF, 2-DCl-IF and 3-DCl-IF were achieved, with higher α values, resolution factors (RS) and retention (k) observed with 2-propanol, Table 1. When acetonitrile was used as the mobile phase, the target analytes were not enantioselectively resolved and the k for IF increased relative to the alcohols while the k's for the dechloroethylated metabolites decreased, Table 1.
With IF, the significant increase in k produced by changing the mobile phase from methanol to 2-propanol is consistent with the decreased polarity of 2-propanol relative to methanol. However, when the mobile phase was changed to acetonitrile, the retention also increased relative to both methanol and 2-propanol, even though the polarity index of acetonitrile is greater than that of methanol, 5.8 versus 5.1 [30].
As with the retention, the observed enantioselectivity, α and RS, of IF increased by 46% and 27%, respectively when the mobile phase was changed from methanol to 2-propanol, Table 1. However, when the mobile phase was composed of acetonitrile, the observed enantioselectivity was lost, even though the retention increased by 86% relative to methanol.
Mixtures of polar organic modifiers, designated as polar organic mode, were also evaluated in order to shorten analysis times while maintaining enantioselective separation of all compounds. Since the mobile phase containing 2-propanol provided the best enantioselectivity (α) and enantiomeric resolution (Rs), Table 1, this solvent was chosen as the primary mobile phase component. For IF, the addition of methanol or ethanol to the mobile phase resulted in significant reductions in k ranging from 81% {40% methanol} to 59% {40% ethanol} with smaller losses in α, 37% {40% methanol} and 21% {40% ethanol}, and no significant changes in Rs, Table 1. Similar effects were observed with 2-DCl-IF and 3-DCl-IF except for the Rs values for 2-DCl-IF which were significantly reduced, although baseline separations were still achieved, Table 1. The addition of 30% acetonitrile to the mobile phase significantly reduced k, α and Rs for IF, 2-DCl-IF and 3-DCl-IF, Table 1 and, no further experiments were carried out using this modifier.
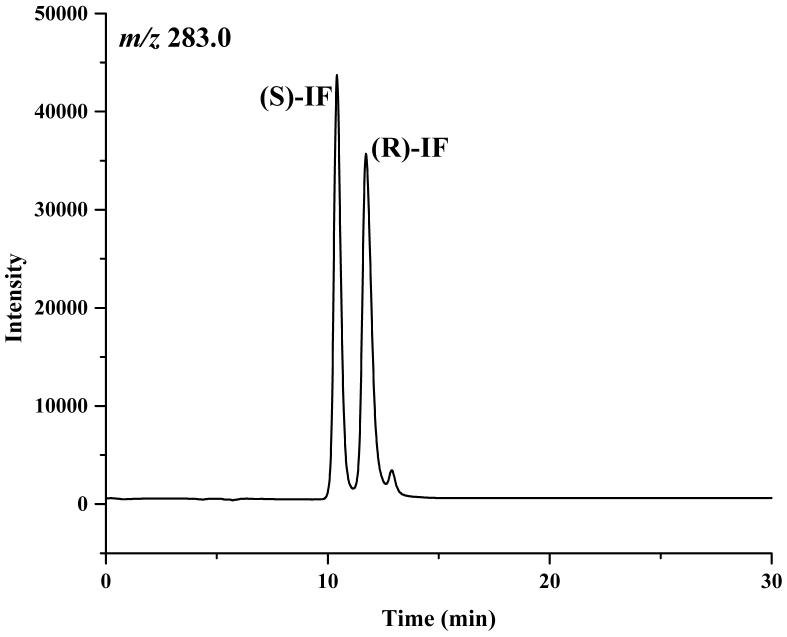
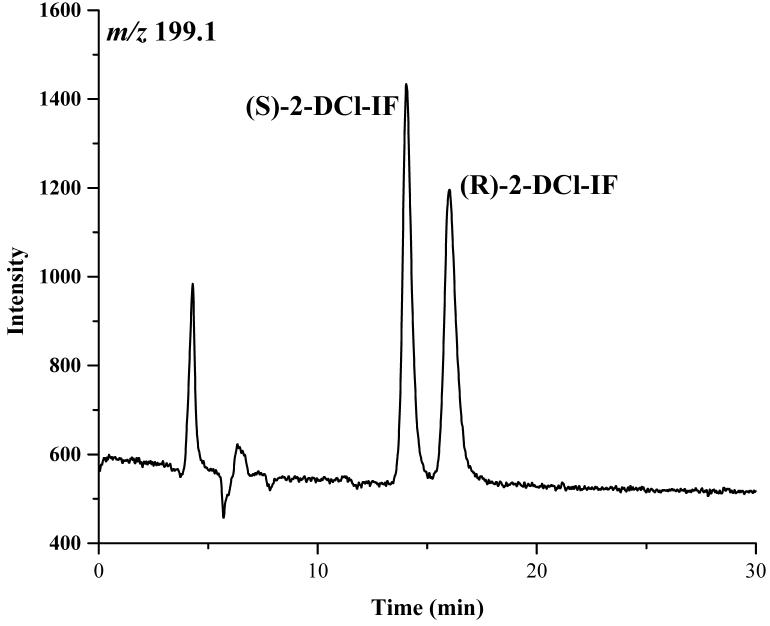
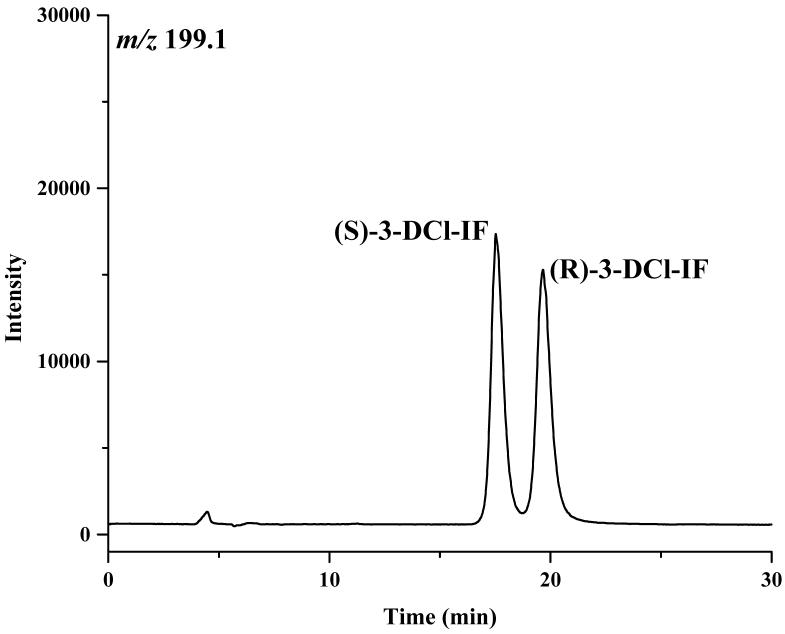
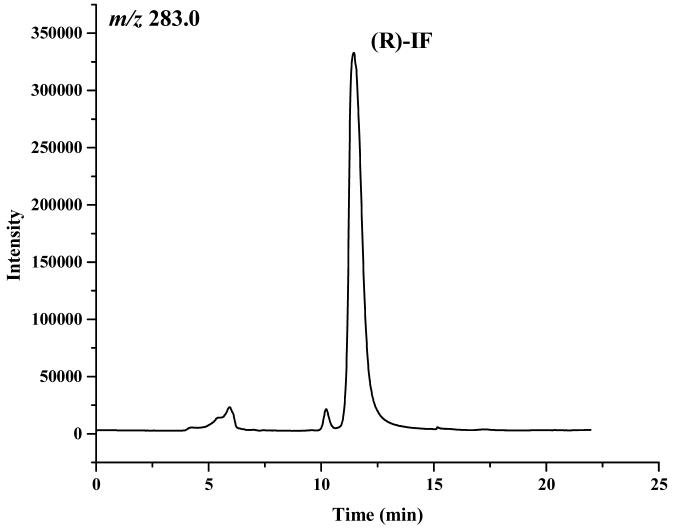
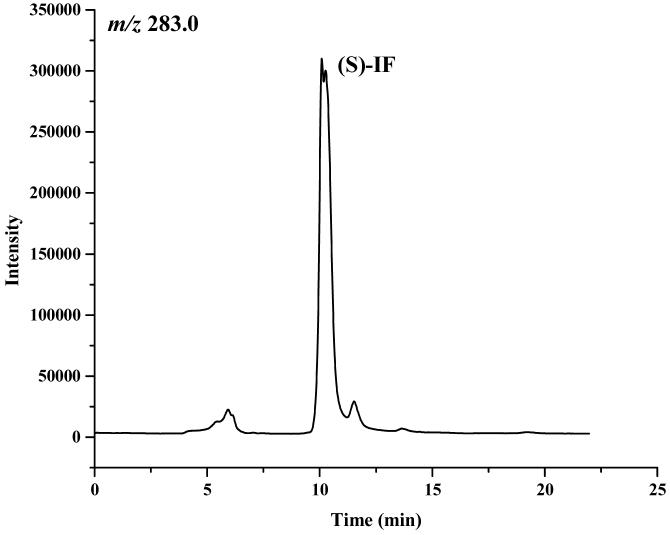
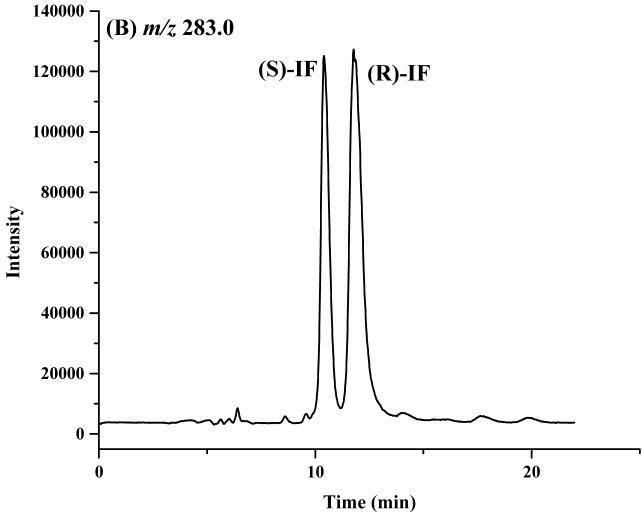
Based on these results, a mobile phase containing 2-propanol:methanol (60:40, v/v) was selected for use in the study. Under these conditions, the retention times of the enantiomers of IF were 10.4 and 11.9 min, of 2-DCE-IF, 14.2 and 16.3 min, and of 3-DCE-IF, 18.0 and 20.3 min, Figure 2.
Figure 2.
The chromatograms of ifosfamide (IF) (A), 2-N-dechloroethyl-IF (2-DCl-IF) (B) and 3-N-dechloroethyl-IF (3-DCl-IF) (C) on the Chirabiotic T CSP using mobile phase composed of IPA:methanol (60:40, v/v). where: IPA = 2-propanol.
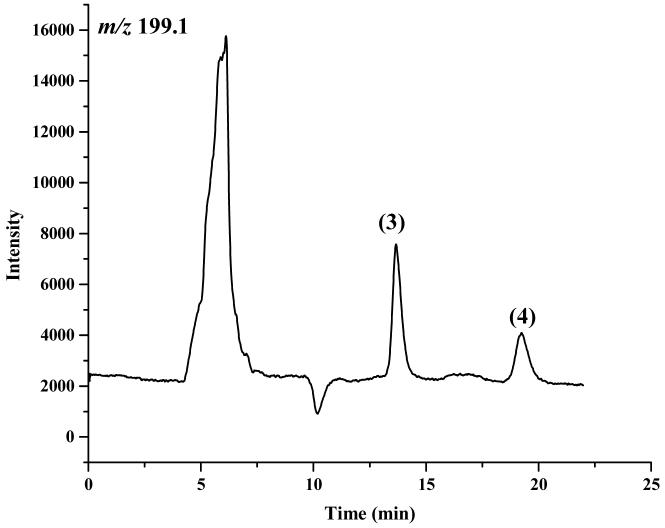
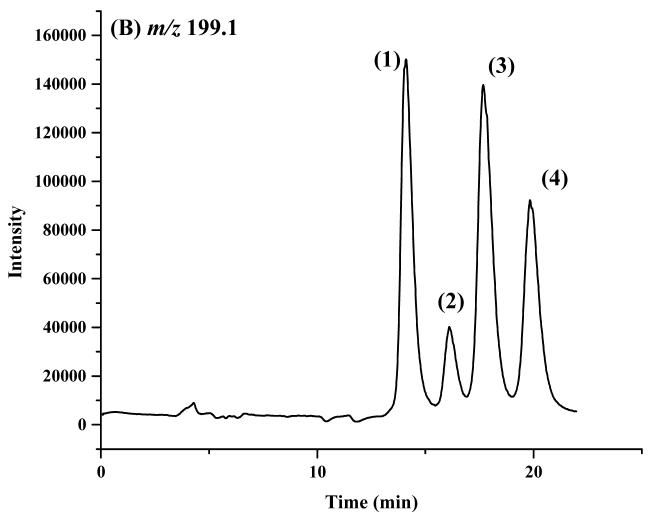
The enantiomeric elution order for IF [(S)-IF elutes before (R)-IF] was established using known standards. The elution orders of 2-DCl-IF and 3-DCl-IF were also established using known standards, however, these standards were racemic and we were therefore unable to determine the enantiomeric elution order. In order to establish the enantiomeric elution orders, (R,S)-IF was enantioselectively resolved and the two enantiomers were obtained with >93% enantiomeric purity, Figure 3. The separate enantiomers were then incubated with rat liver microsomes using previously described conditions known to generate 2-DCl-IF and 3-DCl-IF [11]. Using this approach, it was established, by means of retention time, that (S)-2-DCl-IF (peak 3, Figure 3B) eluted before (R)-2-DCl-IF (peak 1, Figure 3A) and that (S)-3-DCl-IF (peak 2, Figure 3A) eluted before (R)-3-DCl-IF (peak 4, Figure 3B). Because of a change in the priorities around the chiral phosphorus atom, (R)-IF is the source of (S)-3-DCl-IF and (S)-IF is the source of (R)-3-DCl-IF, see Figure 1. Thus, in reference to the three-dimensional configuration of the phosphoramide moiety, the elution order of the 3-DCl-IF enantiomers was reversed. As discussed above, the chiral recognition mechanism responsible for this observation will be discussed elsewhere.
Figure 3.
The chromatograms obtained after the microsomal metabolism of: A. (R)-IF, where: 1 = (R)-2-DCl-IF, 2 = (S)-3-DCl-IF and B. (S)-IF where: 3 = (S)-2-DClIF, 4 = (R)-3-DCl-IF. The reaction mixtures were analyzed using the Chirabiotic T CSP using mobile phases 2-propanol:methanol (60:40 v/v) at a flow rate of 0.5 ml/min and mass spectrometric detection at m/z 283.0 (IF) and m/z 199.1 (2-DCl-IF, 3-DCl-IF).
3.2. Optimization of the mass spectrometry detection
Parameters such as fragmentor voltage, drying gas temperature, nebulizer pressure and capillary voltage were optimized to obtain the highest intensity for the protonated molecule. The optimization was carried out using flow injection analysis of the compounds of interest and concomitant changes of parameters. The optimal responses were obtained at fragmentor: 70V; drying gas flow rate: 10.0 L/min; nebulizer pressure: 35 psig; drying gas temperature: 350 °C and capillary voltage: 3000 V.
3.3. Matrix effects and sample preparation
In parallel to method development, the matrix effect was also evaluated to guide development of the sample preparation method. The effects of sample preparation methods on the electrospray ionization response for (R,S)-IF, (R)-IF, (S)-IF and the 2-DCl-IF and 3-DCl-IF metabolites were evaluated using a post-column infusion system. Four different sample pre-treatments were investigated: methyl-t-butyl ether (MTBE) liquid-liquid extraction, acetonitrile protein precipitation, mixed-mode and reverse mode solid phase extraction. The four sample preparation methods were used to test a pool of human plasma as matrix.
Large differences in matrix effect were observed between sample preparation techniques (data not presented). All four sample treatments resulted in some suppression of ESI response. In general, acetonitrile protein precipitation showed the greatest degree of ionization suppression; this was expected because of the minimum clean up of the plasma samples by this method. Further results suggested that solid phase extraction eliminated matrix interferences more effectively from biological samples and would therefore provide a more robust assay than liquid-liquid extraction or protein precipitation.
It is important to note that for quantification of IF in SIM mode, m/z 261.1 [M+H] was initially selected. However, because of the presence of a co-eluting endogenous interference which could not eliminated by sample preparation, it was necessary to monitor m/z 283.0 [M+Na] in order to achieve accurate IF peak integration.
3.4. Method Validation, IF
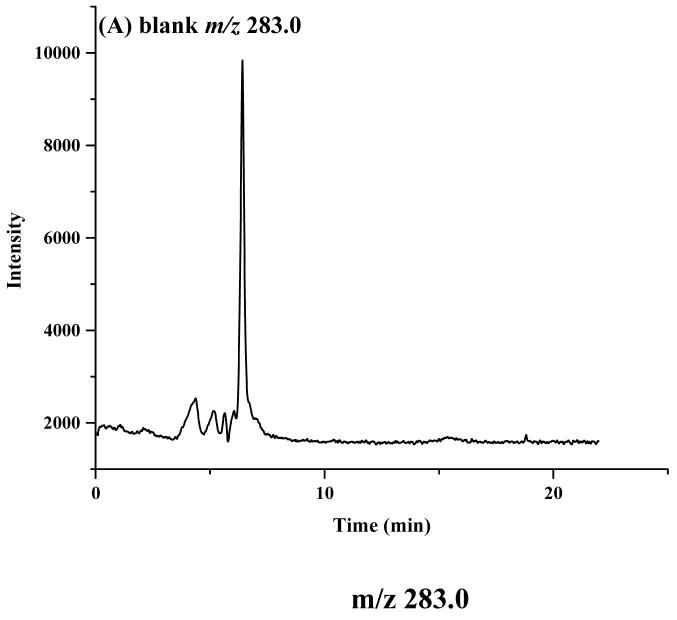
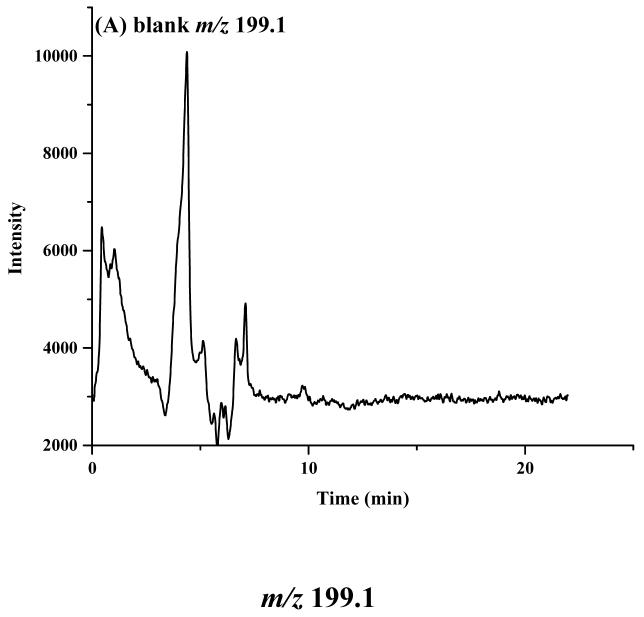
Selectivity of the LC-MS method was determined by the absence of any endogenous interference at the retention times of the peaks in plasma from a pre-dose patient compared to a patient plasma sample obtained 6 h post-infusion of (R,S)-IF, Figure 4.
Figure 4.
Chromatograms of plasma samples obtained from a patient where: A. pre-dose; B. 6 h after the end of a 96-h infusion of 3.75g/m2/d (R,S)-IF. The observed peaks correspond to concentrations of: (S)-IF = 3.66 μg/ml; (R)-IF = 6.29 μg/ml; (S)-2-DCl-IF = 3.64 μg/ml; (R)-2-DCl-IF = 0.887 μg/ml; (S)-3-DCl-IF = 3.70 μg/ml and (R)-3-DCl-IF = 2.27 μg/ml. where: (1) = (S)-2-DCl-IF; (2) = (R)-2-DCL-IF; (3) = (S)-3-DClIF; (4) = (R)-3-DCl-IF.
A suitable internal standard was not available for the quantification of IF and its metabolites. However, as the method was developed using solid phase extraction for sample treatment, which requires minimal of sample manipulation, the use of internal standard was not required. Therefore, calibration curves were generated by polynomial linear regression analysis of the calculated areas of the peaks corresponding to (R)-IF and (S)-IF versus the nominal concentration of the respective enantiomers. The calibration curves were linear from 37.5 ng/ml to 4800 ng/ml for each IF enantiomer with correlation coefficients greater than 0.997. Sufficient quantities of the 2- and 3-N-decholorethyl metabolities were not available and calibration curves could not be established for these analytes. Therefore, the concentrations of these compounds were estimated using the standard curves constructed for (R)- and (S)-IF.
Inter- and intraday precision and accuracy were established at three quality control samples (high, medium and low concentrations) prepared in five replicates and analyzed on three nonconsecutive days. The precision was expressed as coefficient of variation (CV%) and the accuracy was evaluated by back-calculation and expressed as the percent deviation between amount found and amount added at the three concentrations examined. All precision and accuracy results led to satisfactory intra- and interday precision, with coefficient of variation ≤ 16.3%. These results obtained are presented on Table 2.
Table 2.
Accuracy, intra- and inter-day variability and recovery for the assay of (S)-IF and (R)-IF in human plasma
| Enantiomers | Conc. (ng/mL) |
1st daya | 2nd daya | 3rd daya | Pooledb | Recoverya(%) | ||||
|---|---|---|---|---|---|---|---|---|---|---|
| Accuracy (%) |
CV (%) |
Accuracy (%) |
CV (%) |
Accuracy (%) |
CV (%) |
Accuracy (%) |
CV (%) |
(mean ± S.D.) |
||
| 0.090 | 95.9 | 6.23 | 85.0 | 9.83 | 91.3 | 19.0 | 92.1 | 15.0 | 89.6 | |
| (S)-IF | 2.00 | 108 | 5.97 | 105 | 10.3 | 84.7 | 7.38 | 100 | 13.8 | 89.2 |
| 4.50 | 90.1 | 10.4 | 119 | 8.84 | 98.3 | 3.92 | 96.1 | 11.8 | 96.1 | |
| 0.090 | 95.9 | 3.63 | 83.3 | 15.8 | 90.9 | 16.3 | 91.1 | 16.3 | 92.2 | |
| (R)-IF | 2.00 | 88.1 | 4.37 | 100 | 12.2 | 84.3 | 15.7 | 92.3 | 16.1 | 92.0 |
| 4.50 | 113 | 9.11 | 114 | 13.7 | 85.2 | 9.57 | 103 | 14.8 | 99.6 | |
n = 5
n = 30
The recovery was determined at the same three quality control concentration levels. The results were calculated based on comparison to aqueous (R,S)-IF solutions at corresponding concentrations. The calculated recoveries were >89% at the three concentrations studied, Table 2. For each enantiomer, the limit of quantification (LOQ) was 37.5 ng/ml and the limit of detection (LOD) was 5 ng/mL.
Short term storage (bench-top), freeze-thaw stability (3 cycles) and autosampler stability were evaluated. Analytical standard solutions were stable for 15 days when stored at −80°C. For short-term storage (bench-top) the samples were prepared and kept at room temperature for 4 h before analysis and all were stable. Autosampler stability was also determined and all samples were stable over the 35 h period evaluated. The stability of (R,S)-IF in spiked-plasma samples during three freeze-thaw cycles was evaluated and (R,S)-IF was only stable for one cycle.
3.5. Application of the method
The validated method was used to analyze plasma samples obtained from a clinical study investigating the therapeutic and toxic effects of high dose (R,S)-IF. Representative chromatograms from a patient before initiation of therapy and 6 h after the end of a 96 h continuous infusion of 3.75 g/m2/d (R,S)-IF are presented in Figure 4.
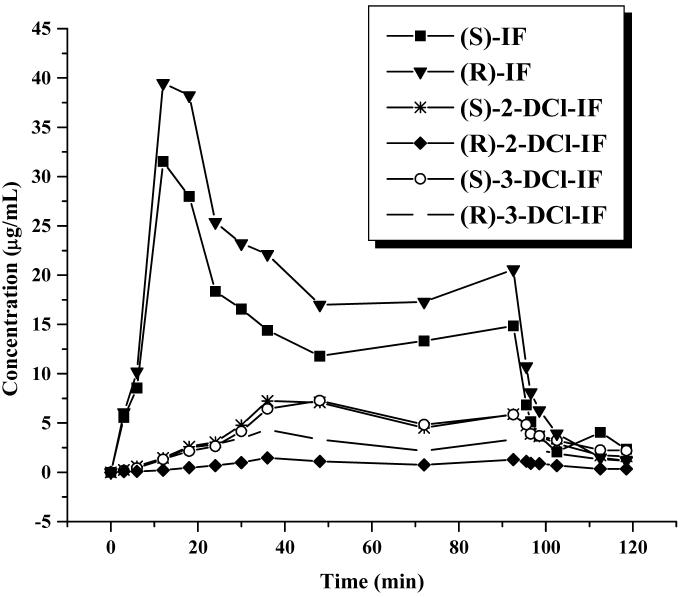
Previous clinical studies have demonstrated that the key indicator of CNS toxicity is the relative concentrations of the DCl metabolites [9,16], and, therefore, the method was also used to probe these concentrations in the clinical samples. The plasma concentration – time profiles for (R)-IF, (S)-IF and the corresponding 2- and 3-DCl metabolites are presented in Figure 5. The data is consistent with previously reported results, c.f. [20].
Figure 5.
Plasma concentration-time curve of IF, 2-DCl-IF and 3-DCl-IF determined in a patient who had received a 96-h infusion of 3.75g/m2/d (R,S)-IF and who was sampled for an additional 24-h post-infusion period.
4. Conclusions
The present work reports the development, validation and application of an enantioselective LC/MS method for the simultaneous quantification of (R)-IF, (S)-IF and the estimation of the relative concentrations of their corresponding 2-DCl-IF and 3-DCl-IF metabolites. This method is sensitive and selective and has been used to analyze plasma samples from an on-going clinical trial. The results of this trial will be reported elsewhere.
5- Acknowledgements
This research was supported in part by the intramural research program of the NIH, National Institute on Aging (IWW) and by a grant (RR00046) from the General Clinical research Centers program of the Division of Research, Resources and National Institutes of Health and The University of North Carolina Lineberger Comprehensive Cancer Center 2003 Translational Research Grant (CL)
Footnotes
Publisher's Disclaimer: This is a PDF file of an unedited manuscript that has been accepted for publication. As a service to our customers we are providing this early version of the manuscript. The manuscript will undergo copyediting, typesetting, and review of the resulting proof before it is published in its final citable form. Please note that during the production process errors may be discovered which could affect the content, and all legal disclaimers that apply to the journal pertain.
6-References
- 1.Zhang J, Tian Q, Yung Chan S, Chuen Li S, Zhou S, Duan W, Zhu YZ. Drug Metab Rev. 2005;37:611–703. doi: 10.1080/03602530500364023. [DOI] [PubMed] [Google Scholar]
- 2.von Schweinitz D, Byrd DJ, Hecker H, Weinel P, Bode U, Burger D, Erttmann R, Harms D, Mildenberger H. Eur J Cancer. 1997;33:1243–1249. doi: 10.1016/s0959-8049(97)00095-6. [DOI] [PubMed] [Google Scholar]
- 3.Lehnhardt M, Muehlberger T, Kuhnen C, Brett D, Steinau HU, Jafari HJ, Steinstraesser L, Muller O, Homann HH. World J Surg Oncol. 2005;3:1–12. doi: 10.1186/1477-7819-3-20. [DOI] [PMC free article] [PubMed] [Google Scholar]
- 4.Fuchs J, Bode U, von Schweinitz D, Weinel P, Erttmann R, Harms D, Mildenberger H. Klin Padiatr. 1999;211:305–309. doi: 10.1055/s-2008-1043805. [DOI] [PubMed] [Google Scholar]
- 5.Goren MP, Wright RK, Pratt CB, Pell FE. Lancet. 1986;2:1219–1220. doi: 10.1016/s0140-6736(86)92227-0. [DOI] [PubMed] [Google Scholar]
- 6.Kerbusch T, de Kraker J, Keizer HJ, van Putten JW, Groen HJ, Jansen RL, Schellens JH, Beijnen JH. Clin Pharmacokinet. 2001;40:41–62. doi: 10.2165/00003088-200140010-00004. [DOI] [PubMed] [Google Scholar]
- 7.Lewis LD. Invest New Drugs. 1991;9:305–311. doi: 10.1007/BF00183570. [DOI] [PubMed] [Google Scholar]
- 8.Lind MJ, Roberts HL, Thatcher N, Idle JR. Cancer Chemother Pharmacol. 1990;26:105–111. doi: 10.1007/BF02897254. [DOI] [PubMed] [Google Scholar]
- 9.Wainer IW, Ducharme J, Granvil CP, Trudeau M, Leyland-Jones B. Lancet. 1994;383:982–983. doi: 10.1016/s0140-6736(94)90109-0. [DOI] [PubMed] [Google Scholar]
- 10.Roy P, Tretyakov O, Wright J, Waxman DJ. Drug Metabolism and Disposition. 1999;27:1309–1318. [PubMed] [Google Scholar]
- 11.Granvil CP, Madan A, Sharkawi M, Parkinson A, Wainer IW. Drug Metabolism and Disposition. 1999;27:533–541. [PubMed] [Google Scholar]
- 12.Brade MP, Herdrich K, Varini M. Cancer Treat. Rev. 1985;12:1–47. doi: 10.1016/0305-7372(85)90011-8. [DOI] [PubMed] [Google Scholar]
- 13.Partha R. TO, Wright J, Waxman DJ. Drug Metabolism and Disposition. 1999;27:1309–1318. [PubMed] [Google Scholar]
- 14.Aleska K, Ito S, Koren G. Chirality. 2006;18:398–405. doi: 10.1002/chir.20268. [DOI] [PubMed] [Google Scholar]
- 15.Chen C, Jounaidi Y, Waxman DJ. Drug Metabolism and Disposition. 2005;33:1261–1267. doi: 10.1124/dmd.105.004788. [DOI] [PubMed] [Google Scholar]
- 16.Wainer IW, Ducharme J, Granvil CP. Cancer Chemother Pharmacol. 1996;37:332–336. doi: 10.1007/s002800050393. [DOI] [PubMed] [Google Scholar]
- 17.Granvil CP, Ducharme J, Leyland-Jones B, Trudeau M, Wainer IW. Cancer Chemother Pharmacol. 1996;37:451–456. doi: 10.1007/s002800050411. [DOI] [PubMed] [Google Scholar]
- 18.Blaschke G, Koch U. Archiv Der Pharmazie. 1986;319:1052–1054. [Google Scholar]
- 19.Young CL, Frank H, Stewart CR, Wainer IW. Chirality. 1989;1:235–238. doi: 10.1002/chir.530010309. [DOI] [PubMed] [Google Scholar]
- 20.Granville CP, Gehrcke B, König WA, Wainer IW. J. Chromatogr. B. 1993;622:21–31. doi: 10.1016/0378-4347(93)80245-y. [DOI] [PubMed] [Google Scholar]
- 21.Kaijser GP, Beijnen JH, Bult A, Keizer HJ, Underberg WJM. J. Chromatogr. B. 1997;690:131–138. doi: 10.1016/s0378-4347(96)00376-3. [DOI] [PubMed] [Google Scholar]
- 22.Zolezzi C, Ferrari S, Bacci G, Fasano MC, Sormani G, Pizzoferrato A. Journal of Chemotherapy. 1999;11:69–73. doi: 10.1179/joc.1999.11.1.69. [DOI] [PubMed] [Google Scholar]
- 23.Storme T, Mercier L, Deroussent A, Re M, Martens T, Royer J, Bourget P, Vassal G, Paci A. Journal of Chromatography B. 2005;820:251–259. doi: 10.1016/j.jchromb.2005.03.023. [DOI] [PubMed] [Google Scholar]
- 24.Woodland C, Ito S, Granvil CP, Wainer IW, Klein J, Koren G. Life Sciences. 2000;68:109–117. doi: 10.1016/s0024-3205(00)00915-2. [DOI] [PubMed] [Google Scholar]
- 25.Blaschke G. J. Liq. Chromatogr. 1986;9:341–368. [Google Scholar]
- 26.Masurel D, Wainer IW. J. Chromatogr. 1989;490:133–143. doi: 10.1016/s0378-4347(00)82768-1. [DOI] [PubMed] [Google Scholar]
- 27.Corlett SA, Chrystyn H. J. Chromatogr. B. 1994;654:152–158. doi: 10.1016/0378-4347(93)e0446-w. [DOI] [PubMed] [Google Scholar]
- 28.Rodriguez-Rosas ME, Wainer IW. Clinical Pharmacology & Therapeutics. 2006;79:57–57. [Google Scholar]
- 29.Armstrong DW, Liu Y, Ekborgott KH. Chirality. 1995;7:474–497. [Google Scholar]
- 30.Snyder LR, Kirkland JJ, Glajch JL. Practical HPLC Method Development. second ed. John Wiley & Sons Inc.; New York: 1997. [Google Scholar]


