Abstract
We report herein thin film voltammetry and kinetics of electron transfer for redox proteins in rat liver microsomes for the first time. Films were made layer-by-layer from liver microsomes and polycations on pyrolytic graphite electrodes. Cyclic voltammograms were chemically reversible with a midpoint potential of −0.48 V vs SCE at 0.1 V s−1 in pH 7.0 phosphate buffer. Reduction peak potentials shifted negative at higher scan rates, and oxidation-reduction peak current ratios were ∼1 consistent with non-ideal quasireversible thin film voltammetry. Analysis of oxidation-reduction peak separations gave an average apparent surface electron transfer rate constant of 30 s−1. Absence of significant electrocatalytic reduction of O2 or H2O2 and lack of shift in midpoint potential when CO is added that indicates lack of an iron heme cofactor suggest that peaks can be attributed to oxidoreductases present in the microsomes rather than cytochrome P450 enzymes.
Keywords: liver microsomes; thin film voltammetry; kinetics; cytochrome P450s, oxidoreductases
1. Introduction
Liver microsomes play an extensive role in drug discovery as a source of enzymes for in vitro metabolism and inhibition studies. Cytochrome P450 (CYP) enzymes are the major “Phase I” enzymes in liver microsomes that metabolize lipophilic drugs and pollutant molecules [1-3]. Most CYP enzyme reactions involve oxidation, although other reactions are known [4]. For new drug approval, details about which of the many liver CYPs are involved in metabolism is a requirement in some countries [4]. In the metabolic pathway, the iron heme of CYP accepts an electron from NADPH via NADPH-reductase with electrons flowing from NADPH via reductase prosthetic group flavin adenine dinucleotide (FAD) to flavin mononucleotide (FMN) to the CYP, followed by dioxygen binding and a second electron transfer, resulting in an active oxidant CYP form that subsequently oxidizes bound substrates [1,4].
We recently reported direct electrochemistry of so called Supersomes, or microsomes genetically enriched in CYP1A2 or CYP3A4 [5]. The voltammetric peaks found were attributed to oxidoreductases such as CYP NADPH-reductase, not CYPs. These oxidoreductases include NADPH-cytochrome P450 reductase, the natural electron donor for all microsomal cytochrome CYP-catalyzed oxidations [1,3]. Electrochemical reduction of these oxidoreductases in the supersome films was able to convert styrene to styrene oxide in low yield, presumably via electron transfer to oxidoreductases, and then to the CYPs [5].
We have used pure CYP enzymes in genotoxicity screening sensors and arrays in which DNA damage for enzyme-generated metabolites is monitored [6-9]. Human CYP enzymes are not commercially available in pure form, and their isolation and purification is labor intensive. On the other hand, rat liver microsomes are cheap, commercially available sources of CYPs and other metabolic enzymes. In the place of pure enzymes, microsomes have the potential to eliminate the bottleneck of multiple enzyme purification, and broaden toxicity biosensor array applications with respect to drug discovery and development. In this communication, we describe a first successful step toward such a goal. We report for the first time construction and characterization of stable thin films on electrodes from rat liver microsomes and polyions of opposite charge, and voltammetry and electron transfer kinetics of the oxidoreductases in these films.
2. Experimental
2.1. Chemicals and Materials
Liver microsomes from rat (F344, male) containing cytochrome P450 (CYP) enzymes and oxidoreductases were from BD-Biosciences (Woburn, MA, USA). The activities of enzymes as supplied by the manufacturer are: oxidoreductases 330 nmol.mg−1.min−1, CYP 3A, 2C, 2E1,1A and 4A were 3.3, 5.1, 1.1, 0.18 and 1.2 nmol.mg−1.min−1 respectively against their specific substrates. Total CYP and cyt b5 were given as 590 and 760 pmol/mg respectively. Horse heart myoglobin (Mb, MW 17400), poly (diallyldimethylammonium chloride) (PDDA), poly(sodium 4-styrene sulfonate) (PSS), and hydrogen peroxide were from Sigma. Water was treated with a hydro nanopure system to a specific resistivity ≥ 18 mΩ cm. Amicon YM30 membrane filter (30 000 MW cutoff) was used to filter the Mb solution prepared in 10 mM acetate buffer, pH 4.5 [10]. All other chemicals were reagent grade.
2.2. Instrumentation
A CH instrument 660A electrochemical analyzer was used for cyclic voltammetry (CV). The cell employed a saturated calomel reference electrode (SCE), Pt-wire counter electrode and film-coated working electrode disk (A = 0.2 cm2) of ordinary basal plane pyrolytic graphite (PG, Advanced Ceramics). Ohmic drop was compensated ∼95%. Buffer solutions were purged with purified nitrogen for 20 min. before acquiring voltammograms.
To monitor the layer-by-layer assembly of films, we used a quartz crystal microbalance (QCM, USI Japan) with 9 MHz QCM resonators (AT-cut, International Crystal Mfg.). A partly negative monolayer was made on gold-coated (0.16±0.01 cm2) resonators (9 MHz frequency) with 0.5 mM 3-mercatopropionic acid in ethanol [6]. Layers were adsorbed onto this negatively charged gold resonator surface. The conditions of layer adsorption and duration to form stable PDDA and microsomes assemblies were optimized via a QCM monitoring of film growth. Resonators were dried in a stream of nitrogen before measuring the frequency change (ΔF) for each layer, from which adsorbed mass and nominal thickness were estimated [11].
2.3. Film construction
PDDA/microsome films were constructed on PG electrode by using the layer-by-layer alternate electrostatic assembly [11]. PDDA polycations were chosen to have opposite charge to the microsomes. PG electrodes were abraded with 400 grit SiC paper, then ultrasonicated for 30 s in ethanol followed by 30 s in water, and dried in nitrogen. Films on PG of architecture (PDDA/microsomes)3 and (PSS/Mb)3 were used for CV studies.
Layers of PDDA (1 mg mL−1 in 0.05 M NaCl) and negatively charged microsomes were adsorbed in alternative steps on rough PG surface for 20 and 30 min. respectively at 4 °C. The electrodes were rinsed in water between adsorption steps. Similarly, Mb films as controls were made with three bilayers of PSS (3 mg mL−1 in 0.05 M NaCl) and positively charged Mb (pI 6.9, 3 mg mL−1 acetate buffer, pH 4.5) [12].
3. Results
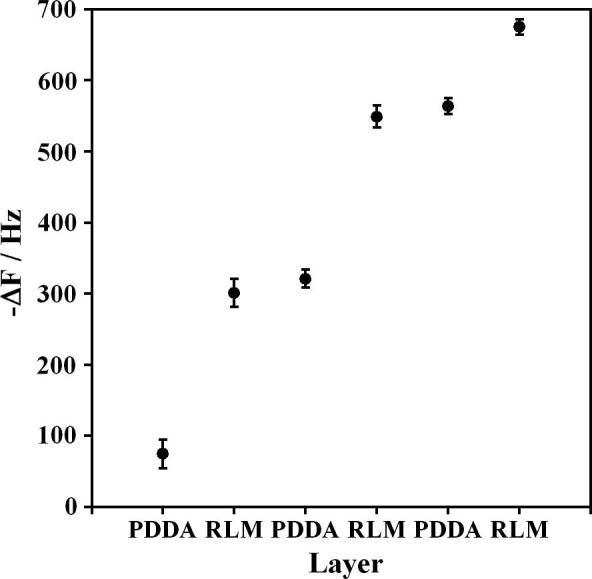
Film growth was monitored by QCM measurements during the assembly of (PDDA/microsome)3 films on gold resonators, and showed a decrease in frequency (−ΔF) for each sequentially adsorbed layer suggesting regular and reproducible film growth (Figure 1). The decreases in frequency for microsomes layers were relatively large, because the microsomes themselves are much larger than PDDA molecules. Using the appropriate equations [11], ΔF values were used to find a nominal film thickness of 10.8 ± 0.2 nm. Microsome content was 3.2 ± 0.1 μg cm−2 and PDDA was 0.5 ± 0.1 μg cm−2. Thicknesses of individual layers were ∼ 3 nm for microsomes and 0.5 nm for PDDA. In experiments to be reported elsewhere, we have shown that these microsome films are catalytically active for substrate oxidation [13].
Figure 1.

. QCM frequency changes for adsorption steps during (PDDA/microsome)3 film growth on gold resonators coated with a monolayer of mercaptopropionic acid as first layer. (Error bars reflect SD for 3 resonators)
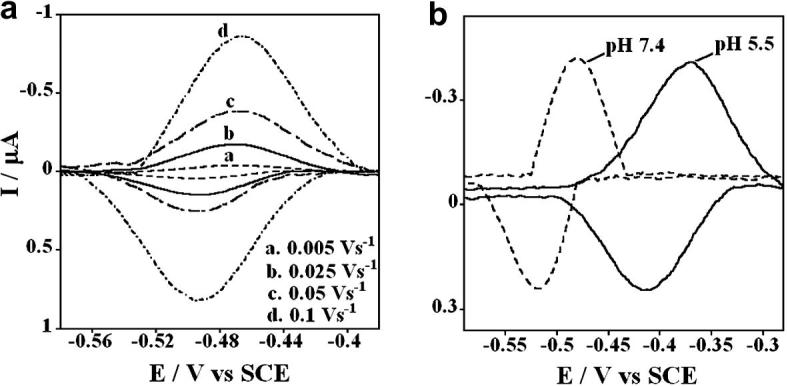
Fig. 2(a) represents cyclic voltammograms (CV) of microsomes in the (PDDA/microsome)3 films with increasing scan rates. A reversible pair of reduction-oxidation peaks with a midpoint potential of −0.48 V vs SCE at 0.1 V s−1 in phosphate buffer, pH 7.0 was observed. Peak current versus scan rate was linear up to 1000 mV s−1. Reduction peak potentials shifted more negative with increasing scan rate and oxidation-reduction peak ratios were ∼1. Peak widths at half height were 70 ± 8 mV, slightly less than the ideal one electron value of 90/n mV. These observations correspond to quasireversible, non-ideal thin protein film voltammetry [14,15], but there is some doubt as to the number of electrons complicated by the fact that the peak may result from a mixture of enzymes. In lieu of definitive information, we assume one-electron reactions. The amount of electroactive protein in the microsomes in film assuming one electron was found from integration of the CVs to be ∼30 pmol cm−2.
Figure 2.

. Background subtracted cyclic voltammograms of (PDDA/microsome)3 films on rough PG electrodes in (a) phosphate buffer (50 mM, pH 7.0) + 0.1 M KCl purged with nitrogen with increasing scan rates; (b) in phosphate buffer (50 mM, pH 7.4)+KCl (0.1 M) or acetate buffer (50mM, pH 5.5)+KCl (0.1 M) purged with nitrogen at a scan rate of 0.1 Vs−1.
Fig. 2(b) shows CVs obtained at two different pH values 7.4 and 5.5 for the PDDA/microsome assembly. A positive shift in peak potential with lowering pH suggests proton coupled electron transfer. The shift in formal potential (E°') per pH unit was 56 mV pH−1, close to the theoretical value of 59 mV pH−1 expected at 25°C for reversible one proton, one electron transfer.
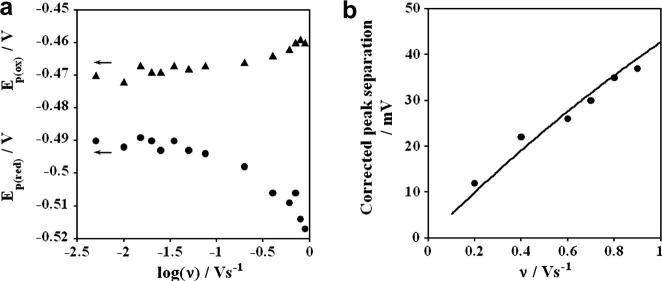
Figure 3(a) shows the oxidation-reduction peak potentials plotted against logarithm of scan rates in V s−1. This so called “trumpet plot” shows a nearly constant peak separation (ΔEp) at lower scan rates, but oxidation and reduction peak potentials changed in opposite directions at higher scan rates with the net effect of increasing the peak separation. The shapes of these plots are associated with quasireversible electron transfer of a surface protein without the influence of chemical complications [14]. The relatively constant peak separations at low scan rates have been observed in thin films of many redox proteins [14], are of non-kinetic origin, and may result from conformational differences between oxidized and reduced forms of the protein [16]. Following the recommendation of Hirst and Armstrong [17], we subtracted the average non-kinetic ΔEp at low scan rate, and assuming one-electron transfer analyzed corrected data with the Butler-Volmer model for surface-confined electron transfer [18]. Resulting fits of theory to experiment were good (Figure 3b) and provided a value of 30 ± 3 s−1 for the average apparent electrochemical surface electron-transfer rate constant ks.
Figure 3.
. (a) Oxidation and reduction peak potentials vs logarithm of scan rate from CVs ofPDDA/microsome films in phosphate buffer (50 mM, pH 7.0)+KCl (0.1 M) purged with nitrogen; (b) Influence of CV scan rates for PDDA/microsomes films on experimental (dots) peak separation (ΔEp) corrected for the scan rate independent contribution at low san rate shown with theoretical lines for the apparent ks = 30±3s−1 and α = 0.5.
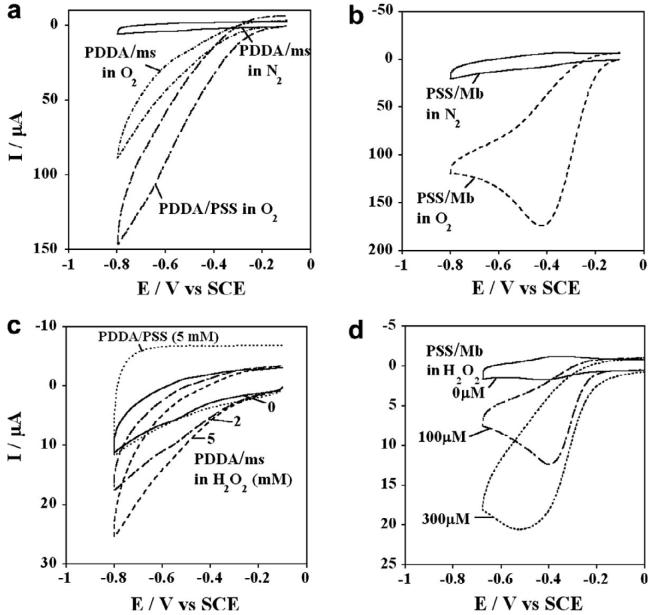
Iron heme proteins like CYPs and Mb in thin films on electrodes can catalytically reduce oxygen and hydrogen peroxide [11,12]. In presence of oxygen, the protein PFeII formed by reduction of PFeIII forms a PFeII-O2 complex. Electrochemical reduction of this complex produces hydrogen peroxide at the PFeIII/PFeII redox potential. This catalytic reduction is detected by cyclic voltammetry as an increase in reduction peak current in the presence of oxygen and the disappearance of the oxidation peak for PFeII. Figure 4(a) shows CVs of PDDA/microsome films in buffer saturated with nitrogen and oxygen. In oxygen atmosphere for PDDA/microsomes and PDDA/PSS films, the CVs increased in reduction current a bit, but the microsome film gave less current than the film with no microsomes. The control PSS/Mb film showed a large increase in reduction peak current and the disappearance of oxidation peak characteristic of heme protein films in oxygen containing solutions (Figure 4b). Figure 4(c) shows the CVs for the PDDA/microsome film with increasing concentration of H2O2 where only small increases in reduction current were observed. While this may suggest catalysis by small amounts of iron heme proteins, in contrast, the PSS/Mb film showed H2O2 concentration dependent catalytic increase in the reduction peak current even in μM peroxide range, typical of heme group properties in Mb (Fig. 4d).
Figure 4.
. Cyclic voltammograms at 0.1 V s−1 for films on rough PG electrodes in phosphate buffer (50 mM, pH 7.4) + 0.1 M KCl showing the influence of 10 min. purging with oxygen for (a) PDDA/microsome films; (b) PSS/Mb films; and showing the influence of H2O2 for (c) PDDA/microsomes and (d) PSS/Mb films.
Upon reduction in the presence of CO, iron heme proteins form FeII-CO complexes that result in a 50-100 mV positive shift of midpoint potentials [8,12]. However, CVs for PDDA/microsome films in buffer purged with CO gas gave no shift in midpoint potential compared to CVs after N2 purging (data not shown).
4. Discussion
Ultrathin films (∼11 nm thick) constructed layer-by-layer from rat-liver microsomes and PDDA were shown above to provide reversible pair of CV peaks with midpoint potential at −0.48 V vs SCE at pH 7 (Figure 2). This is considerably negative of the potential expected for CYP enzymes in similar films (ca. −0.3 V vs SCE) [8,12] but very similar to the peak potential observed for rabbit cyt P450 reductase in polyion films (−0.49 V at pH 7.4), and films of genetically enriched Supersomes containing human monooxygenase systems [5]. PDDA/microsome peaks were not shifted by addition of CO, and they show very little catalytic reduction of oxygen or hydrogen peroxide. In fact, Figure 4 suggests that only direct reduction of oxygen occurs, and that there may be a very small catalytic effect for peroxide, but orders of magnitude lesser than that of the iron heme protein Mb.
All the results observed suggest that the CVs do not involve iron heme enzymes such as CYPs, but can be assigned to oxidoreductases in the microsomes. The oxidoreductases have several orders of magnitude higher activity in the microsomes compared to P450 enzymes (see chemicals and materials). It is possible that the peaks reflect mainly cyt P450 reductases.
In summary, this communication describes stable ultrathin films of rat liver microsomes that gave reversible CVs characteristic of oxidoreductases important in metabolic processes. The fact that oxidoreductases in these films readily accept electrons lends confidence that microsomes might be used to replace pure enzymes for bioactivation of organic compounds and drugs in genotoxicity sensors and arrays. Testing of this hypothesis is currently underway in our laboratory.
Acknowledgements
This work was supported financially by U.S. PHS Grant No. ES03154 from the National Institute of Environmental Health Sciences (NIEHS), NIH, USA. S. K. is grateful to the Electrochemical Society (USA) for the J.W. Richards summer fellowship.
Footnotes
Publisher's Disclaimer: This is a PDF file of an unedited manuscript that has been accepted for publication. As a service to our customers we are providing this early version of the manuscript. The manuscript will undergo copyediting, typesetting, and review of the resulting proof before it is published in its final citable form. Please note that during the production process errors may be discovered which could affect the content, and all legal disclaimers that apply to the journal pertain.
References
- 1.Ortiz de Montellano PR. Cytochrome P450: Structure,mechanism, and biochemistry. 3rd Ed. Plenum; New York: 2005. [Google Scholar]
- 2.Guengerich FP. Drug Dev. Res. 2000;49:4. doi: 10.1002/1098-2299(200004)49:4<253::AID-DDR4>3.0.CO;2-1. [DOI] [PMC free article] [PubMed] [Google Scholar]
- 3.Schenkman JB, Greim H, editors. Cytochrome P450. Springer-Verlag; Berlin: 1993. [Google Scholar]
- 4.Guengerich FP. Chem. Res. Toxicol. 2001;14:611. doi: 10.1021/tx0002583. [DOI] [PubMed] [Google Scholar]
- 5.Sultana N, Schenkman JB, Rusling JF. J. Am. Chem. Soc. 2005;127:13460. doi: 10.1021/ja0538334. [DOI] [PubMed] [Google Scholar]
- 6.Zhou L, Yang J, Estavillo C, Stuart JD, Schenkman JB, Rusling JF. J. Am. Chem. Soc. 2003;125:1431. doi: 10.1021/ja0290274. [DOI] [PubMed] [Google Scholar]
- 7.Wang B, Jansson I, Schenkman JB, Rusling JF. Anal. Chem. 2005;77:1361. doi: 10.1021/ac0485536. [DOI] [PubMed] [Google Scholar]
- 8.Hvastkovs EG, So M, Krishnan S, Bajrami B, Tarun M, Jansson I, Schenkman JB, Rusling JF. Anal. Chem. 2007;79:1897. doi: 10.1021/ac061975q. [DOI] [PMC free article] [PubMed] [Google Scholar]
- 9.Krishnan S, Hvastkovs EG, Bajrami B, Jansson I, Schenkman JB, Rusling JF. Chem. Commun. 2007:1713. doi: 10.1039/b703012f. [DOI] [PubMed] [Google Scholar]
- 10.Nassar A-EF, Willis WS, Rusling JF. Anal. Chem. 1995;67:2386. doi: 10.1021/ac00110a010. [DOI] [PubMed] [Google Scholar]
- 11.Rusling JF. In: Protein Architecture: Interfacing Molecular Assemblies and Immobilization Biotechnology. Lvov Y, Mohwald H, editors. Marcel Dekker; New York: 2000. p. 337. [Google Scholar]
- 12.Munge B, Estavillo C, Schenkman JB, Rusling JF. ChemBioChem. 2003;4:82. doi: 10.1002/cbic.200390018. [DOI] [PubMed] [Google Scholar]
- 13.Krishnan S, Bajrami B, Hvastkovs EG, Schenkman JB, Rusling JF. work in progress.
- 14.Armstrong FA, Heering HA, Hirst J. Chem. Soc. Rev. 1997;26:169. [Google Scholar]
- 15.Rusling JF, Zhang Z. In: Biomolecular Films. Rusling JF, editor. Marcel Dekker; New York: 2003. p. 1. [Google Scholar]
- 16.El Kasmi A, Leopold MC, Galligan R, Robertson RT, Saavedra SS, El Kacemi K, Bowden EF. Electrochem. Commun. 2002;4:177. [Google Scholar]
- 17.Hirst J, Armstrong FA. Anal. Chem. 1998;70:5062. doi: 10.1021/ac980557l. [DOI] [PubMed] [Google Scholar]
- 18.Laviron E. J. Electroanal. Chem. 1979;101:19. [Google Scholar]


