Abstract
Coronary magnetic resonance angiography (MRA) acquired using steady-state free precession (SSFP) sequences tend to suffer from image artifacts caused by local magnetic field inhomogeneities. Flow and gradient switching induced eddy currents are important sources of such phase errors, especially under off-resonant condition. In this study, we propose to reduce these image artifacts by using a linear-centric-encoding (LCE) scheme in the phase-encoding (PE) direction. Abrupt change of the gradients including magnitude as well as polarity between consecutive radio-frequency (RF) cycles is minimized using the LCE scheme. Results from numeric simulations and phantom study demonstrated that signal oscillation can be markedly reduced using LCE as compared to conventional alternating-centric-encoding (ACE) scheme. Image quality of coronary arteries was improved at both 1.5 T and 3.0 T using LCE compared to those acquired with ACE PE scheme (1.5 T: ACE / LCE = 2.2 ± 0.8 / 3.0 ± 0.6, p = 0.02; 3.0 T: ACE / LCE = 2.1 ± 1.1 / 3.0 ± 0.8, p = 0.01). In conclusion, flow and eddy currents induced imaging artifacts in coronary MRA using SSFP sequence can be markedly reduced with LCE acquisition of PE lines.
Keywords: Magnetic Resonance Angiography (MRA), Coronary Arteries, High-field Imaging, SSFP, Flow, Eddy Currents
Introduction
Balanced steady-state free precession (SSFP) sequences (TrueFISP, FIESTA, b-FFE, b-SSFP) have become the major method of choice for magnetic resonance angiography (MRA) of coronary arteries at 1.5 T. Higher signal-to-noise ratio (SNR) and contrast-to-noise ratio (CNR) of coronary images can be achieved compared to conventional gradient-echo sequence (1,2). However, the balanced structure of SSFP sequence makes it sensitive to residual phase from each RF cycle. Besides those well known sources of spin dephasing such as local inhomogeneity of the main field, chemical shift between spectrally different components, and susceptibility induced field variations, eddy current and flow are also important sources of such phase error (3–5).
Eddy current is induced by the electric fields resulting from changing magnetic flux (6). Such current alters local magnetic field which in turn increases dispersion of spins and leads to imaging artifacts (7). The onset of eddy current is related to the dynamic switching of the imaging gradients as well as the electromagnetic properties of the conducting components including the RF coils, RF shield, and the subject being imaged. Complete compensation of such spatially and temporally varying currents using pre-emphasis requires careful characterization and delicate design of the applied gradient. Recent studies have shown that, by improving the order of k-space data acquisition, eddy current induced imaging artifact can be substantially reduced (3,5,8–10).
Coronary MRA data are typically acquired during mid-diastole of each cardiac cycle to minimize cardiac motion related artifacts. The blood flow, however, is at a relatively high velocity at this stage of isovolumic filling (11). Numerous studies have reported the dependence of SSFP signal on flow and frequency offset (12–14). Flow related artifacts manifesting as low or inhomogeneous signal intensity in blood pools can be reduced by careful shimming and dedicated design of the data acquisition scheme (14,15).
To assure sufficient spatial resolution as well as minimal motion artifact, the full k-space for reconstructing a coronary artery image is typically filled by combining segmented data sets acquired from multiple heartbeats. For coronary MRA, centric-encoding order has been widely used in the PE direction for studies using Cartesian sampling scheme. By collecting central k-space lines at the beginning of each readout train, optimal fat saturation as well as minimal respiratory motion artifact (in case of navigator-gated free-breathing imaging although breath-holding was used in this study) can be achieved (16). Typically, data are collected from low to high spatial frequencies in both positive and negative k-space regions in each readout train in an oscillating mode (Figure 1a) (2,17,18). The sign as well as amplitude of PE gradients alternate in consecutive PE lines, accumulating phase errors from eddy current and flow within consecutive RF cycles (see Theory for details). For simplicity, such PE order is referred as alternating-centric-encoding (ACE) in the following text.
Figure 1.
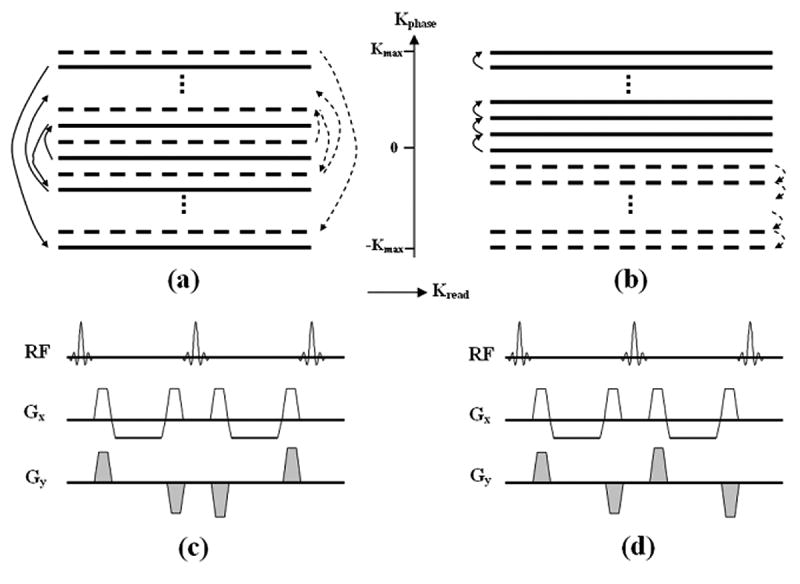
Schematic of the k-space trajectory of the conventional ACE (a) and proposed LCE (b) PE orders. K-space data of one imaging slice is filled by interleaving two segments in this example. The trajectory of ACE scheme moves from central to outer lines in the PE direction and alternates between positive and negative regions in each segment as illustrated by two segments (1st: solid line, 2nd: dashed line) in figure (a). Note the sign as well as the magnitude of the PE gradient (Gy) alternates from one RF cycle to another (Fig.c). Using LCE PE order, the k-space trajectory travels uni-directionally from central to outer lines in each segment as illustrate in (b). The magnitude of Gy is slightly increased from RF cycle to another. Polarity of gradient pairs remains unchanged in the whole readout train as shown in (d).
We propose to use a linear-centric-encoding (LCE) PE order for coronary MRA using Cartesian SSFP sequence. With such acquisition scheme, the k-space trajectory moves uni-directionally from center to outer lines in each segment (Figure 1b). Not only the advantages of ACE order can be preserved by collecting central lines first, more importantly, smooth and minimal changes of the PE gradients between consecutive RF cycles (Figure 1d) can potentially reduce imaging artifacts from flow and eddy currents. Phantom and human studies were performed in this study to validate the efficacy of such encoding scheme at both 1.5 and 3.0 T clinical scanners.
Theory
The net transverse magnetization of spin ensemble is a function of tissue parameters including T1, T2, imaging parameters such as the flip angle, repetition time (TR), as well as the accumulated phase angle ϕ between RF pulses for SSFP sequence. The phase dispersion depends on local magnetic field strength spins have experienced, in which variations originate from static field inhomogeneity, eddy currents induced local magnetic field, and motion of spins (e.g., from flow). The static field inhomogeneity from main field imperfection and susceptibility induced frequency offset results in constant phase offset and can be compensate by careful shimming (19) or applying additional frequency offset (20). Accumulated phase angle within the nth TR of a RF pulse train can be generalized into the following equation:
| [1] |
where the constant γ represents the gyromagnetic ratio, G(t) and r(t) are effective strength of gradient pulses and dynamic position of spins, respectively. Eddy currents generate time varying gradient Geddy(t), while flow leads to alteration of spin position r(t). They both contribute to phase accumulation and the effect will be separately discussed.
Eddy currents induced phase error
The effective gradient G(t) is the summation of applied gradient Gapplied and eddy-current induced time-varying gradient Geddy (6). For static tissues, integration of the applied gradients returns zero in one TR because gradients are balanced in all directions for balanced SSFP sequence. Nevertheless, the net phase from eddy-current induced gradients is not zero. Such current is related to the applied gradients (amplitude, ramp-up time, duration) and electromagnetic property of conductive components. Typically, it is modeled to decay exponentially with multiple time constants on the order of tens to hundreds of milliseconds (21). For a typical trapezoidal gradient pulse as illustrated in Figure 2, induced eddy currents from the ramp-up and ramp-down gradients do not cancel each other due to such exponential decay. Also, net phase accumulated from two identical gradients with reverse polarity do not yield zero result. Eddy currents induced gradient at time t after the onset of a Gapplied can be modeled to be:
Figure 2.
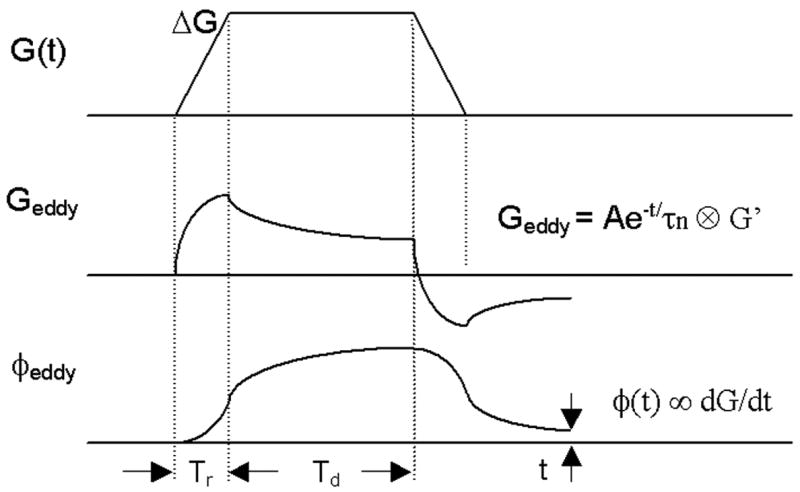
Schematic of a trapezoidal gradient G(t), gradient induced eddy current Geddy, and accumulated phase φeddy from eddy current in a typical Cartesian SSFP sequence. Eddy currents decay exponentially with multiple time constant τn, thus gradient-switching induced currents from ramp-up and ramp-down gradients do not cancel each other. The accumulated phase is proportional to the amplitude of the trapezoidal gradient ΔG with fixed ramping time Tr and duration Td, as shown in Equation 3.
| [2] |
where τn represents the nth exponentially decaying constant, k is the number of exponential time constants for modeling the decay of eddy current, A is a constant related to the permeability, conductivity, and coupling between various conductive loops. For trapezoidal gradient as shown in Figure 2,
| [3] |
In this equation, Tr and ΔG are the ramping time and amplitude of the applied gradient, respectively. Td is the duration of the flat top of the gradient. For a typical SSFP sequence with fixed repetition time (TR), Tr and Td remain constant from one RF cycle to another. By plugging equation 3 into equation 1:
| [4] |
where ϕnTR,eddy represents the accumulated phase error from eddy currents in the time interval between nTR and (n+1)TR. Equation 4 shows that the net phase from eddy currents is not vanished and the phase angle is directly proportional to ΔG/Tr. In the readout and partition-encoding directions (in 2D case or the same slice in 3D), gradients were constantly applied, yielding equal phase error in continuous RF cycles. Phase-encoding (PE) gradient induced phase error, in contrast, is a linear function of the PE line number which is encoded by gradient ΔG in the PE direction.
Constant flow induced phase error
The position coordinates r(t) of a moving spin at time point t within one TR (nTR < t < (n+1)TR) can be expressed by Taylor series (22):
| [5] |
where rn, vn, and an denote position, velocity, and acceleration of the spin at time point t = nTR. Ignoring acceleration and higher order motions,
| [6] |
where ϕnTR,flow represents the accumulated phase error induced by constant flow from nTR to (n+1)TR. The gradient is zeroth- and first-order flow compensated in the readout and slice selection directions for SSFP sequence (14,22). In the phase-encoding direction, however, only the zeroth-order moment is vanished after integration (equation 1) with two identical PE gradients played in opposite polarity. The first-order moment from constant flow is a linear function of the applied PE gradient. Phase error in each RF cycle from constant flow again becomes a linear function of the applied PE gradient ΔG.
PE order and signal stability
So far, we have approximated that phase angle accumulated in each RF cycle is a linear function of the applied gradients. Thus variation of such phase angle is dependent on the k-space trajectory of imaging sequence. Assuming 124 PE lines for each image are collected in four heartbeats, the maximal phase errors will be 62Δφ and −61Δφ for the outmost k-space lines in the positive and negative directions, respectively, where PE gradients are the strongest. Conventional linear-encoding scheme has small and consistent difference in PE gradients of any two adjacent RF cycles, resulting in linearly increasing phase error in consecutive RF cycles (e.g., −61Δφ, −57Δφ, −53Δφ, …, 51Δφ, 55Δφ, 59Δφ in one segment). In contrast, ACE induces phase error with increasing magnitude and oscillating polarity from one RF cycle to another (e.g., Δφ, 5Δφ, −3Δφ, 9Δφ, −7Δφ, …, −55Δφ, 61Δφ, −59Δφ in one segment), resulting from opposite polarity of gradient pairs jumping from one side of k-space (e.g., negative k-space) to another side (e.g., positive k-space) as indicated in Fig. 1(a) and (c). This can potentially lead to signal modulation especially for outer k-space lines. Figure 3 illustrates simulated signal intensity in one readout train with three different phase error steps (Δφ = 0°, 0.3°, and 1°). Strong modulation of the transverse magnetization is observed with increased phase error step using ACE in the phase-encoding direction. By contrast, linear-encoding order shows substantially improved tolerance to such phase error. As shown in Fig. 3(c), the signal fluctuation of ACE scheme is quite sensitive to frequency offset. Strong signal oscillation is expected with 0.3° phase error step and 30 Hz frequency offset. Benign signal behavior is achieved using linear-encoding under the same circumstance. The proposed LCE scheme has linearly increased phase error, similar to linear-encoding, but with smaller increment (e.g., Δφ, 3Δφ, 5Δφ, …, 59Δφ, 61Δφ in one segment). Similar signal behavior and smaller fluctuation are expected as compared to linear-encoding.
Figure 3.
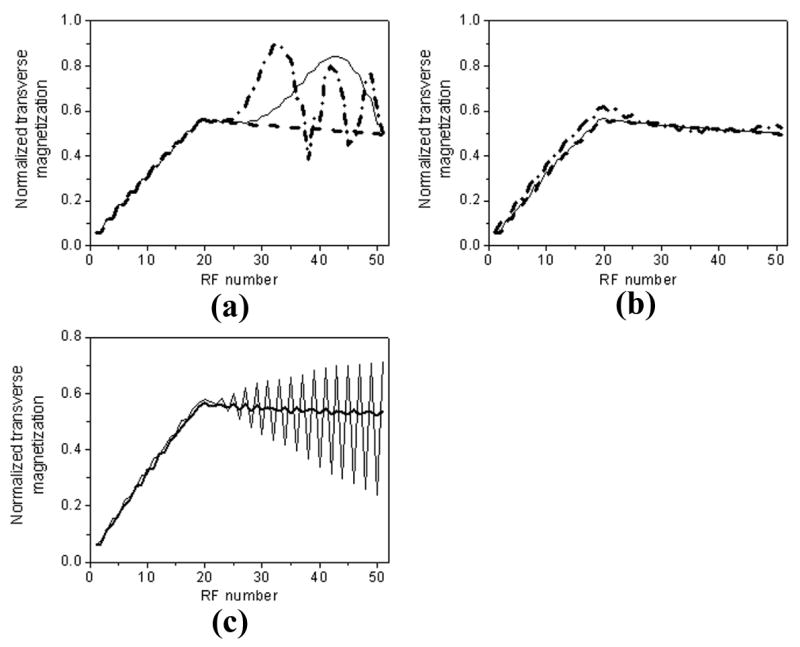
Simulated transverse magnetization in one readout train with three different phase error steps (Δφ = 0°, 0.3°, and 1°). 20 linear ramp-ups are applied before data readout. Using conventional centric-encoding (a) PE order, signal oscillation increases with phase error step, as indicated by increased signal fluctuation from 0° (dashed line) to 0.3° (solid line), and 1° (dash-dotted line) in the figure. In comparison, linear-encoding order (b) shows improved signal stability with phase errors. Signal fluctuation is relatively small even with phase error step as high as 1°. Note the signal stability is related to local frequency offset. As illustrated in (c), strong signal oscillation is expected with a 30 Hz frequency offset and 0.3° phase error step using centric-encoding scheme (thin line). Linear-encoding shows much better tolerance to off-resonance in contrast. Signal fluctuation is very small indicated by thick line in (c). Parameters for simulation include: 20 linear ramp-ups, TR/TE = 3.2/1.6 msec, flip angle = 70°, 124 phase-encoding lines, 31 lines per heart beat, T1/T2 = 1200/250 msec.
Methods
MR studies were performed on 1.5 T (Sonata) and 3.0 T (Trio) Siemens whole-body scanners (Siemens Medical Solutions, Erlangen, Germany). Each scanner was equipped with a built-in volume coil operating as the RF transmitter. Gradient coil and amplifier systems of these two systems were both capable of operating at a maximum gradient strength of 40 mT/m and a slew rate of 200 mT/m/ms. 12-element and 8-element phased-array cardiac coils were configured for our 1.5 and 3.0 T systems, respectively, for signal collection.
Phantom Study
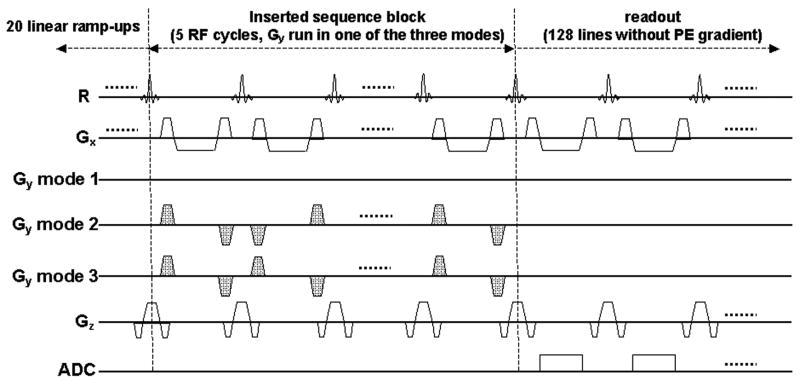
Phantom studies were performed to compare the impact of different PE encoding modes on signal magnitude. Imaging sequence was modified from a two-dimensional SSFP sequence with 20 linearly ramping up dummy pulses (23). Constant readout and slice-selective gradients were played in each RF cycle. As illustrated in Figure 4, a new sequence block was inserted to the original sequence between linear ramp-ups and data readout. The PE gradients in the added block could be selected to run in one of the following three modes: mode 1: no PE gradient; mode 2: five PE gradient pairs in ACE order; mode 3: five PE gradient pairs in LCE order. The analog-to-digital converter was turned on to collect one raw data line in each RF cycle right after the inserted block. No PE gradients were played during readout thus difference of the signal magnitude in these three modes was originated from PE gradient pairs of the inserted block.
Figure 4.
Schematic of the sequence used for phantom study. A new block was inserted between original linear ramp-ups and data readout. The sequence was selected to run in one of the three modes: mode 1: no PE gradient (Gy); mode 2: five Gy pairs in ACE order; mode 3: five Gy pairs in LCE order. All PE gradients were turned off during data readout. Constant Gx and Gz were played out in linear ramp-ups, inserted block, and data readout. Difference of measured signal magnitude among these three modes was originated from Gy in the inserted block.
Although water phantom has been used in numerous MR experiments, the RF non-homogeneity in it is more severe as compared to that in oil phantom, especially with increased dielectric effect from 1.5 T to 3.0 T. A spherical oil phantom (diameter = 220 mm) was scanned in this study at both field strengths using the above sequence. The phantom was placed at the isocenter of the scanner. Five minutes were allowed for the liquid to stabilize before imaging. Signal was collected using volume body coil with three modes in a random order. Additional two minutes were waited between two consecutive scans to allow residual eddy currents to decay. The amplitude of the gradient pairs was 16.2 mT/m, equaling the PE gradient of the outmost PE line with 128×128 matrix size and 300×300 mm2 field-of-view. Ramping up and down time of all PE gradients were 210 μsec, identical to the value used for coronary artery imaging. Imaging raw data were analyzed offline on a personal computer using Matlab (The MathWorks Inc, Natick, MA). The signal intensity from each readout line (128 data points) was calculated to be the average magnitude of low spatial frequency points (three central data points of each readout line in this case).
In Vivo Coronary Artery Imaging
14 volunteers (9 males, 5 females, age from 26 to 52 years old) without known coronary artery disease were recruited for this study. Written consent was obtained from each volunteer before the study, in compliance with our Institutional Review Board guidelines. Six volunteers were scanned at 1.5 T and others were imaged on the 3.0 T scanner. A 3D SSFP sequence (9) was modified to be able to switch between ACE and LCE encoding modes without altering any other parameters for coronary artery imaging.
The left anterior descending (LAD) coronary artery and right coronary artery (RCA) were localized using low-resolution scout scans in combination with a built-in three-point plan-scan tool (24). Targeted 3D high-resolution imaging slabs were then acquired along these orientations using the modified sequence. Spectral selective fat-saturation pulse and 20 linear ramp-ups were played before data readout (23). Two image sets were acquired for each targeted coronary artery using ACE and LCE PE orders respectively with identical parameters. Subjects were instructed to hold the breath at the end of inspiration. Data acquisition was synchronized to mid-diastole of each cardiac cycle with ECG gating. Linear order was used for acquisition in the partition-encoding direction. To reduce the off-resonance artifacts at 3.0 T, synthesizer frequencies for proton and fat excitation frequencies were adjusted with a previously proposed frequency scout and adjustment method (20).
Each volume-targeted 3D image set was acquired in 24 consecutive heartbeats. For ACE scheme, the k-space trajectory alternated between positive and negative k-space in each segment or heartbeat. Data collected in four consecutive heartbeats were interleaved to fill the k-space of one slice in the 3D slab. Using LCE order, the positive half of the k-space was filled by interleaving data from the first two heartbeats. The negative half was filled by the next two segments. Imaging parameters included 31–35 PE lines / heartbeat, depending on the heart rate of the subject. Data matrix size = (124–140) × 384 (PE × readout direction), corresponding to a 1.2–1.5 × 1.0 mm2 in-plane spatial resolution. Slab thickness was 18 mm with 6 partitions acquired and sinc-interpolated to 12. Flip angle was 70° at both field strengths. Other imaging parameters included TR/TE = 3.2/1.3 msec, bandwidth = 980 Hz/pixel.
Data analysis
Signal intensity was measured on 3D source images. To reduce discrepancies in regions-of-interest (ROIs) selection in small coronary arteries, blood signal intensity was measured in the aorta at the level of coronary ostia. Circular ROIs were confined within the boundaries of aorta. Noise level was estimated as the standard deviation of the background air (25). SNR was calculated for each subject by dividing noise from the measured blood signal intensity.
Coronary artery images were blindly graded by one of the authors on a scale from 1 to 4 (26), with 1 indicating poor or not interpretable (coronary artery visible with marked artifacts); 2, good (coronary artery visible with moderate artifacts); 3, very good (coronary artery visible with mild artifacts); 4, excellent (coronary artery visible with no obvious artifacts). ACE and LCE images were placed in a random order and blinded to the grader.
Measured results of the SNR and grades were presented separately for 1.5 T and 3.0 T as mean ± standard deviation for each encoding scheme. The SNR and image quality between the two PE schemes were compared separately at these two field strengths. All comparisons were performed using paired t-test with two-tailed P-values ≤ 0.05 considered statistically significant.
Results
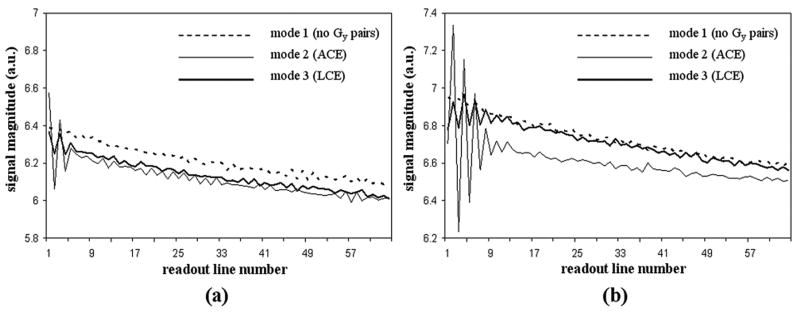
Measured signal magnitudes from the oil phantom using different PE modes are shown in Figure 5. The echo magnitude from the 1st to the 64th readout line decreases smoothly with the sequence running in mode 1 (no PE pairs) at both 1.5 T (a) and 3.0 T (b). In contrast, strong oscillations are observed after playing paired ACE PE gradients in mode 2. This is especially obvious in the first several readout lines close to the added PE gradients where residual eddy currents from PE gradients are the strongest. Moderate oscillation was observed with LCE PE gradients (mode 3). As compared to ACE mode (mode 2), the fluctuations of signal amplitude are markedly reduced at both field strengths with LCE mode. The signal magnitudes of mode 3 and mode 1 are similar and they are slightly higher than that of the mode 2 especially at 3.0 T.
Figure 5.
Signal magnitude measured from a static oil phantom at 1.5 T (a) and 3.0 T (b). The PE gradient (Gy) pairs were selected to run in one of three modes. Signal magnitude from the 1st readout line to the 64th line decreases smoothly in mode 1 (no Gy pairs) at both field strengths. Strong signal oscillations are observed in mode 2 (paired ACE Gy gradients) especially for those readout lines close to the inserted Gy pairs. Moderate oscillation is observed in mode 3 (LCE Gy gradients). Note the fluctuations are significantly reduced from mode 2 to mode 3. The signal magnitudes of mode 3 and mode 1 are similar and they are higher than that of the mode 2 especially at 3.0 T.
Phantom images acquired at both field strengths using ACE and LCE PE orders are illustrated in Figure 6. Signal oscillations in images acquired with ACE scheme were markedly reduced by using LCE PE order.
Figure 6.
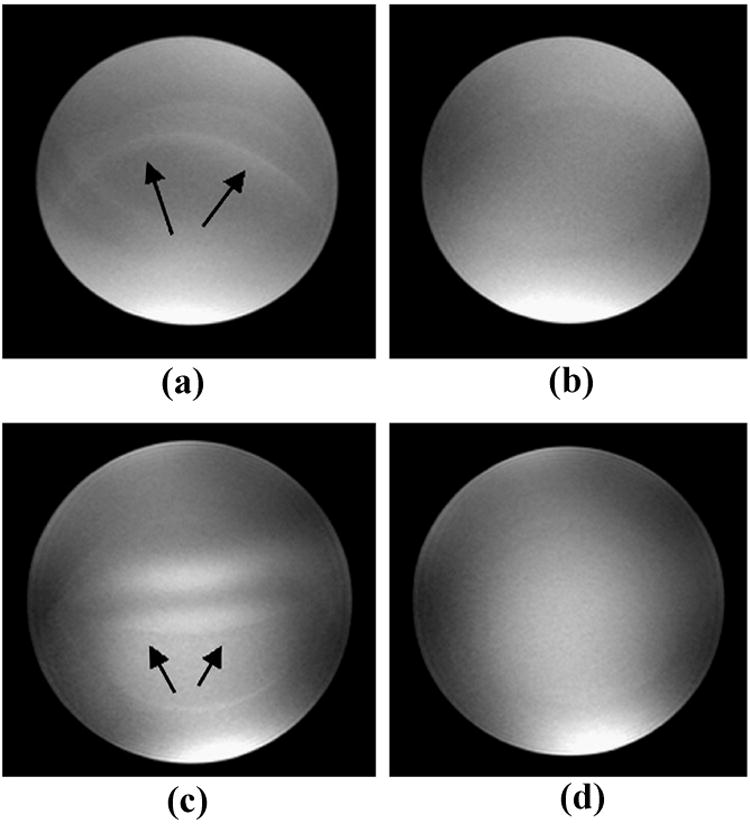
Phantom images acquired with the magnetization prepared SSFP sequence at 1.5 T (a, b) and 3.0 T (c, d). Imaging artifacts as indicated by arrows in images (a) and (c) acquired with the ACE PE scheme were effectively reduced by using LCE PE order (images b and d).
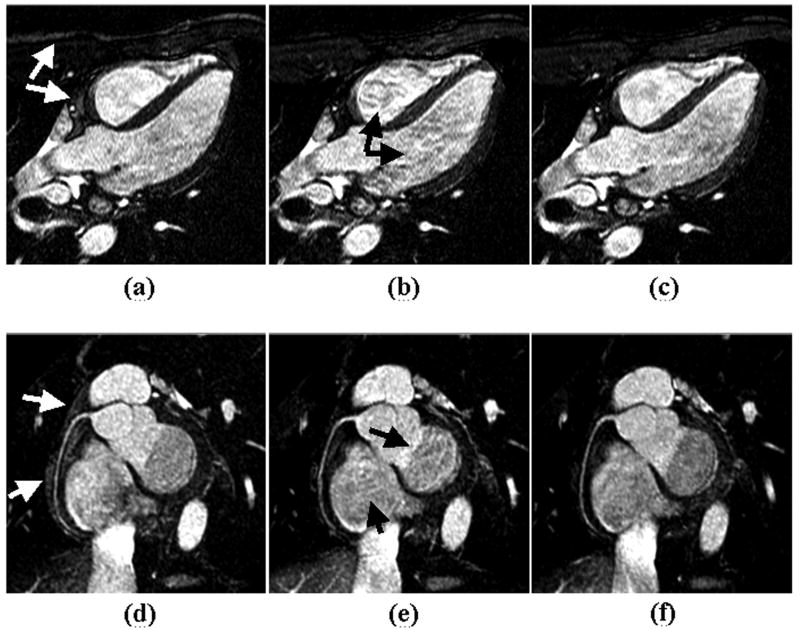
Figure 7 illustrates a set of coronary artery images acquired from a healthy volunteer at 1.5 T using conventional linear-encoding (k-space trajectory moved from negative to positive direction in linear mode in each readout train), ACE, and the proposed LCE PE orders. Homogenous signal intensity was achieved in the blood pool using linear-encoding. However, fat suppression is suboptimal as indicated by white arrow in images (a) and (d). By collecting central k-space lines at the beginning of each readout train using centric-encoding (both ACE and LCE), the recovery time for fat from the saturation pulse to central k-space lines is minimized. Fat signal is effectively suppressed (images b, c, e, and f). Noticeable signal oscillations are observed in images acquired with ACE order as indicated by black arrows in images (b) and (e). Such signal fluctuations are markedly reduced by acquiring data in LCE order. The right coronary artery is sharply depicted using LCE acquisition in image (f) with good fat saturation and minimal artifacts.
Figure 7.
Images acquired from a healthy volunteer at 1.5 T using conventional linear-encoding (a, d), alternating-centric-encoding (b, e), and the proposed linear-centric-encoding (c, f). Homogenous signal intensity is achieved using linear-encoding. However, fat suppression is suboptimal as indicated by white arrow in images (a) and (d). By collecting low k-space lines at time points close to the fat saturation pulse, fat signal is effectively suppressed using centric-encoding. Flow and eddy current induced artifacts using ACE acquisition (black arrows in images b and e) are markedly reduced with LCE PE order. The right coronary artery is sharply depicted with LCE acquisition as shown in image (f).
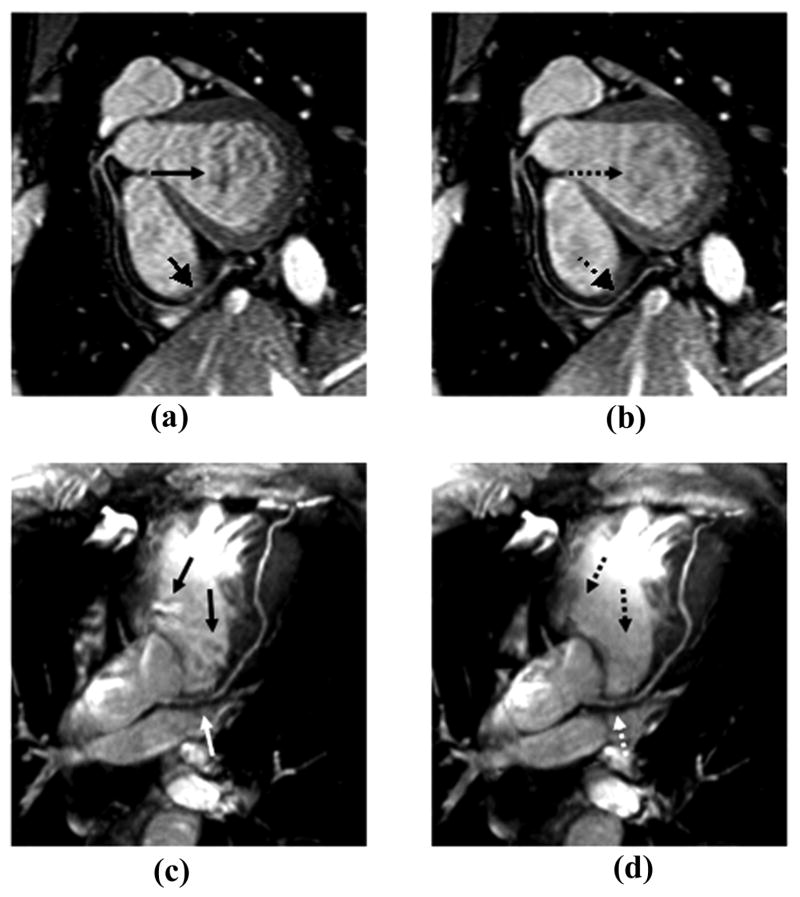
Coronary MRA are successfully performed at both field strengths without complications. RCA and LAD coronary arteries are visualized from all subjects. Figure 8 illustrates one set of RCA images acquired at 1.5 T (a, b) and a pair of LAD images collected at 3.0 T (c, d). Noticeable artifacts in ACE images (solid arrows in image (a) at 1.5 T and image (c) at 3.0 T) are substantially reduced with LCE encoding scheme (dashed arrows in image b at 1.5 T and image d at 3.0 T), in agreement with the results observed in phantom study. Quantitative results of the graded images quality from all volunteers are: at 1.5 T, ACE / LCE = 2.2 ± 0.8 / 3.0 ± 0.6, p = 0.02; 3.0 T: ACE / LCE = 2.1 ± 1.1 / 3.0 ± 0.8, p = 0.01. SNR measured from 3.0 T images using LCE scheme is 8.5% higher than that using ACE PE order (ACE: 36.3 ± 11.9; LCE: 39.4 ± 12.1, p = 0.03). At 1.5 T, a slight but not significant improvement (5.2%) is observed with LCE PE order (ACE: 26.7 ± 6.4; LCE: 28.1 ± 4.7, p = 0.28).
Figure 8.
Coronary artery images acquired with the magnetization prepared SSFP sequence at 1.5 T (a, b) and 3.0 T (c, d). Imaging artifacts as indicated by solid arrows in images (a) and (c) acquired with the ACE PE scheme were effectively reduced by using LCE PE order (dashed arrows in images b and d). The distal portion of RCA and proximal portion of LAD were sharply depicted with LCE PE scheme.
Discussion
In this study, we have shown from numeric simulations, phantom study, as well as in vivo studies that flow and eddy currents induced signal intensity oscillations in conventional ACE SSFP sequence can be significantly reduced by using a LCE PE order. The efficacy of this PE encoding scheme is validated in coronary MRA studies at both 1.5 T and 3.0 T using an ECG gated, magnetization prepared, segmented 3D SSFP sequence.
Switching of the encoding gradients causes change of magnetic flux. This in turn builds up eddy currents in conductive components of the imaging system. The eddy currents result in spatially varying phase errors for the magnetization and lead to imaging artifacts. Corrections of these currents require additional correction hardware or careful characterization of some system related parameters. It is a complicated procedure and beyond the scope of this study. Recent study has shown that SSFP image is well tolerant to constant or slowly varying spectral frequency offset or phase error (27). Thus it is possible to alleviate eddy currents related imaging artifacts by reducing abrupt changing of gradients. Unlike in ACE order sequence where PE gradients alternate the amplitude as well as polarity between two consecutive RF cycles, the polarity of PE gradient pairs (including balanced encoding and refocusing gradients in one RF cycle) is played in the same pattern throughout the whole segment in LCE order. Constant increment of the amplitude is applied to move the trajectory from center to outer k-space lines smoothly and uni-directionally. Signal oscillation is markedly reduced with minimal difference of induced phase error in consecutive RF cycles. In the partition-encoding and readout directions, constant gradients are applied from magnetization preparation to data readout in each segment. Constant phase errors are less detrimental to the image compared to those originated from varying PE gradients.
The proposed LCE scheme is indeed in agreement with the “pairing” concept recently proposed by Bieri and Scheffler (14). By continuously acquiring k-space lines close to each other in LCE mode (every other line in this study for in vivo studies), similar phase errors will be induced in consecutive RF cycles. Such phase errors can largely cancel each other due to the intrinsic 180 phase-cycling scheme of SSFP sequence.
Phase errors are simplified to a linear function of applied gradients in this study. Higher order motions and pulsatile flow may deflect such linear relation and is beyond the scope of discussion here. We did not differentiate imaging artifacts from flow and eddy currents in this study because they both induce signal oscillations, especially for high spatial frequency components. The effect of eddy currents on signal fluctuation is illustrated from static phantom. For in vivo studies, imaging artifacts are from a combination of flow and eddy currents. The small ripples in the blood pools of images acquired using ACE acquisition (Fig. 7 and 8) demonstrate phase errors in high k-space components. Such artifacts are more obvious in the blood pool. This indicates that phase errors from flow might be more significant than those from eddy currents.
Simulations (Fig. 3c) have shown that SSFP sequence tends to be more vulnerable to phase errors under off-resonant condition. The magnetic field tends to be less homogenous with increased field strength. This has been one of the major limiting factors for performing coronary MRA at 3.0 T using SSFP sequence. Thus, it is especially valuable to reduce any potential source of field imperfections at 3.0 T. In this study, good quality coronary artery images are acquired at 3.0 T with volumetric shimming of the whole heart, careful adjustment of the synthesizer frequency (20), and LCE order for data acquisition.
The proposed LCE PE order is a hybrid of conventional centric-encoding (ACE) and linear-encoding orders. It preserves the advantages of ACE including good gating and magnetization preparation effects by collecting low spatial frequency lines at the beginning. At the same time, smooth transition of the PE gradients preserves the advantages of conventional linear-encoding order. The sequence is well tolerant to flow and eddy currents induced phase error in coronary MRA without the need of adding additional hardware or pre-emphasis gradients.
Coronary artery images are acquired under breath-hold in this study. Data for each imaging slice is collected in four consecutive heartbeats and the spatial resolution is still limited. The proposed LCE PE order can be combined with parallel data acquisition methods (28,29) to improve the spatial resolution. Also it can be combined with free-breathing navigator-echo gating method (30,31) that allows for longer data acquisition time. The application of such PE order is not limited to coronary MRA. It can be used in any type of segmented Cartesian data acquisition.
In conclusion, we have shown that by a simple reordering of PE steps, flow and eddy currents induced artifacts from segmented SSFP sequence can be markedly reduced at both 1.5 T and 3.0 T. The SNR of coronary artery images is improved as well at 3.0 T. We anticipate that such LCE PE order may work as well in other applications using segmented SSFP sequence.
Acknowledgments
Supported in part by National Institute of Health grants no. EB002623, HL38698 and Siemens Medical Solutions, Chicago, IL, USA
Footnotes
Publisher's Disclaimer: This is a PDF file of an unedited manuscript that has been accepted for publication. As a service to our customers we are providing this early version of the manuscript. The manuscript will undergo copyediting, typesetting, and review of the resulting proof before it is published in its final citable form. Please note that during the production process errors may be discovered which could affect the content, and all legal disclaimers that apply to the journal pertain.
References
- 1.Scheffler K, Heid O, Hennig J. Magnetization preparation during the steady state: fat-saturated 3D TrueFISP. Magn Reson Med. 2001;45:1075–1080. doi: 10.1002/mrm.1142. [DOI] [PubMed] [Google Scholar]
- 2.Deshpande VS, Shea SM, Laub G, Simonetti OP, Finn JP, Li D. 3D magnetization-prepared true-FISP: a new technique for imaging coronary arteries. Magn Reson Med. 2001;46:494–502. doi: 10.1002/mrm.1219. [DOI] [PubMed] [Google Scholar]
- 3.Scheffler K, Hennig K. Eddy current optimized phase encoding schemes to reduce artifacts in balanced SSFP imaging. Proc Intl Soc Mag Reson. 2003:294. [Google Scholar]
- 4.Markl M, Leupold J, Bieri O, Scheffler K, Hennig J. Double average parallel steady-state free precession imaging: optimized eddy current and transient oscillation compensation. Magn Reson Med. 2005;54:965–974. doi: 10.1002/mrm.20615. [DOI] [PubMed] [Google Scholar]
- 5.Bieri O, Markl M, Scheffler K. Analysis and compensation of eddy currents in balanced SSFP. Magn Reson Med. 2005;54:129–137. doi: 10.1002/mrm.20527. [DOI] [PubMed] [Google Scholar]
- 6.Ahn CB, Cho ZH. Analysis of eddy currents in nuclear magnetic resonance imaging. Magn Reson Med. 1991;17:149–163. doi: 10.1002/mrm.1910170119. [DOI] [PubMed] [Google Scholar]
- 7.Alexander AL, Tsuruda JS, Parker DL. Elimination of eddy current artifacts in diffusion-weighted echo-planar images: the use of bipolar gradients. Magn Reson Med. 1997;38:1016–1021. doi: 10.1002/mrm.1910380623. [DOI] [PubMed] [Google Scholar]
- 8.Spincemaille P, Nguyen TD, Wang Y. View ordering for magnetization prepared steady state free precession acquisition: application in contrast-enhanced MR angiography. Magn Reson Med. 2004;52:461–466. doi: 10.1002/mrm.20192. [DOI] [PubMed] [Google Scholar]
- 9.Jung BA, Hennig J, Scheffler K. Single-breathhold 3D-trueFISP cine cardiac imaging. Magn Reson Med. 2002;48:921–925. doi: 10.1002/mrm.10280. [DOI] [PubMed] [Google Scholar]
- 10.Tsao J, Kozerke S, Boesiger P, Pruessmann KP. Optimizing spatiotemporal sampling for k-t BLAST and k-t SENSE: application to high-resolution real-time cardiac steady-state free precession. Magn Reson Med. 2005;53:1372–1382. doi: 10.1002/mrm.20483. [DOI] [PubMed] [Google Scholar]
- 11.Sakuma H, Kawada N, Takeda K, Higgins CB. MR measurement of coronary blood flow. J Magn Reson Imaging. 1999;10:728–733. doi: 10.1002/(sici)1522-2586(199911)10:5<728::aid-jmri17>3.0.co;2-x. [DOI] [PubMed] [Google Scholar]
- 12.Storey P, Li W, Chen Q, Edelman RR. Flow artifacts in steady-state free precession cine imaging. Magn Reson Med. 2004;51:115–122. doi: 10.1002/mrm.10665. [DOI] [PubMed] [Google Scholar]
- 13.Markl M, Alley MT, Elkins CJ, Pelc NJ. Flow effects in balanced steady state free precession imaging. Magn Reson Med. 2003;50:892–903. doi: 10.1002/mrm.10631. [DOI] [PubMed] [Google Scholar]
- 14.Bieri O, Scheffler K. Flow compensation in balanced SSFP sequences. Magn Reson Med. 2005;54:901–907. doi: 10.1002/mrm.20619. [DOI] [PubMed] [Google Scholar]
- 15.Li W, Storey P, Chen Q, Li BS, Prasad PV, Edelman RR. Dark flow artifacts with steady-state free precession cine MR technique: causes and implications for cardiac MR imaging. Radiology. 2004;230:569–575. doi: 10.1148/radiol.2302021257. [DOI] [PubMed] [Google Scholar]
- 16.Nguyen TD, Spincemaille P, Wang Y. Improved magnetization preparation for navigator steady-state free precession 3D coronary MR angiography. Magn Reson Med. 2004;51:1297–1300. doi: 10.1002/mrm.20095. [DOI] [PubMed] [Google Scholar]
- 17.Weber OM, Martin AJ, Higgins CB. Whole-heart steady-state free precession coronary artery magnetic resonance angiography. Magn Reson Med. 2003;50:1223–1228. doi: 10.1002/mrm.10653. [DOI] [PubMed] [Google Scholar]
- 18.Weber OM, Pujadas S, Martin AJ, Higgins CB. Free-breathing, three-dimensional coronary artery magnetic resonance angiography: comparison of sequences. J Magn Reson Imaging. 2004;20:395–402. doi: 10.1002/jmri.20141. [DOI] [PubMed] [Google Scholar]
- 19.Schar M, Kozerke S, Boesiger P. Considerations on Shimming for Cardiac Applications at 1.5 and 3.0T. Proc Intl Soc Mag Reson. 2003:174. [Google Scholar]
- 20.Deshpande VS, Shea SM, Li D. Artifact reduction in true-FISP imaging of the coronary arteries by adjusting imaging frequency. Magn Reson Med. 2003;49:803–809. doi: 10.1002/mrm.10442. [DOI] [PubMed] [Google Scholar]
- 21.Jehenson P, Westphal M, Schiff N. Analytical method for the compensation of eddy-current effects induced by pulsed magnetic field gradient in NMR systems. J Magn Reson. 1990;90:264–278. [Google Scholar]
- 22.Wood ML, Zur Y, Neuringer LJ. Gradient moment nulling for steady-state free precession MR imaging of cerebrospinal fluid. Med Phys. 1991;18:1038–1044. doi: 10.1118/1.596739. [DOI] [PubMed] [Google Scholar]
- 23.Deshpande VS, Chung YC, Zhang Q, Shea SM, Li D. Reduction of transient signal oscillations in true-FISP using a linear flip angle series magnetization preparation. Magn Reson Med. 2003;49:151–157. doi: 10.1002/mrm.10337. [DOI] [PubMed] [Google Scholar]
- 24.Stuber M, Botnar RM, Danias PG, Sodickson DK, Kissinger KV, Van Cauteren M, De Becker J, Manning WJ. Double-oblique free-breathing high resolution three-dimensional coronary magnetic resonance angiography. J Am Coll Cardiol. 1999;34:524–531. doi: 10.1016/s0735-1097(99)00223-5. [DOI] [PubMed] [Google Scholar]
- 25.Stuber M, Botnar RM, Fischer SE, Lamerichs R, Smink J, Harvey P, Manning WJ. Preliminary report on in vivo coronary MRA at 3 Tesla in humans. Magn Reson Med. 2002;48:425–429. doi: 10.1002/mrm.10240. [DOI] [PubMed] [Google Scholar]
- 26.Kim WY, Danias PG, Stuber M, Flamm SD, Plein S, Nagel E, Langerak SE, Weber OM, Pedersen EM, Schmidt M, Botnar RM, Manning WJ. Coronary magnetic resonance angiography for the detection of coronary stenoses. N Engl J Med. 2001;345:1863–1869. doi: 10.1056/NEJMoa010866. [DOI] [PubMed] [Google Scholar]
- 27.Foxall DL. Frequency-modulated steady-state free precession imaging. Magn Reson Med. 2002;48:502–508. doi: 10.1002/mrm.10225. [DOI] [PubMed] [Google Scholar]
- 28.Pruessmann KP, Weiger M, Scheidegger MB, Boesiger P. SENSE: sensitivity encoding for fast MRI. Magn Reson Med. 1999;42:952–962. [PubMed] [Google Scholar]
- 29.Griswold MA, Jakob PM, Heidemann RM, Nittka M, Jellus V, Wang J, Kiefer B, Haase A. Generalized autocalibrating partially parallel acquisitions (GRAPPA) Magn Reson Med. 2002;47:1202–1210. doi: 10.1002/mrm.10171. [DOI] [PubMed] [Google Scholar]
- 30.Taylor AM, Jhooti P, Firmin DN, Pennell DJ. Automated monitoring of diaphragm end-expiratory position for real-time navigator echo MR coronary angiography. J Magn Reson Imaging. 1999;9:395–401. doi: 10.1002/(sici)1522-2586(199903)9:3<395::aid-jmri6>3.0.co;2-y. [DOI] [PubMed] [Google Scholar]
- 31.Wang Y, Rossman PJ, Grimm RC, Riederer SJ, Ehman RL. Navigator-echo-based real-time respiratory gating and triggering for reduction of respiration effects in three-dimensional coronary MR angiography. Radiology. 1996;198:55–60. doi: 10.1148/radiology.198.1.8539406. [DOI] [PubMed] [Google Scholar]


