Abstract
In the serosal cavities (e.g. pleural, pericardial) soft tissues slide against each other, lubricated by thin fluid. We used rotational devices to study the tribology of such tissues, which appear to exhibit mixed and hydrodynamic lubrication. To explore mechanism, we modeled the interaction of fluid and soft material in 3D using a simple cylindrical geometry with an uneven solid-fluid interface in rotation. Deformation of the solid, frictional force, and fluid thickness are presented as a function of applied rotational velocity, applied normal load and material properties. The results suggest that the deformation caused by hydrodynamic pressure leads to load-supporting behavior.
Keywords: Finite element analysis, Soft biological tissues, Elastohydrodynamic lubrication, Surface roughness, FSI, ADINA
1. Introduction
Pleural surfaces, lubricated with a thin layer of fluid slide against each other in a periodic cyclic fashion during breathing. The nature of the lubrication regime that exists during breathing is currently in debate, and the important question of whether there are points of contact between the sliding pleural surfaces remains controversial.
Agostoni et al. [1] proposed that the difference between pleural liquid pressure and the pressure measured on the lung and chest wall surfaces can be explained by the existence of points of contact between lung and chest wall. This concept would require a boundary lubrication regime, in which normal loads are carried in large part by points of contact, or a mixed lubrication regime (hydrodynamic lubrication but including contact points) in the pleural space. A different concept was offered by Lai-Fook and coworkers, [2], who suggested that the pleural surface pressure was locally equal to the pleural liquid pressure, and that a continuous pleural liquid layer separates the pleural surfaces. This concept would imply pure hydrodynamic lubrication in the pleural space.
The mesothelial surfaces covering the pleural tissues exhibit unevenness or roughness over a wide range of in-plane length scales (here referred to as wavelength) and amplitudes normal to the tangent plane of the surface. Using numerical methods, Lai et al. [3] suggested that the sliding motion in the pleural space promotes evenness of the fluid thickness, and prevents bumps of the surface from touching. Subsequently, Gouldstone et al. [4] modeled the pleural space in two dimensions using a finite element method. The results confirmed that the deformation due to sliding leads to smoothening of the tissue surface and promotes uniformity of fluid thickness. They observed a high dependency of the deformation on the bump wavelength, indicating that longer bumps undergo larger deformations resulting in more uniform fluid thickness. They also found significant persistent deformation during periodic sliding (e.g. sinusoidal velocity profile) when the period of applied velocity was less than the characteristic time required to approach steady state.
We studied the lubrication of soft biological tissues in experiments reported previously ([10]). The results are also reviewed in this manuscript, in the discussion section (4.6). To understand the mechanism underlying these experimental results, we used finite element analysis to simulate the elastohydrodynamic sliding friction of such tissues in a rotational device. The problem of elastohydrodynamic lubrication of biological tissues is well suited to numerical methods, since such materials undergo large deformations due to hydrodynamic pressure and shearing stresses, and analytical solutions typically require drastic simplifications [5].
We present the result of our simulation, the interaction of lubricated rotating flat surface and soft tissue in three dimensions using ADINA1. Results suggest that deformation of the soft tissues caused by hydrodynamic pressure leads to a load-supporting behavior.
2. Assumptions and Problem Formulation
The model is a finite element simulation of an elastohydrodynamic lubrication problem, in which both fluid and solid models have simple cylindrical geometries with an uneven solid-fluid interface. The flat rotating surface at the bottom is simulated by velocity boundary conditions at the lower fluid surface consistent with a rigid plate in rotation about the symmetry axis. The interfacial surface of the solid consists of sinusoidal circumferential bumps, which when undeformed are symmetrical about the axis of rotation. We adopt cylindrical coordinates (r, θ, z), where the z coordinate is coincident with the axis of rotation, r is the radial coordinate in [0, R] and θ is the polar angle. Figure 1 illustrates graphically the undeformed solid and fluid models including their dimensions. The undeformed solid interface is formed of five sinusoidal circumferential bumps. In the undeformed state, the minimum fluid thickness hmin is constant for all r, and the maximum fluid thickness circumferentially grows linearly from hmin at r = 0 to a global maximum hmax at r = R. Thus, the undeformed solid-fluid interface in the model is given by
| (1) |
where
h is the fluid thickness at (r,θ),
hmin and hmax are the minimum and maximum fluid thickness over the entire disc,
n is the number of asperities of the solid interface (n=5 in our model),
R is the radius of the outer boundary of the model, and
for the solid, we introduce roughness parameters H1 and H2 as shown in Figure 1, where H1 is maximal solid thickness, and H2 = hmax -hmin.
Figure 1.
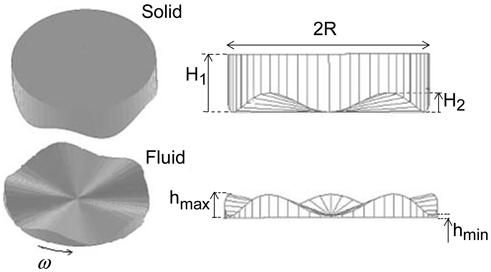
The schematic plot of the solid and fluid models. The bumps are magnified for better visualization.
A uniform angular velocity ω about the axis of rotation at the bottom surface simulates the rotating bottom surface. Zero pressure is imposed around the circumferential boundary of the fluid model at r = R; this permits fluid to flow across this boundary due to radial pressure gradients. The top surface of the fluid has a no-slip boundary condition and interacts with the deformable solid that represents a soft biological tissue. A constant pressure P is applied to the top surface of the solid. It should be remarked that the difference between pressure at the circumferential fluid boundary and the pressure applied at the solid top is the actual external load applied to the solid-fluid domain. In the other words increasing the pressure at the circumferential fluid boundary for a certain amount would be equal to decreasing the pressure at the solid top for the same amount.
Biological tissues in general are known to be poroelastic1. However, the low pressures in the pleural space and the rapid sliding of lung tissue on the chest wall make fluid flux in the tissue negligible [5] over time scales associated with breathing. We therefore modeled the solid as linearly elastic, isotropic, and incompressible. The fluid lubricant is taken to be Newtonian (constant viscosity) and incompressible. The material properties of solid and fluid models are shown in Table 1. We neglect gravitational and thermal effects.
Table 1.
Material Properties of Solid and Fluid Models (1 dyn/cm2=0.1 Pa)
| Solid Properties | |
| Modulus of Elasticity: E (dyn/cm2) | 5000 |
| Poisson’s ratio: ν | 0.49 |
| Fluid Properties | |
| Viscosity: τ (poise) | 0.01 |
| Density: ρ (g/cm3) | 1 |
3. Computational Method
Performing a 3D finite element analysis on elastohydrodynamic lubrication (EHL) has been challenging due to the time and computer memory required. To accelerate the convergence in transient analysis of EHL, Yiping et al. [7] implemented a Multigrid method to calculate the initial film thickness by first performing a finite element analysis on the fluid domain. The computed stresses from the fluid domain were used as boundary conditions for the solid domain. A finite element analysis was then performed on the solid model, and the computed deformed surface was used to construct new initial film thickness conditions for the FSI1 analysis on the new solid-fluid model. This method was computationally efficient, but the fluid geometry had to be regenerated to conform to solid matrix. Later on, Jin and Dowson [5] argued that even though biological tissues generally experience transient behavior, the steady state solution is a very good estimate of the full transient analysis in predicting the average fluid thickness under certain conditions such as in synovial joints. Furthermore, steady state analyses are much less time intensive than transient analyses.
In our simulations, while the accuracy of solution was a priority, optimizing the solution time and computer memory were also essential. In this regard, since the model is symmetrical with respect to the axis of rotation, we only need to solve for a partial model, comprising a 2π/5 segment using a spatially periodic boundary condition at the radial edges. As a condition of periodicity, both inlet and outlet of the partial fluid model have identical flow properties. Hence, the velocity vectors of the inlet and outlet flows in cylindrical coordinate are equal,
| (2) |
where V is the velocity vector of the fluid flow. The subscripts in and out refer to polar angles 0+ and (2π/5)-. For the solid model, the analogous conditions are on the displacement vectors, thus
| (3) |
in which d refers to the displacement vector of the corresponding node of the solid model. The partial models of the solid and film lubricant are meshed using 3D elements in ADINA as shown in Figure 2. The solid and fluid mesh contained 27-node brick elements. This element is very accurate and can be used for the low Reynolds number flows appropriate for lubrication problems [8].
Figure 2.
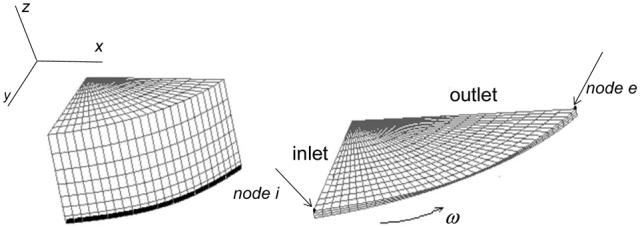
The meshed 2π/5 segment of the solid and fluid models.
An alternative boundary condition at the solid top is fixed displacement. By preventing the top of solid model from moving, displacements of solid-fluid interface are severely limited, leading to a quasi steady state behavior in a relatively short time. This leads to a substantial saving in computational time. Transient and steady state analyses were compared respectively on several top-free (with applied pressure on top) and top-fixed models. The results verified that approach to the steady state solution for the top-free models was consistent with the steady state solutions of the fixed-top models after interpolation for fixed normal loads. Therefore, we used various fixed-top positions for FSI model in steady state and computed the normal loads as dependent variables, and used interpolation to find fluid thickness behavior, shear torque, and roughness as functions of the interpolated normal loads.
4. Results and Discussion
Table 2 lists the parameters, dependent variables, and independent variables that we used in our simulation. Below we describe changes in fluid thickness, shear torque, friction coefficient, and roughness as a function of applied rotational velocity ω and applied normal loads Fn. At the end, the computational results are compared to the previously reported experimental data.
Table 2.
Parameters, dependent and independent variables (1 dyn=10-5 N).
| Parameters |
| R= 1 cm, Radius |
| H1, H2, Outer bump geometry |
| n= 5, Number of sinusoidal waves |
| Solid and fluid Properties in Table 1 |
| Dependent variables |
| δ, Roughness |
| hav, Average fluid thickness |
|
hmin, Minimum fluid thickness at outer boundary hmax, Maximum fluid thickness at outer boundary |
| T, Shear torque (dyn·cm) |
| μ, Friction coefficient |
| Independent Variables |
| ω, Angular velocity (rad/s) |
| Fn, Normal load (dyn) |
4.1 Fluid Thickness
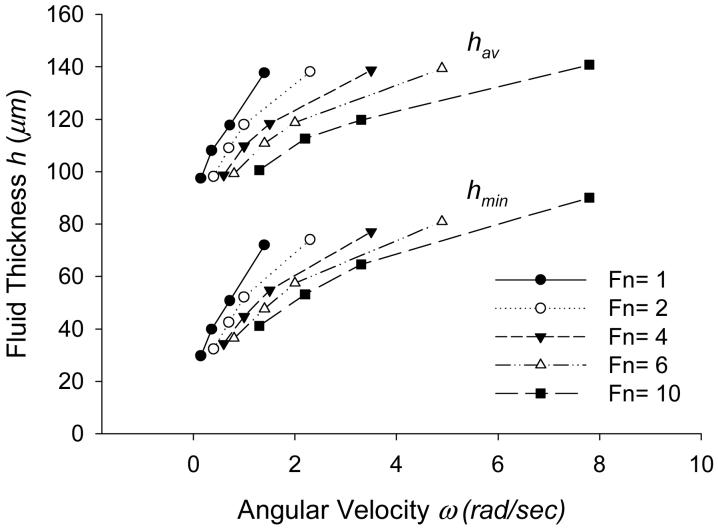
The average fluid thickness, hav, and the minimum fluid thickness (at the outer boundary), hmin, increase with ω and decrease with Fn (Fig. 3). Thus, for a constant Fn, as the bottom surface of the fluid rotates faster, the tissue lifts up and the fluid layer gets thicker. This is load-supporting behavior. By contrast, a rigid model having the same initial geometry (symmetrical about axis of rotation), loading, and boundary conditions did not exhibit load-supporting behavior.
Figure 3.
Steady state values of average fluid thickness hav and the minimum fluid thickness hmin (at the outer boundary) with ω (rad/s) and Fn (dyn, 1 dyn=10-5 N).
Shown in the figure, the fluid layer gets thinner as the normal load increases, but hmin changes less with Fn than hav, implying deformation of the tissue. Figure 3 also suggests that as ω increases, the changes in fluid thickness depend less on ω than on Fn. In other words, the rate of the fluid thickening with ω is greater at lower velocities, suggesting the load-supporting behavior is greater for lower values of ω. Similar behavior is observed for hmin.
4.2 Shear Torque
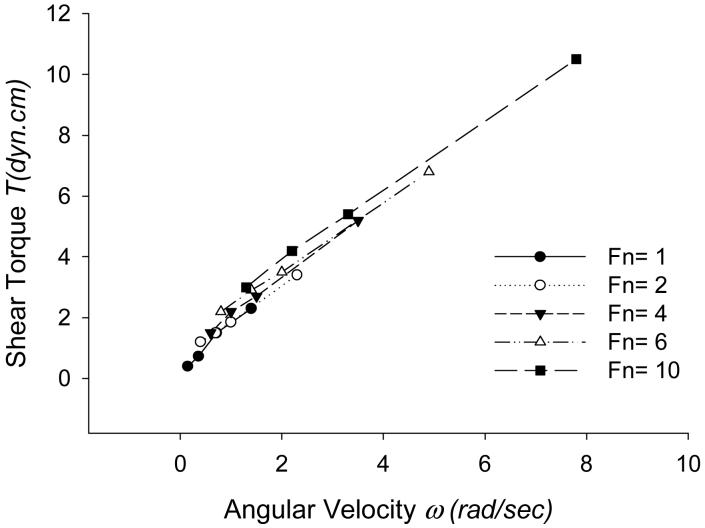
Figure 4 shows frictional shear torque at the solid-fluid interface for different values of ω and Fn. It suggests that shear torque increases rapidly with ω, but is only weakly dependent on Fn. However, in pure hydrodynamic lubrication with rigid solids, the frictional torque is strongly dependent on normal load. In the case of pure hydrodynamic lubrication, as Fn increases, the fluid thickness must get thinner in order to generate a higher positive pressure profile to support the applied normal load. The thinning of fluid also leads to a substantial increase in shear torque [9]. In Figure 3, it is apparent that the magnitude of average fluid thickness decreases as Fn increases, leading to thinning of the fluid film. However, in Figure 4, regardless of thinning of the fluid film, the frictional shear torque remains roughly constant as Fn increases. This suggests that the deformation of the solid caused by increasing Fn enhances the load-supporting characteristics of the solid-fluid interface.
Figure 4.
Steady state values of shear torque T (dyn·cm) at the solid-fluid interface with ω (rad/s) and Fn (dyn).
4.3 Roughness
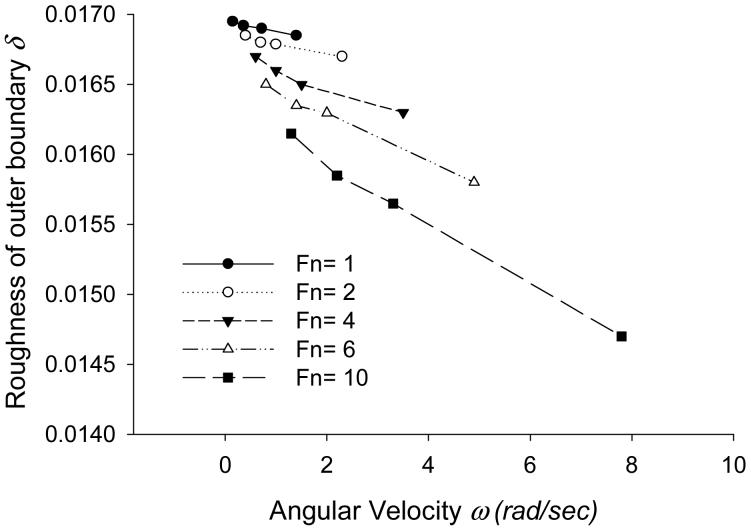
Figure 5 shows roughness of the bump ( δ ) at the outer boundary ( is the distance between node i and e shown in Figure 2) computed for different values of ω and Fn. δ decreases as ω increases, suggesting smoothing of the tissue surface under rotational sliding. This result is in qualitative agreement with the results presented by Gouldstone et al. [4] for a 2D model, in which they showed that sliding reduces the unevenness of the tissue surface and promotes the uniformity of fluid thickness. Also, the graph suggests that as Fn increases, the effects of ω on roughness increases, enhancing the smoothing rate.
Figure 5.
Steady state values of roughness δ of the outer boundary with ω (rad/s) and Fn (dyn).
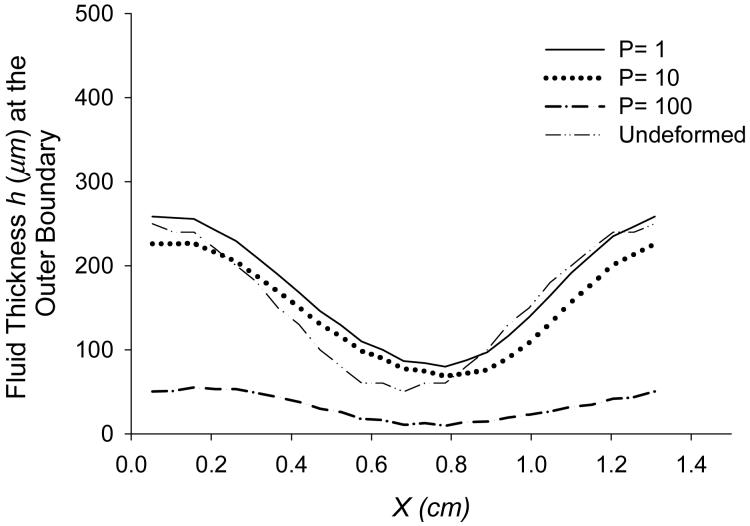
Figure 6 depicts the effects of normal load on fluid thickness at the outer boundary, simulated for angular velocity ω=6 rad/s under normal pressure loadings of 1, 10, 100 dyn/cm2 (1 dyn/cm2= 0.1 Pa). The graph suggests that higher loading at the top of solid causes fluid film thinning and smoothing of the solid-fluid interface.
Figure 6.
Steady state values of fluid thickness at the outer boundary under different normal pressures (dyn/cm2) at ω=6 rad/s.
Figure 7 shows the fluid pressure pattern plotted for a segment (2π/5) of the fluid model. It is apparent that positive and negative pressures are generated upstream and downstream of the outer bump, causing the deformation shown in Figure 6 that, in term, leads to load-supporting behavior.
Figure 7.
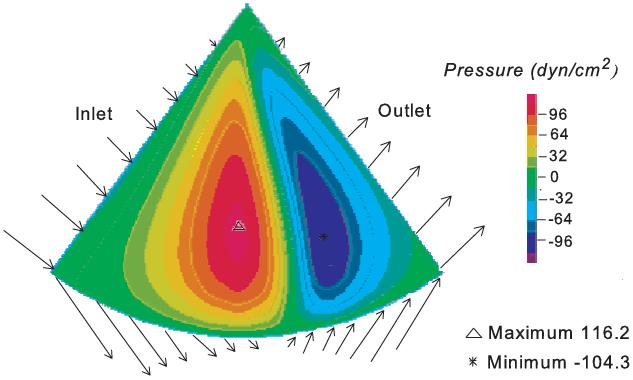
Steady state pressure profile of the fluid flow for applied normal pressure of 10 dyn/cm2 (1 Pa) at ω=6 rad/s. Flow vectors at the fluid boundary are shown.
4.4 Friction Coefficient
To obtain a global friction coefficient μ, we need to calculate an appropriately weighted ratio of tangential force to normal load at the solid-fluid interface. The tangential force is computed from the ratio of the net shear torque to the area weighted average radial distance of points within a circle with radius R [10]. These quantities are thus given by
| (4) |
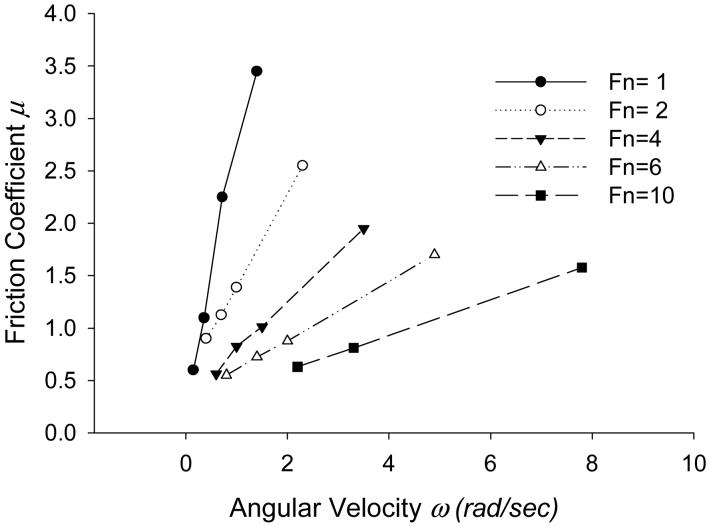
In pure hydrodynamic lubrication with rigid solids, the frictional coefficient is weakly dependent on both normal load and velocity. However, in our case (EHL), as shown in Figure 8, μ increases rapidly with ω and decreases with Fn. The rate of increase with velocity lessens as the load increases. In other words, the dependency of the friction coefficient on ω decreases as the solid is subjected to heavier loads. The figure also shows that μ is less dependent on Fn at lower ω.
Figure 8.
Steady state values of friction coefficient μ at the solid-fluid interface, with ω (rad/s) and Fn (dyn).
4.5 Effects of Modulus of Elasticity
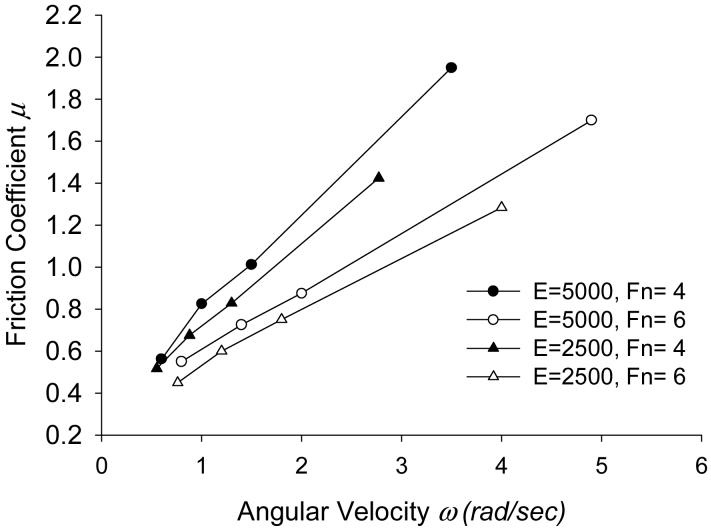
Figure 9 shows the effects of modulus of elasticity (Young’s modulus) of the solid on friction coefficient μ. The simulation is performed to compare the results for E=5000 and E=2500 dyn/cm2 (1 dyn/cm2= 0.1 Pa). The figure shows that the friction coefficient μ is less for softer materials in which there is greater deformation promoting the load-supporting behavior.
Figure 9.
Steady state values of friction coefficient μ at the solid-fluid interface, with ω (rad/s) and Fn (dyn) for different Modulus of Elasticity E (dyn/cm2, 1 dyn/cm2=0.1 Pa).
4.6 Comparison with the experimental results
The experiments [10] were performed using the peritoneal surface of the ventral belly wall of nine Sprague-Dawley rats. The tissue was mounted on a metal cup, with its mesothelial surface facing outward (Fig. 10). The cup with its attached tissue was positioned and fixed just above a rotating glass plate, and the tissue was pressed against the plate by air pressure within the cup providing a normal load. The glass plate covered with physiological saline rotates at a rate determined by a computer controlled drive. As the tissue surface slides on the rotating glass plate, the frictional force (torque) measured to characterize the lubrication behavior [10].
Figure 10.
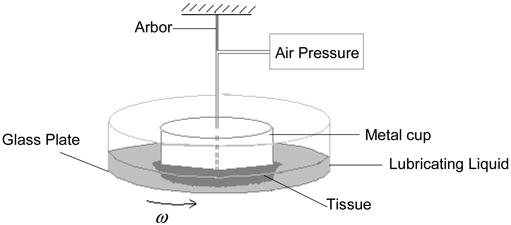
The experimental apparatus contains a glass plate, an arbor to hold the tissue, a motor, and a controller to transfer the desired rotational velocity from computer to the motor.
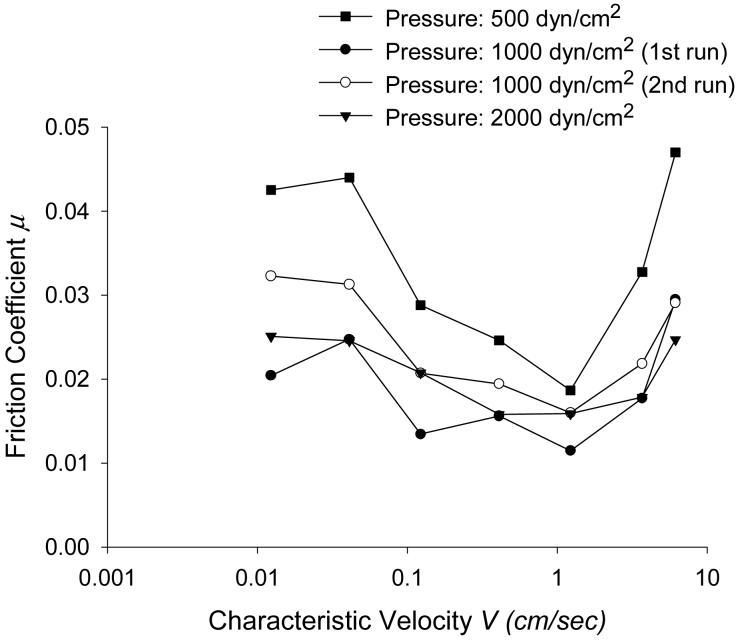
The experimental data shown in Figure 11 represents the results of one experiment [10]. The graph shows the variation of friction coefficient μ with characteristic velocity V for the applied pressure of P=500, 1000, 2000 dyn/cm2 [10]. At lower velocities, the friction coefficient decreases with velocity, as expected in mixed lubrication. At larger velocities, μ climbs with velocity as expected in fully hydrodynamic lubrication, similar to the computational results (Fig.8). In addition, friction coefficient decreases as normal load increases, in agreement with the results of our simulation.
Figure 11.
Experimental coefficient of friction μ as a function of characteristic velocity V, defined as the sliding speed at a point 79% from the center to the edge of the tissue. Reprinted from reference [10], Copyright (2005), with permission from Elsevier.
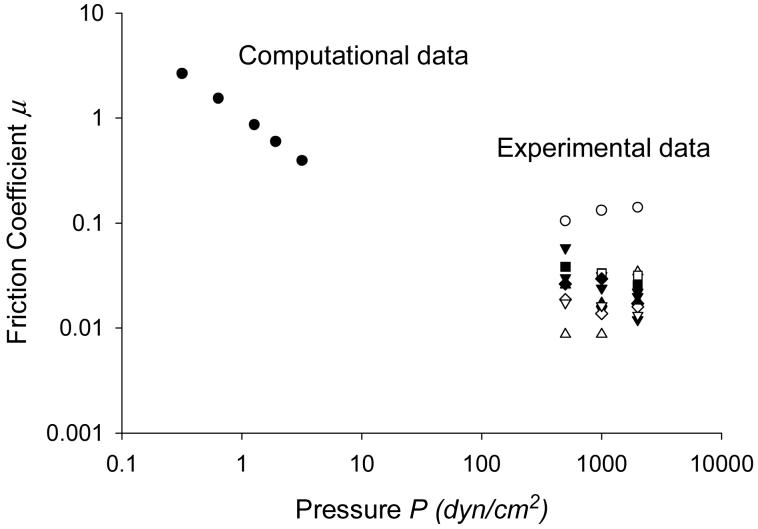
Figure 12 shows the computational and experimental friction coefficients plotted as function of normal load at ω=2 rad/s. Note that the finite element simulation used smaller loads than those of the experiments; higher loads caused the fluid thickness in the computational model to approach zero, stopping the simulation. The experimental data lie close to the line extrapolated from the computational data, suggesting consistency of results of the two studies.
Figure 12.
Comparison of experimental and computational coefficients of friction μ as a function of pressure loading P at ω=2 rad/s. Each series of the experimental data, remarked by a legend corresponds to one tissue sample.
5. Conclusions
This study indicates that deformation of soft solids caused by hydrodynamic pressure generates a positive net pressure profile, which is load-supporting. The fact that the frictional shear torque does not show a strong dependence on Fn, while the fluid thickness gets thinner under a higher Fn, suggests that the deformation in elastohydrodynamic lubrication enhances the load supporting characteristics of the solid-fluid interface. The results also show smoothing of the tissue surface under rotational sliding. This result is in qualitative agreement with the results presented by Gouldstone et al. [4] for a 2D model, in which they showed that sliding reduces the unevenness on the tissue surface. The major difference between 2D and 3D models is the presence of the radial component of fluid velocity in 3D which allows the flow to communicate in and out of the circumferential boundary as shown in Figure 7. Since 2D fluid flow does not have this additional degree of freedom, it causes drastic solid deformation resulting in significantly larger estimates of the load-supporting capacity [9].
Finally, our study shows that friction coefficient decreases for lower values of E, suggesting that softer materials are better able to support loads in elastohydrodynamic lubrication.
Acknowledgments
This research was supported by grant HL 63737 from the National Institutes of Health.
Footnotes
Publisher's Disclaimer: This is a PDF file of an unedited manuscript that has been accepted for publication. As a service to our customers we are providing this early version of the manuscript. The manuscript will undergo copyediting, typesetting, and review of the resulting proof before it is published in its final citable form. Please note that during the production process errors may be discovered which could affect the content, and all legal disclaimers that apply to the journal pertain.
ADINA is a comprehensive finite element software for extensive analyses of solid, fluid, and fluid flow with structural interactions: www.adina.com. The capabilities of ADINA, particularly for fluid flows with structural interactions, are well addressed in [11].
Poroelastic material is material saturated with fluid that exhibits relative motion as the solid deforms [6].
Fluid Structure Interactions
References
- [1].Agostoni E, D’Angelo E. Pleural Liquid Pressure. The American Physiological Society. 1991 [Google Scholar]
- [2].Lai-Fook SJ. Pleural Mechanics and Fluid Exchange. The American Physiological Society. 2004 doi: 10.1152/physrev.00026.2003. [DOI] [PubMed] [Google Scholar]
- [3].Lai J, Gouldstone A, Butler JP, Federspiel W, Loring SH. Relative Motion of Lung and Chest Wall Promotes Uniform Pleural Space Thickness. Resp. Physiol. Neurobiol. 2002;131:233–243. doi: 10.1016/s1569-9048(02)00091-5. [DOI] [PubMed] [Google Scholar]
- [4].Gouldstone A, Brown RE, Butler JP, Loring SH. Elastohydrodynamic Separation of Pleural Surfaces During Breathing. Respir. Physiol. Neurobiol. 2003;137:97–106. doi: 10.1016/s1569-9048(03)00138-1. [DOI] [PubMed] [Google Scholar]
- [5].Jin ZM, Dowson D. Elastohydrodynamic Lubrication in Biological Systems. Proc. ImechE, Vol. 219 part J: J. of Engineering Tribology. 2005 [Google Scholar]
- [6].Konofagou EE, Harrigan TP, Ophir J, Krouskop TA. Poroelasography: Imaging the Poroelastic Properties of Tissues. Ultrasound in Med. Abd Biol. 2001;27(10):1387–1397. doi: 10.1016/s0301-5629(01)00433-1. [DOI] [PubMed] [Google Scholar]
- [7].Yiping H, Darong C, Xianmei K, Jiadao W. Model of Fluid-Structure Interaction and Its Application to Elastohydrodynamic Lubrication. Computer Methods in Applied Mechanics and Engineering. 2002;191:4231–4240. [Google Scholar]
- [8].Theory and Modeling Guides Volume III: ADINA-F. ADINA R& D Inc; USA: 2001. [Google Scholar]
- [9].Hamrock BJ. Fundamentals of Fluid Film Lubrication. McGraw-Hill, Inc; 1994. [Google Scholar]
- [10].Loring SH, Brown RE, Gouldstone A, Butler JP. Lubrication Regimes in Mesothelial Sliding. J. Biomech. 2005;38:2390–2396. doi: 10.1016/j.jbiomech.2004.10.012. [DOI] [PubMed] [Google Scholar]
- [11].Bathe KJ, Zhang H. Finite Element Developments for General Fluid Flows with Structural Interactions. Int. Journal for Numerical Methods in Engineering. 2004;60:213–232. [Google Scholar]


