

Abstract
The phenotypic effect of prions on host cells is influenced by the physical properties of the prion strain and its level of accumulation. In mammalian cell cultures, prion accumulation is determined by the interplay between de novo prion formation, catabolism, cell division, and horizontal cell-to-cell transmission. Understanding this dynamic enables the analytical modeling of protein-based heritability and infectivity. Here, we quantitatively measured these competing effects in a subline of neuroblastoma (N2a) cells and propose a concordant reaction mechanism to explain the kinetics of prion propagation. Our results show that cell division leads to a predictable reduction in steady-state prion levels but not to complete clearance. Scrapie-infected N2a cells were capable of accumulating different steady-state levels of prions, dictated partly by the rate of cell division. We also show that prions in this subline of N2a cells are transmitted primarily from mother to daughter cells, rather than horizontal cell-to-cell transmission. We quantitatively modeled our kinetic results based on a mechanism that assumes a subpopulation of prions is capable of self-catalysis, and the levels of this subpopulation reach saturation in fully infected cells. Our results suggest that the apparent effectiveness of antiprion compounds in culture may be strongly influenced by the growth phase of the target cells.
Keywords: kinetics, neuroblastoma, prion propagation, limited conversion model, steady state
Prion diseases belong to a class of protein-conformation neurodegenerative disorders that include Alzheimer's, Parkinson's, and Huntington's diseases (1). These diseases are uniformly fatal after a period of neurodegeneration, clinically characterized by dementia and motor dysfunction. The unifying pathological mechanism of neurodegenerative proteinopathies is the misfolding and aggregation of normally benign soluble proteins. Prion diseases result from the misfolding of the α-helix-rich cellular prion protein, termed PrPC, into the β-sheet-rich disease-causing infectious isoform, termed PrPSc (2–4). PrPC and PrPSc are characterized by their differing aggregation properties, resistance to proteolysis, and ability to become solubilized in detergents (5, 6). PrPC is composed of a single stable monomeric conformation, whereas PrPSc is a composite of a large number of alternatively folded multimeric conformations (7). The conversion of PrPC to PrPSc can occur spontaneously, facilitated by the presence of specific autosomally dominant genetic mutations on the PrP gene (PRNP) (8, 9) or stimulated by the presence of exogenous PrPSc (1). The latter occurs because PrPSc is able to catalyze its own creation in a chain reaction that utilizes natural PrPC as substrate (10). The ability of PrP to fold into multiple metastable self-seeding conformations facilitates two protein-based functionalities previously thought to require the involvement of nucleic acid-based genetic elements: infectivity and heritability. These two properties of mammalian PrP can be recapitulated in cell culture. Exposing specific cell lines to brain homogenates from infected animals results in the de novo formation of intracellular PrPSc. Subsequently, infected cells retain stable levels of PrPSc upon repetitive subpassage (11).
Prion-infected cell lines are convenient experimental systems for analyzing the molecular and cellular mechanisms of prion formation as well as for identifying and assaying potential antiprion therapeutics. However, prion propagation in cell culture differs fundamentally from the natural course of infection in vivo within the central nervous system, in that the accumulation of PrPSc occurs in continually dividing cells rather than postmitotic neurons. Cell division enables the passage of infectivity from generation to generation but also constantly dilutes the amount of PrPSc per cell by a factor of two after each division cycle (12). The extent of prion accumulation and propagation in culture is influenced not only by the processes of PrPSc formation, PrPSc degradation, and cross-infection, but also cell division and growth. Understanding these dynamics is imperative when extrapolating cell-based experimental findings to in vivo disease progression. Here, we present a quantitative analysis of these competing effects in prion-infected neuroblastoma (ScN2a) cells and present an analytical model to explain our observations.
Results
Cell Division Affects PrPSc but Not PrPC Levels.
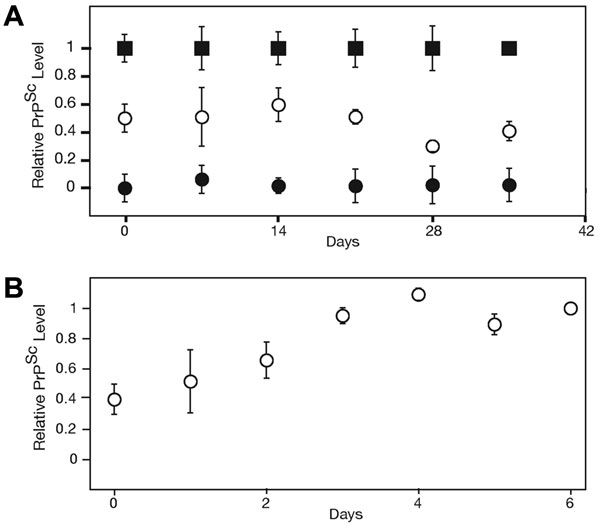
To gain insight into the influence of cell division on prion propagation, we monitored the levels of protease-resistant PrPSc in ScN2a culture as cells progressed from a logarithmic growth to a stationary growth phase. PrPSc levels, normalized to the total number of cells, were determined by using a sandwich ELISA after proteolytic digestion with proteinase K [PK; supporting information (SI) Fig. 5]. This protocol enabled the rapid quantitative measurement of PrPSc levels from multiple samples corresponding to different timepoints in a single passage. When infected cells were induced to divide by diluting a confluent culture onto a fresh plate (1:10 split), the levels of PrPSc per cell fell rapidly in the first 3 days (Fig. 1 A–C). As the culture approached confluency and the cell division rate decreased, the amount of PrPSc per cell recovered to its initial levels. Once the cells reached confluency, nondividing cells maintained a steady-state level of PrPSc over a course of 3–4 days before requiring passaging. Changes in the growth phase did not influence PrPC levels in uninfected N2a cells (Fig. 1D). Furthermore, the total PrP level in ScN2a cells, which is composed of >90% PrPC, was not dramatically influenced by the growth rate (data not shown). These results indicate that cell division strongly influences the accumulation of PrPSc but not levels of PrPC.
Fig. 1.

Cell division decreases the intracellular accumulation of PrPSc but not PrPC. (A) Growth curve for ScN2a cells after a 1:10 split in 100-mm plates. (B–D) The change in the accumulation of PrPSc in ScN2a (B and C) and PrPC in N2a (D) as cells progress from a logarithmic growth phase to stationary phase, as detected by Western blot (B) and ELISA (C and D). After lysis, all samples were normalized to 1 mg/ml total protein concentration as determined by the BCA assay (Pierce) before further processing. The plotted ELISA measurements were normalized to measurements at time 0. The dashed lines indicate the background signal level as determined by plating a mock PBS + 1% BSA sample. The error bars represent standard deviations of three replicate measurements. The solid line in C indicates the predicted PrPSc fluctuation based on the limited conversion model and Eq. 8 (SI Text).
We next asked whether maintaining the infected culture in a perpetual state of cell division would continually reduce the level of PrPSc, leading to its eventual clearance. As before, the ScN2a culture was induced to divide by a 1:10 split onto a fresh plate. Once the cells reached 30% confluency, they were dissociated from the plate and recultured on a fresh plate at 10% confluency (1:3 split). This cycle of subconfluent dissociation, replating, and growth was repeated for five rounds (Fig. 2Inset). Preventing the cells from reaching confluency enabled a continual state of division over the course of 5 days. We found that continually dividing ScN2a cells accumulate ≈60% less PrPSc than nondividing ScN2a cells (Fig. 2). The decreased PrPSc load appeared to be a stable state and persisted for the length of the experiment (5 days). Continual cell division did not result in complete clearance of PrPSc. Both dividing and nondividing cells seem able to maintain PrPSc stably, albeit at different steady-state levels. The change in PrPSc levels, induced by cell division, occurs rapidly, and a new steady-state level is reached within 1–2 days after the induction of growth.
Fig. 2.

Dividing cells are able to maintain a reduced steady-state level of PrPSc. ELISA measurements of PrPSc levels were normalized to measurements at time 0. The dashed line indicates a background signal from mock PBS + 1% BSA. The solid line represents predicted PrPSc levels according to the limited conversion model and Eq. 8 (SI Text). Error bars indicate standard deviations of three replicate measurements. Inset shows the experimental design. ScN2a cells were maintained in a perpetual state of cell division for 5 days by repetitive cycles of subconfluent dissociation and replating (see Materials and Methods). The arrows represent the times of dissociation and replating at the indicated ratios. The predicted cell numbers (relative to a confluent culture) during the course of the experiment are also shown.
The Heterodimer Kinetic Model for Prion Formation in Culture.
The above results and previous studies on the kinetics of prion formation in ScN2a cells (13–15) and yeast (16) suggest that at least three competing factors influence prion accumulation in culture: PrPSc formation, natural catabolic degradation of PrPSc, and cell division. To analytically model the formation of PrPSc as a competition among these processes, we initially considered the following reaction mechanism:
 |
Previous in vitro studies of yeast and mammalian prion formation suggest that kconversion is linearly proportional to both substrate (PrPC) and template (PrPSc) concentrations (14, 16, 17). Also, in cases where it has been studied carefully, protein degradation within the cell typically follows first-order kinetics (18), and the observed logarithmic decay pattern of PrPSc is consistent with this model (14). The process of exponential cell growth can also be modeled as a first-order process where kdivision = ln2/doubling time. Thus, considering kconversion, kdegradation, and kdivision as first-order rate constants, we obtain the following rate equation for the formation of PrPSc:
 |
For the experiments analyzed here, within our ScN2a subclone, PrPC is always present in ScN2a cells in >7-fold excess of PrPSc (data not shown), and its levels remain unchanged regardless of the growth phase (Fig. 1D). Thus, we can consider [PrPC] as a constant and kconversion as a pseudofirst-order rate constant:
 |
where k*conversion = kconversion [PrPC].
From Eq. 3, we can see the only condition that allows us to maintain a positive steady-state level of PrPSc (dPrPSc/dt = 0 and [PrPSc] > 0) is when:
As has been noted (12), according to this simplified model, for a cell to be able to maintain a steady-state level of PrPSc, the inherent pseudofirst-order rate constant for conversion has to equal exactly the sum of rate constants for division and degradation. If individual cells within a culture are homogenous with respect to their rates of conversion and degradation for a particular prion strain, then the culture is able to maintain a steady-state concentration of PrPSc only if it is dividing at one specific division rate. If the net rate constant for prion formation (kconversion − kdegradation) exceeds the rate of cell division, the amount of PrPSc per cell should continually increase over time, eventually surpassing a lethal threshold, leading to cell death. Conversely, if the net rate constant for prion formation is less than the division rate constant, then recurrent propagation should eventually lead to the clearance of PrPSc from the culture. This model predicts an inherently unstable system. Yet, our results show that ScN2a cells can achieve steady-state levels of PrPSc with at least two different rates of cell division: logarithmic growth and stationary phase. This argues for a more complex model of prion formation.
A recent theoretical model of prion propagation, termed the “dynamic susceptibility” model (12), provides a potential solution to the above paradox by suggesting that the infected cell population is a heterogeneous mixture of cells with a range of kconversion and kdegradation values. This idea is supported by the observation that ScN2a sublines differ in their ability to accumulate prions (19). In a heterogeneous culture, infectivity would be stably maintained by the fraction of cells that harbors the appropriate rates of conversion and degradation for the particular growth rate of the culture. Such a heterogeneous culture could maintain steady-state levels of PrPSc at multiple division rates by transferring infectivity within different subpopulations of cells under different growth conditions. Thus, in a nondividing culture, a subpopulation of cells with a net PrPSc formation rate of zero would maintain infectivity, whereas in a dividing culture, a different subpopulation with a net formation rate equaling the division rate would remain stably infected. Our results indicate that a change in steady-state levels of PrPSc, incurred under dividing and nondividing growth phases, can be achieved rapidly, within 1 or 2 days. For the dynamic susceptibility model to provide an explanation for these results, infectivity must be rapidly transferable horizontally among subpopulations of cells.
Cell-to-Cell Infection in ScN2a Cultures.
To assess the rate of horizontal, or cell-to-cell, infection in ScN2a cultures, we performed a coculture experiment. Uninfected N2a cells were stably transfected with the GFP, subsequently cocultured with ScN2a cells at a 1:1 ratio, and plated at 10% confluency. After the culture reached confluency (7 days), FACS was used to separate the mixed culture into GFP-positive and -negative populations (Fig. 3 A and B). The GFP-positive population contained cells that were derived from the initially noninfected lineage. The relative amount of PrPSc in each cell population was analyzed by ELISA (Fig. 3C). Our results indicate that, within the error of our experiment, PrPSc was retained entirely in cells descending from the initially infected ScN2a lineage. Thus, within a single passage (7 days), the extent of horizontal cell-to-cell transfer of infectivity was minimal. A longer-term coculture experiment also failed to show significant levels of cross-infection over the course of 5 weeks (SI Fig. 6). Horizontal, cell-to-cell infection has been observed in other cell-culture systems (20, 21), and the initial establishment of infectivity in ScN2a lines requires susceptibility to exogenous PrPSc (22, 23). However, our quantitative analysis indicates that once infection is established in this specific N2a subline, the rate of cell-to-cell infection is very slow relative to the rate of cell division. In the experiments here, the vast majority of PrPSc found in a given infected N2a cell was either directly inherited or seeded by directly inherited PrPSc (SI Text). The ability of ScN2a cells to achieve different steady-state levels of PrPSc does not depend on the transfer of infectivity between subpopulations of cells. We therefore developed an alternative analytical model to describe the kinetic data observed in Figs. 1 and 2.
Fig. 3.

In ScN2a cultures, the rate of horizontal cell-to-cell infection is slow relative to the rate of cell division. (A) Fluorescence distribution in the following cell lines, as measured by FACS: (1) N2a cells stably transfected with GFP, (2) a 7-day coculture consisting of a 1:1 ratio of ScN2a-N2aGFP cells, and (3) nontransfected ScN2a cells. The dashed line indicates the gate used to separate “high GFP” cells from “low GFP” cells. (B) After FACS, the fluorescence distribution of the sorted coculture shows that “high GFP” subpopulation (2) was successfully separated from “low GFP” subpopulation (1). (C) PrPSc levels of the sorted subpopulations from 1:1 Sc2Na−N2aGFP mixtures, as determined by ELISA. PrPSc levels from sorted subpopulations are similar, whether the ScN2a + N2aGFP mixtures were cultured independently then mixed before FACS analysis (gray bars) or cocultured for 7 days (black bars). These data indicate that cells descending from N2aGFP do not contain levels of PrPSc above the experimental error of the experiment. As controls, PrPSc levels in 100% ScN2a and N2aGFP cultures (white bars) are plotted. The PrPSc signal in the sorted low GFP population is reduced because of the presence of transfected N2a cells with low GFP fluorescence levels (see profile 1 in A). The PrPSc signal seen in the sorted high GFP population is due to cross-contamination and represents the experimental background because of sorting artifacts.
The “Limited Conversion” Model for the Kinetics of Prion Formation in Culture.
We propose the limited conversion model based on the assumption that only a subpopulation of total PrPSc is capable of efficient self-catalysis in the context of ScN2a cells. In this model, we distinguish between the total PrPSc population (PrPtotalSc) and the subpopulation capable of templating further PrPSc formation (PrPinfectiousSc). Our model proposes that at high concentrations of PrPtotalSc, the concentration of PrPinfectiousSc reaches a plateau (Fig. 4). Therefore, a maximum rate of prion conversion exists, which cannot be surpassed even with the additional formation of PrPtotalSc. Three biological observations support this idea:
It has been shown that experimentally characterized protease-resistant PrPSc consists of a heterogeneous population of multimeric species with varying levels of infectivity (7). Recent evidence suggests that within this mixed population, low-molecular-weight oligomers may be the primary infectious species (24, 25). This is consistent with findings that highly aggregated amyloids, formed in later stages of other neurodegenerative diseases, do not play a role in neurodegeneration and may in fact be neuroprotective (26–28). Thus, in fully infected ScN2a cells, a large proportion of protease-resistant PrPtotalSc may be in highly aggregated benign conformations. Accumulation of PrPSc beyond a specific threshold may result in the buildup of aggregated amyloid without further increasing the concentration of the infectious PrPSc species.
Increasing evidence argues that de novo PrPSc formation occurs within specific cholesterol-rich membrane subdomains, called lipid rafts (29). It has been argued that cocompartmentalization of PrPC and PrPSc in lipid rafts is required for the prion amplification process (30, 31). Accordingly, if the total concentration of PrPSc in the culture exceeds the capacity of the lipid rafts, then the compartmentalization of PrPSc becomes limiting, and the rate of prion formation becomes independent of the PrPtotalSc levels in the culture.
Results from numerous studies suggest a role for auxiliary proteins and cofactors in the process of prion formation. First, there is strong neurotropic cell selectivity in prion transmission. The ability of a cell to be infected by prions is not always directly proportional to its level of PrPC expression (10), suggesting that the differential expression of auxiliary factors plays a role in rendering a cell susceptible to prions. Dominant-negative mutations in PrP provide genetic evidence for auxiliary factors in prion conversion (32–34). Previous studies have also identified proteins that physically interact with PrP (35–39). If the accumulated concentration of PrPSc within the cell exceeds the concentration of a required auxiliary protein, the latter becomes rate-limiting, and the conversion rate becomes independent of total PrPSc concentration.
Fig. 4.

Features and predictions of the limited conversion model compared with the simplified heterodimer conversion model. The limited conversion model posits that in fully infected cultures, when the cell accumulates high concentrations of PrPSc, the subpopulation of the PrPSc that is infectious (capable of self-catalysis) reaches saturation levels (Top). This assumption alleviates some of the experimental inconsistencies associated with treating the processes of PrPSc conversion, PrPSc degradation, and cell division as first-order reactions. The model explains the ability of cells in culture to attain stable levels of PrPSc when fully infected (Middle). It also provides an explanation for the ability of cells to achieve different steady-state levels of PrPSc when dividing at different rates (Bottom). In the simulation shown, stationary cells that have achieved a steady-state level of PrPSc are induced to divide at a time indicated by the arrow. In such a scenario, the simplified heterodimer model predicts a complete clearance of PrPSc over time, whereas the limited conversion model predicts a new steady-state level dictated by Eq. 6. The heterodimer model predicts an unstable state when [PrPC] is assumed to remain constant (as has been experimentally shown here). When this constraint is removed, the model is able to predict a stable state.
Thus, in the limited conversion model proposed here, PrPinfectiousSc represents the PrPSc subpopulation whose conformation, localization, and molecular interactions enable it to act as a template for the de novo formation of PrPSc. If we assume that in ScN2a cells, the concentration of PrPinfectiousSc has reached a maximum, then:
 |
In such a scenario, at steady state (d[PrPSc]/dt = 0):
 |
It should be noted that, because [PrPinfectiousSc] is by definition less than [PrPtotalSc], kconversion ≥ kdegradation + kdivision. If this condition is met, the cells are able to reach different steady-state levels of PrPtotalSc, as dictated by Eq. 6.
The limited conversion model can be used to predict quantitatively the fractional drop in steady-state levels of PrPSc as well as changes in PrPSc as a function of time after the induction of cell division (see SI Text). Based on the known rates of cell division and PrPSc degradation, the model predicts that once a steady state has been reached, the level of total PrPSc in dividing cells should be ≈44% of nondividing cells. This prediction matches well with the decrease in PrPSc levels observed (Fig. 2). Furthermore, the model predicts the observed fluctuation of PrPSc levels within the error of our experimental measurements [Figs. 1C and 2 (solid line); SI Text].
Discussion
Our results shed light on several previously unresolved issues regarding prion propagation in culture. In mammals, the accumulation of prions typically occurs in postmitotic nondividing neurons in the CNS. The observation that prions can also be stably propagated in dividing cell lines in culture led to an interesting conceptual paradox (12). Cell division acts as a constant diluting factor, halving the amount of PrPSc per cell at each division cycle. Thus, if the rate of PrPSc formation exceeds the rate of cell division, the amount of PrPSc per cell should continually increase over time, eventually surpassing a threshold that results in massive cell death. Conversely, if the rate of PrPSc formation is less than the division rate, then recurrent propagation should eventually lead to the clearance of PrPSc from the culture. However, neither of these two phenomena is experimentally observed, and infection can be stably propagated in ScN2a cells without significant diminishing of PrPSc levels and with little effect on cell viability. The results and analysis described here provide a possible explanation for this apparent paradox by suggesting that the process of PrPSc self-catalysis in culture is not a limitless exponential chain reaction. We suggest that, in fully infected cells, the levels of the infectious forms of PrPSc reach a maximum plateau, and the rate of prion conversion becomes limited by factors other than the total PrPSc concentration. The limiting circumstances may include the conformational distribution, localization, and/or binding interactions of PrPSc with other factors. The reaction mechanism derived by this limited conversion model is quantitatively consistent with our kinetic measurements of PrPSc accumulation.
Only a few cell lines can propagate prions efficiently, and these lines are susceptible only to a small number of prion strains (11). In general, it has been more difficult to establish infectivity in cell lines compared with animal models. It is likely that the requirements for stable infection in culture are more restrictive than prion propagation in vivo. For example, in culture, it is important that PrPSc accumulation does not affect detrimentally the viability of the cell. It would be difficult to maintain stable levels of PrPSc if infected cells continually removed themselves from the population. In culture, the rates of cell division, degradation, and conversion must result in steady-state PrPSc levels that are above detection limits but yet do not have a significant negative impact on cell viability and growth. Both the biological properties of the cell and the physical characteristics of the prion strain play a role in establishing the rates of conversion and degradation. Therefore, specific combinations of cell types and prion strains are likely required to establish stable infectivity in culture.
Infected cell lines are routinely used to identify antiprion compounds, which has yielded promising drug candidates that reduce PrPSc levels (40). The efficacy of compounds in curing infected cell lines has been assumed to reflect their effectiveness in nondividing neurons. Our results suggest that, for compounds that inhibit prion conversion, the process of cell division may greatly exaggerate the kinetics of PrPSc clearance. In nondividing cells, in which the catabolism of PrPSc is the sole route of clearance, the curing rate is likely to be much slower, mirroring the natural degradation rate of PrPSc. Thus, nondividing stationary cultures may present a more relevant model for assessing the potential effectiveness of antiprion compounds in vivo.
Materials and Methods
Materials.
Sodium deoxycholate, BSA, and Nonidet P-40 were obtained from Sigma–Aldrich (St. Louis, MO). MEM with Earle's salts, PBS without Ca2+ and Mg2+, cell dissociation buffer, and GlutaMAX were purchased from Gibco (Carlsbad, CA). FBS was obtained from HyClone (Logan, UT) and PK from Invitrogen (Carlsbad, CA). Anti-PrP Fab antibody D18 (41) and HRP-conjugated anti-PrP Fab antibody P (42) were prepared as described. 2,2′-Azino-bis(3-ethylbenzthiazoline-6-sulfonic acid was obtained from KPL (Gaithersburg, MD).
ScN2a and N2a Cell Cultures.
For ScN2a cells, N2a cells were infected with Rocky Mountain Laboratory prions and subcloned as described (23). Both ScN2a and N2a cells were maintained at 37°C in 10 ml of MEM supplemented with 10% FBS and 1% GlutaMAX. MEM was refreshed every 2 days for dividing and daily for nondividing cells. Typically, cells were propagated in 100-mm plates to 95% confluence before replating at 10% confluence for further propagation. To measure growth curves, cells were counted daily by using a Cell Counting Kit (Midsci, St. Louis, MO). A 1-ml aliquot of cell suspension (1:10 split) was added to the counting tube and centrifuged at 650 × g for 1 min (GS-6R centrifuge, GH3.8 rotor; Beckman Coulter, Fullerton, CA). The packed cell volume from the cell-counting tube-graduated capillary was read. A volume of 1 μl of cell pellet corresponds to 3.9 × 10⁵ cells, as determined previously with the hemacytometer. Details for the methodology of the coculture experiments can be found in SI Text.
PrPSc Detection Using Western Blots.
Lysates were normalized to 1 mg/ml. To 500 μg of total protein, PK at a 1:50 (wt/wt) ratio was added. The reaction was stopped by the addition of 2 mM PMSF. The digested lysate was spun at 48,000 × g for 1 h at 4°C. The pellet was resuspended in loading buffer, boiled for 5 min, then run on a 15% Tris·HCl gel for Western blot analysis by using D18 as the detection antibody.
Quantifying PrPC and PrPSc Levels Using Capture ELISA.
To quantify levels of PrPC and PrPSc, Fab D18 was treated with 0.1-mg/ml solutions of 0.012 M HCl for 7 min, then diluted in NaH2PO4 buffer, pH 7.5, to 5 μg/ml. Then, 200-μl aliquots of D18 were added to each well of 96-well ELISA plates (Greiner, Monroe, NC). The plates were incubated for 12 h and subsequently saturated in blocking buffer (1× PBS/60 g/liter of sorbitol/0.3 g/liter NaN3/0.5 g/liter of Tween20/2.5 g/liter of BSA) and dried in a dessicator.
Lysates were centrifuged for 3 min at 10,000 × g to remove cell debris, and the total protein concentration was measured in the supernatant by using the bicinchoninic acid assay (BCA; Pierce, Rockford, IL). Aliquots containing 500 μg of total protein were titrated by adding lysis buffer to achieve a final protein concentration of 1 mg/ml.
For ScN2a cell lysates, samples were digested with 10 μl of 1 mg/ml PK for 1 h at 37°C. The enzyme:protein ratio was 1:50 (wt:wt). PK activity was quenched by adding 10 μl of 100 mM PMSF to achieve a final concentration of 2 mM. Lysates were diluted with 8 M guanidine (Gdn) (Pierce) in a 1:1 ratio and heated to 85°C for 15 min. On cooling to room temperature, 30 μl of denatured lysates was added to a D18-coated 96-well ELISA plate containing 270 μl of 1% BSA in PBS per well. For N2a cells, lysates was diluted with 8 M Gdn (Pierce) in a 1:1 ratio and heated to 85°C for 15 min. On cooling to room temperature, 10 μl of denatured lysates was added to a D18-coated 96-well ELISA plate containing 290 μl of 1% BSA in PBS per well.
After incubations at 4°C for 16 h, ELISA plates were washed three times with 10 mM Tris·HCl, pH 8.0/150 mM NaCl/0.5% Tween-20 (TBST). To each well, 100 μl of HRP-conjugated Fab P (1:20,000 dilution from 4.3 mg/ml stock) was added and incubated for 1 h at 37°C. Plates were washed seven times with TBST, filled with 100 μl per well of 2,2′-azino-bis(3-ethylbenzthiazoline-6-sulfonic acid, and developed for 15–20 min. Absorbance at 405 nm was read by using a SpectraMax Plus microplate reader running SoftMaxPro (Molecular Devices, Sunnyvale, CA). All readings were converted to PrP concentration by comparison to a standard concentration ladder composed of varying concentrations of purified recombinant PrP, mouse sequence 89–230. Before plotting, all concentration measurements were normalized to a reference well in the plate as indicated in Results.
Supplementary Material
Acknowledgments
We thank Ed Choi for his assistance with FACS. This work was supported by National Institutes of Health Grants AG02132, AG10770, and AG021601 and by a gift from the G. Harold and Leila Y. Mathers Charitable Foundation. P.-W.P. was supported by a postdoctoral fellowship from the John Douglas French Alzheimer's Foundation.
Abbreviations
- N2a
neuroblastoma
- PK
proteinase K
- PrP
prion protein
- PrPC
cellular PrP isoform
- PrPSc
disease-causing PrP isoform
- ScN2a
prion-infected neuroblastoma.
Footnotes
Conflict of interest statement: B.C.H.M., F.E.C., and S.B.P. have a financial interest in InPro Biotechnology, Inc.
This article contains supporting information online at www.pnas.org/cgi/content/full/0708372104/DC1.
References
- 1.Prusiner SB. N Engl J Med. 2001;344:1516–1526. doi: 10.1056/NEJM200105173442006. [DOI] [PubMed] [Google Scholar]
- 2.Basler K, Oesch B, Scott M, Westaway D, Wälchli M, Groth DF, McKinley MP, Prusiner SB, Weissmann C. Cell. 1986;46:417–428. doi: 10.1016/0092-8674(86)90662-8. [DOI] [PubMed] [Google Scholar]
- 3.Pan YT, Hori H, Saul R, Sanford BA, Molyneux RJ, Elbein AD. Biochemistry. 1983;22:3975–3984. doi: 10.1021/bi00285a038. [DOI] [PubMed] [Google Scholar]
- 4.Prusiner SB. Annu Rev Med. 1987;38:381–398. doi: 10.1146/annurev.me.38.020187.002121. [DOI] [PubMed] [Google Scholar]
- 5.Prusiner SB. Proc Natl Acad Sci USA. 1998;95:13363–13383. doi: 10.1073/pnas.95.23.13363. [DOI] [PMC free article] [PubMed] [Google Scholar]
- 6.Tzaban S, Friedlander G, Schonberger O, Horonchik L, Yedidia Y, Shaked G, Gabizon R, Taraboulos A. Biochemistry. 2002;41:12868–12875. doi: 10.1021/bi025958g. [DOI] [PubMed] [Google Scholar]
- 7.Legname G, Nguyen H-OB, Peretz D, Cohen FE, DeArmond SJ, Prusiner SB. Proc Natl Acad Sci USA. 2006;103:19105–19110. doi: 10.1073/pnas.0608970103. [DOI] [PMC free article] [PubMed] [Google Scholar]
- 8.Hsiao K, Baker HF, Crow TJ, Poulter M, Owen F, Terwilliger JD, Westaway D, Ott J, Prusiner SB. Nature. 1989;338:342–345. doi: 10.1038/338342a0. [DOI] [PubMed] [Google Scholar]
- 9.Prusiner SB, Scott MR. Annu Rev Genet. 1997;31:139–175. doi: 10.1146/annurev.genet.31.1.139. [DOI] [PubMed] [Google Scholar]
- 10.Prusiner SB. Science. 1991;252:1515–1522. doi: 10.1126/science.1675487. [DOI] [PubMed] [Google Scholar]
- 11.Solassol J, Crozet C, Lehmann S. Br Med Bull. 2003;66:87–97. doi: 10.1093/bmb/66.1.87. [DOI] [PubMed] [Google Scholar]
- 12.Weissmann C. Nat Rev Microbiol. 2004;2:861–871. doi: 10.1038/nrmicro1025. [DOI] [PubMed] [Google Scholar]
- 13.Borchelt DR, Rogers M, Stahl N, Telling G, Prusiner SB. Glycobiology. 1993;3:319–329. doi: 10.1093/glycob/3.4.319. [DOI] [PubMed] [Google Scholar]
- 14.Borchelt DR, Scott M, Taraboulos A, Stahl N, Prusiner SB. J Cell Biol. 1990;110:743–752. doi: 10.1083/jcb.110.3.743. [DOI] [PMC free article] [PubMed] [Google Scholar]
- 15.Caughey B, Raymond GJ. J Biol Chem. 1991;266:18217–18223. [PubMed] [Google Scholar]
- 16.Tanaka M, Collins SR, Toyama BH, Weissman JS. Nature. 2006;442:585–589. doi: 10.1038/nature04922. [DOI] [PubMed] [Google Scholar]
- 17.Collins SR, Douglass A, Vale RD, Weissman JS. PLoS Biol. 2004;2:e321. doi: 10.1371/journal.pbio.0020321. [DOI] [PMC free article] [PubMed] [Google Scholar]
- 18.Goldberg AL, Dice JF. Annu Rev Biochem. 1974;43:835–869. doi: 10.1146/annurev.bi.43.070174.004155. [DOI] [PubMed] [Google Scholar]
- 19.Bosque PJ, Prusiner SB. J Virol. 2000;74:4377–4386. doi: 10.1128/jvi.74.9.4377-4386.2000. [DOI] [PMC free article] [PubMed] [Google Scholar]
- 20.Kanu N, Imokawa Y, Drechsel DN, Williamson RA, Birkett CR, Bostock CJ, Brockes JP. Curr Biol. 2002;12:523–530. doi: 10.1016/s0960-9822(02)00722-4. [DOI] [PubMed] [Google Scholar]
- 21.Paquet S, Langevin C, Chapuis J, Jackson GS, Laude H, Vilette D. J Gen Virol. 2007;88:706–713. doi: 10.1099/vir.0.82336-0. [DOI] [PubMed] [Google Scholar]
- 22.Race RE, Fadness LH, Chesebro B. J Gen Virol. 1987;68:1391–1399. doi: 10.1099/0022-1317-68-5-1391. [DOI] [PubMed] [Google Scholar]
- 23.Butler DA, Scott MR, Bockman JM, Borchelt DR, Taraboulos A, Hsiao KK, Kingsbury DT, Prusiner SB. J Virol. 1988;62:1558–1564. doi: 10.1128/jvi.62.5.1558-1564.1988. [DOI] [PMC free article] [PubMed] [Google Scholar]
- 24.Silveira JR, Raymond GJ, Hughson AG, Race RE, Sim VL, Hayes SF, Caughey B. Nature. 2005;437:257–261. doi: 10.1038/nature03989. [DOI] [PMC free article] [PubMed] [Google Scholar]
- 25.Mallucci GR, White MD, Farmer M, Dickinson A, Khatun H, Powell AD, Brandner S, Jefferys JG, Collinge J. Neuron. 2007;53:325–335. doi: 10.1016/j.neuron.2007.01.005. [DOI] [PubMed] [Google Scholar]
- 26.Arrasate M, Mitra S, Schweitzer ES, Segal MR, Finkbeiner S. Nature. 2004;431:805–810. doi: 10.1038/nature02998. [DOI] [PubMed] [Google Scholar]
- 27.Dodart JC, Bales KR, Gannon KS, Greene SJ, DeMattos RB, Mathis C, DeLong CA, Wu S, Wu X, Holtzman DM, Paul SM. Nat Neurosci. 2002;5:452–457. doi: 10.1038/nn842. [DOI] [PubMed] [Google Scholar]
- 28.Chesebro B, Trifilo M, Race R, Meade-White K, Teng C, LaCasse R, Raymond L, Favara C, Baron G, Priola S, et al. Science. 2005;308:1435–1439. doi: 10.1126/science.1110837. [DOI] [PubMed] [Google Scholar]
- 29.Taraboulos A, Raeber AJ, Borchelt DR, Serban D, Prusiner SB. Mol Biol Cell. 1992;3:851–863. doi: 10.1091/mbc.3.8.851. [DOI] [PMC free article] [PubMed] [Google Scholar]
- 30.Gorodinsky A, Harris DA. J Cell Biol. 1995;129:619–627. doi: 10.1083/jcb.129.3.619. [DOI] [PMC free article] [PubMed] [Google Scholar]
- 31.Taraboulos A, Scott M, Semenov A, Avrahami D, Laszlo L, Prusiner SB. J Cell Biol. 1995;129:121–132. doi: 10.1083/jcb.129.1.121. [DOI] [PMC free article] [PubMed] [Google Scholar]
- 32.Kaneko K, Zulianello L, Scott M, Cooper CM, Wallace AC, James TL, Cohen FE, Prusiner SB. Proc Natl Acad Sci USA. 1997;94:10069–10074. doi: 10.1073/pnas.94.19.10069. [DOI] [PMC free article] [PubMed] [Google Scholar]
- 33.Telling GC, Scott M, Mastrianni J, Gabizon R, Torchia M, Cohen FE, DeArmond SJ, Prusiner SB. Cell. 1995;83:79–90. doi: 10.1016/0092-8674(95)90236-8. [DOI] [PubMed] [Google Scholar]
- 34.Perrier V, Kaneko K, Safar J, Vergara J, Tremblay P, DeArmond SJ, Cohen FE, Prusiner SB, Wallace AC. Proc Natl Acad Sci USA. 2002;99:13079–13084. doi: 10.1073/pnas.182425299. [DOI] [PMC free article] [PubMed] [Google Scholar]
- 35.Edenhofer F, Rieger R, Famulok M, Wendler W, Weiss S, Winnacker E-L. J Virol. 1996;70:4724–4728. doi: 10.1128/jvi.70.7.4724-4728.1996. [DOI] [PMC free article] [PubMed] [Google Scholar]
- 36.Fischer MB, Roeckl C, Parizek P, Schwarz HP, Aguzzi A. Nature. 2000;408:479–483. doi: 10.1038/35044100. [DOI] [PubMed] [Google Scholar]
- 37.Graner E, Mercadante AF, Zanata SM, Forlenza OV, Cabral ALB, Veiga SS, Juliano MA, Roesler R, Walz R, Mineti A, et al. Mol Brain Res. 2000;76:85–92. doi: 10.1016/s0169-328x(99)00334-4. [DOI] [PubMed] [Google Scholar]
- 38.Kurschner C, Morgan JI. Mol Brain Res. 1995;30:165–168. doi: 10.1016/0169-328x(95)00013-i. [DOI] [PubMed] [Google Scholar]
- 39.Schmitt-Ulms G, Legname G, Baldwin MA, Ball HL, Bradon N, Bosque PJ, Crossin KL, Edelman GM, DeArmond SJ, et al. J Mol Biol. 2001;314:1209–1225. doi: 10.1006/jmbi.2000.5183. [DOI] [PubMed] [Google Scholar]
- 40.Trevitt CR, Collinge J. Brain. 2006;129:2241–2265. doi: 10.1093/brain/awl150. [DOI] [PubMed] [Google Scholar]
- 41.Williamson RA, Peretz D, Pinilla C, Ball H, Bastidas RB, Rozenshteyn R, Houghten RA, Prusiner SB, Burton DR. J Virol. 1998;72:9413–9418. doi: 10.1128/jvi.72.11.9413-9418.1998. [DOI] [PMC free article] [PubMed] [Google Scholar]
- 42.Safar JG, Scott M, Monaghan J, Deering C, Didorenko S, Vergara J, Ball H, Legname G, Leclerc E, Solforosi L, et al. Nat Biotechnol. 2002;20:1147–1150. doi: 10.1038/nbt748. [DOI] [PubMed] [Google Scholar]
Associated Data
This section collects any data citations, data availability statements, or supplementary materials included in this article.