Abstract
The latitudinal diversity gradient (LDG), wherein the number of species and higher taxa peaks in the tropics and decreases toward the poles, is the best-documented large-scale diversity pattern on Earth, but hypotheses explaining the standard LDG must also account for rare “contrarian” taxa that show diversity maxima outside of the tropics. For marine bivalves, one of the few groups that provide spatially explicit temporal data on a global scale, we show that a major contrarian group, the Anomalodesmata, unexpectedly exhibits the same large-scale dynamics as related clades having normal LDGs in two key respects. First, maxima in standing genus diversity and genus origination rates coincide spatially. Second, the strength of a clade's present-day LDG is significantly related to the proportion of its living genera that originated in the tropics during the late Cenozoic, with the contrarian gradient strength at both species and genus level predicted quantitatively by the values for the other clades. Geologic age distributions indicate that the anomalous LDG results from origination that is damped in the tropics rather than heightened in the temperate zones. The pervasive role of spatial origination patterns in shaping LDGs, regardless of the position of their diversity maxima, corroborates hypotheses based on clades showing standard gradients and underscores the insights that contrarian groups can provide into general principles of diversity dynamics.
Keywords: bivalves, biodiversity, Anomalodesmata, tropics, extinction
Exceptions to the rule are a valuable challenge to theory, as they often represent a severing of covariation among potentially confounding variables. One of the most pervasive and best-documented large-scale biotic patterns on Earth is the latitudinal diversity gradient (LDG), wherein the number of species and higher taxa peaks in the tropics and decreases toward the poles (1–6). Known for a wide range of marine and terrestrial taxa (7) and from several intervals in the geologic past (8), the LDG has a attracted a multitude of explanations derived from a wide variety of scientific disciplines (9–12). Virtually all of this work has focused on groups showing standard LDGs, with many potential controlling variables inevitably correlated with latitude and therefore with one another. However, the relatively small subset of taxa showing weak or even reversed gradients (7, 10, 13–16) relative to the standard LDG must also be accounted for in any theory of the formation of the global LDG. Here, we take advantage of the well sampled biogeography and rich fossil record of shallow-water marine bivalves to test evolutionary models for the LDG by using a major contrarian order, the Anomalodesmata. By comparing its evolutionary dynamics to five related orders showing variations of the standard LDGs, from the strong gradient of the veneroids [the dominant component of the sister group to Anomalodesmata; supporting information (SI) Fig. 7] to the weak gradient of the carditoids, we show that spatial patterns of origination govern not only the dynamics of the normal-LDG clades, but of the contrarian group as well. The rich bivalve fossil record further allows us to decompose differential diversification rates across latitude, and we find that the anomalous LDG is shaped by origination that is damped in the tropics rather than heightened in the temperate zones. Therefore, other evolutionary processes, including extinction and range expansion, play subordinate roles in the formation of bivalve LDGs.
Results
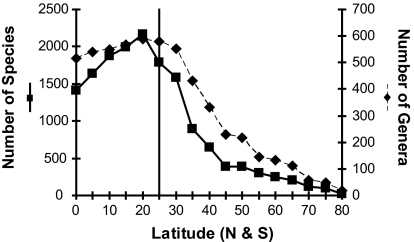
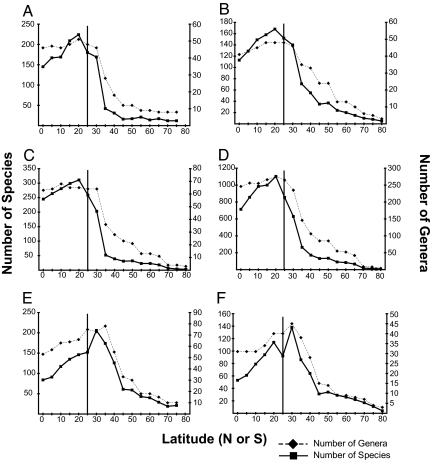
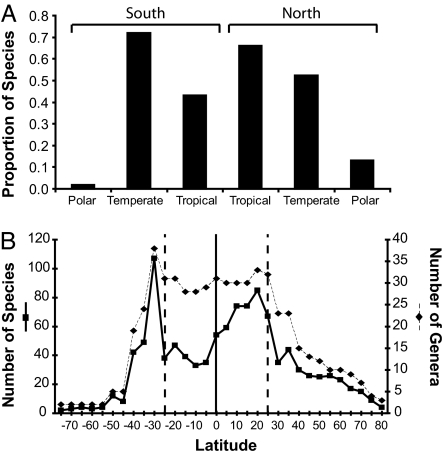
Marine bivalves have an LDG that peaks at ≈20° and declines toward high latitudes (Fig. 1). This asymmetry, with maximum diversity in the tropics but offset from the equator to ≈20 N, is poorly understood but probably reflects a combination of sampling, climatic, and oceanographic effects (14). Four bivalve orders, the veneroids, arcoids, mytiloids, and pteriomorphs, each show variations of the standard bivalve LDG, with peak diversities at low latitudes, whether diversity is plotted against absolute latitude (Fig. 2 A–D) or binned by climatic zones (SI Fig. 8 A–D). In contrast, the anomalodesmatan diversity maxima falls outside the tropics at 35° (Fig. 2E), and the majority of anomalodesmatan diversity is located in temperate zones (SI Fig. 8E). The tropical-temperate diversity increase of the anomalodesmatans differs significantly from the downward trend shown by the closely related Veneroida (log-likelihood ratio test, P < 0.001; see Methods). For all orders, species and genus-level diversity are well correlated, but the number of species declines from peak values more rapidly than does the number of genera. This pattern indicates that species-diversity peaks also represent maximum species–genus ratios, suggesting that speciation rates are highest at latitudes where diversity is greatest.
Fig. 1.
LDG for continental shelf marine bivalves, plotted as absolute latitude (degrees north or south). Species and genus curves are shown on separate y axes. Vertical line marks 25°, the general position of the tropical–temperate boundary (although this boundary varies significantly among oceans).
Fig. 2.
LDG for individual bivalve orders, plotted as absolute latitude (degrees north or south). (A) Arcoida. (B) Mytiloida. (C) Pteriomorphia. (D) Veneroida. (E) Anomalodesmata. (F) Carditoida. Species and genus curves are shown on separate y axes. Vertical line marks 25°, the general position of the tropical–temperate boundary (although this boundary varies significantly among oceans).
Among-order differences in latitudinal gradients might be generated by major historical events, such as the end-Cretaceous (K-T) mass extinction 65 million years (Myr) ago, which removed ≈50% of bivalve genera. For example, the Order Trigonioida evidently had a normal LDG during the Mesozoic, but was reduced to a single essentially extratropical marine genus at the K-T boundary and has maintained this distribution since (17). However, the K-T extinction intensity of Anomalodesmata was similar to those of the other orders (SI Fig. 9), and overall intensities did not vary significantly with latitude (18). Therefore the disparate diversity patterns were not shaped by the K-T event but more likely arose via, or were at least maintained by, Cenozoic diversification dynamics.
Clade age or phylogenetic position also is not a significant determinant of gradient steepness [in contrast to birds (19, 20)]. The steepness of LDGs (see Methods) is not significantly related to the geologic age of each order (SI Fig. 10A), or to the ordinal root distance (19–21), the number of nodes separating an order from the base of the bivalve phylogenetic tree (SI Fig. 10B). By either metric, the contrarian clade is bracketed by clades showing standard LDGs.
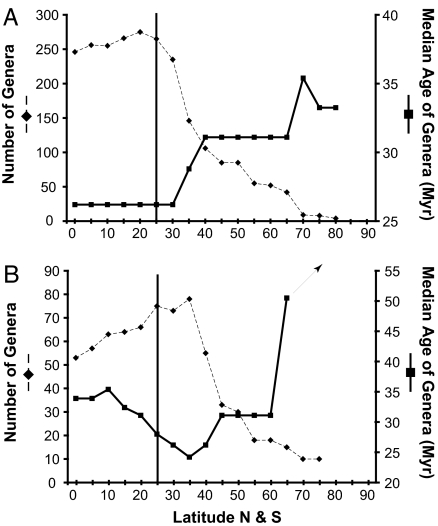
All orders, regardless of the geometry of their LDGs, show a strong, significant negative correlation between the median age of constituent genera and diversity (both number of species and number of genera) across latitudes (Table 1). Orders showing strong LDGs have significantly younger median ages in tropical regions than in polar regions, taken together [26 Myr vs. 38 Myr, respectively (11)] or individually, although statistical significance occurs only at sample sizes >10 polar genera. For strong-LDG orders such as Veneroida (the major component of the sister clade to our contrarian group), the minimum genus age coincides with tropical diversity maxima at 20° (median age at 20° is 26 Myr; median age at 35° is 29 Myr, median age at 45° is 31 Myr; Fig. 3A).
Table 1.
Significant inverse correlations between bivalve species and genus richness and the age of genera within 5° latitudinal bands from Antarctica to the Arctic Ocean
| Order | Species |
Genera |
||||
|---|---|---|---|---|---|---|
| R | R2 | P | R | R2 | P | |
| Anomalodesmata | −0.7032 | 0.4946 | 1.021 e−5 | −0.7224 | 0.5219 | 4.461 e−6 |
| Arcoida | −0.7836 | 0.6298 | 1.004 e−7 | −0.8087 | 0.6526 | 3.937 e−8 |
| Carditoida | −0.6168 | 0.3804 | 0.00017 | −0.6769 | 0.4582 | 2.1 e−5 |
| Veneroida | −0.7584 | 0.5753 | 4.557 e−6 | −0.835 | 0.6972 | 6.093 e−8 |
| Mytiloida | −0.5597 | 0.3133 | 0.002 | −0.6675 | 0.4456 | 0.0001 |
| Pteriomorphia | −0.8452 | 0.7143 | 2.908 e−8 | −0.8393 | 0.7044 | 4.482 e−8 |
Statistical significance evaluated by Pearson product-moment correlation coefficients; all relationships remain significant after sequential Bonferroni corrections (51).
Fig. 3.
Median ages of genera (right vertical axis) and genus richness (left vertical axis) within 5° latitudinal bands for Veneroida (A) and Anomalodesmata (B). Veneroids exemplify strong-LDG orders, having young ages associated with diversity peaks in the tropics, and heavily dominate the sister group to Anomalodesmata (see SI Fig. 7). Anomalodesmatans also have young genus ages coincident with diversity peaks, but those peaks occur in temperate latitudes. Arrow indicates that anomalodesmatan ages continue to increase (to 88 Myr) into polar latitudes. Vertical line marks 25°, the general position of the tropical–temperate boundary (although this boundary varies significantly among oceans).
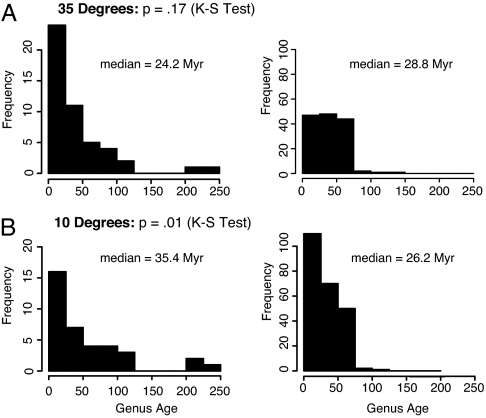
In anomalodesmatans, geologic age minima are clearly outside the tropics, associated with their temperate-zone diversity maxima at 35° (median age at 20° is 35 Myr, median age at 35° is 22 Myr, median age at 45° is 31 Myr; Fig. 3B). The age-frequency distributions of anomalodesmatans are statistically indistinguishable from those of Veneroida in the temperate zones (Kolmogorov-Smirnov test, P = 0.17; Fig. 4A), but are significantly older in the tropics (Kolmogorov–Smirnov test, P = 0.01; Fig. 4B).
Fig. 4.
Geologic age-frequency distributions of genera for the Anomalodesmata (Left) and Veneroida (Right) at 35° (A) and 10° (B) of latitude (N and S combined).
A weak-LDG order, Carditoida, shows a tropical peak in the Northern hemisphere and a temperate peak in the Southern hemisphere (Fig. 5); the latter is caused by the diversification of the minute Condylocardiidae around Australia (22). Because the hemispheres show contradicting patterns and the gradient strength of Carditoida (genus gradient strength = 0.6; species gradient strength = 0.5) stands between normal and contrarian LDG orders, we consider this LDG as weak rather than contrarian. Nevertheless, in every respect Carditoida conforms to the principal controls on latitudinal diversity reported here for both normal and contrarian clades, supports our general conclusions, and is included in all figures and tables, but is not discussed separately.
Fig. 5.
Carditoid latitudinal diversity gradients. (A) Proportion of carditoid species binned by climate zones in separate hemispheres. (B) Carditoid species- and genus-level LDG binned by 5° latitudinal bins. Proportions are calculated as the proportion of species within each hemisphere existing in each climatic bin. Because species can exist in multiple climatic bins, the sums of the proportions in each hemisphere do not sum to 1. Note that the peak genus and species diversities in the Northern hemisphere are located within tropical latitudes, whereas the temperate peak in southern latitudes is influenced by diversifications in Australia.
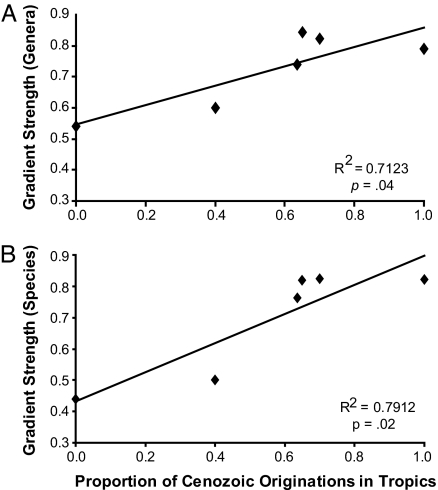
The strength of the LDG for the bivalve orders analyzed here is significantly correlated with the proportion of living genera first occurring in the tropics over the last 11 Myr (Fig. 6). All orders with standard LDGs had at least 69% of their late Cenozoic originations in tropical localities. Anomalodesmata had no tropical first appearances of living genera, but its position on the vertical axis is predicted by the gradient-origination relationship defined by the other orders separately, for both genus-level (Fig. 6A) and species-level (Fig. 6B) gradients (the linear correlation, which retains r2 values of 0.41 and 0.59 for genera and species, respectively, loses significance when Anomalodesmata is excluded because of low statistical power). In contrast to the normal-gradient clades, range expansion from tropical to temperate regions appears not to have been a major determinant of the anomalodesmatan LDG. Only one extinct anomalodesmatan genus originated in the tropics during this time interval (as opposed to at least six now-extinct tropical origins in the related Veneroida), and this taxon did not escape the tropics before its demise. Thus there is no suggestion that the young temperate-zone ages for Anomalodesmata were generated by immigration of young taxa that started in, but abandoned, the tropics. Even if all five of the Anomalodesmatan genera that first appeared over the past 10 Myr and now occur in the tropics actually originated there, they would constitute only 20% of the total number of extant taxa appearing in this clade over that interval.
Fig. 6.
Relation between the proportion of tropical genus originations during the late Cenozoic and the shape of the genus-level (A) and species-level (B) LDG (see Methods). The gradient of the contrarian Anomalodesmata (point on y axis) is closely predicted by a linear regression for the other five orders independently at both the genus and species levels. For genera, ordinary least-squares (OLS) equation: y = 0.33x + 0.53; reduced major axis (RMA) equation y = 0.39x + 0.50. For species, OLS equation: y = 0.49x + 0.41; RMA equation: y = 0.55x + 0.38. The anomalodesmatan gradient falls within 1 SE of predicted intercepts for both species and genera, for both regression models. Correlation statistics incorporate all six orders.
Discussion
Key aspects of anomalodesmatan evolutionary dynamics are thus concordant with those of standard-LDG orders, suggesting that some basic macroevolutionary rules apply to all LDGs regardless of the location of their diversity peaks. The strong correlation between tropical originations and gradient strength, the concentration of young genera from normal LDG orders in the tropics, and the absence of relatively young tropical ages for the anomalodesmatans, all corroborate views (11, 23) that prolific origination in the tropics is important in shaping the LDG (see ref. 24 on the dynamical interpretation of taxon ages). The latitudinal distribution of genus ages in the Anomalodesmata relative to those in their sister group, similar in the temperate zones but significantly greater in Anomalodesmata in the tropics, suggests that the contrarian LDG arises from damped tropical origination rather than accelerated temperate origination. Their nearly complete lack of tropical originations during the late Cenozoic, unique among the orders analyzed here, is consistent with this result. As with all other clades, anomalodesmatan diversity within latitudinal bands is positively correlated with the age of taxa within that band, the striking difference being that the youngest anomalodesmatan faunas coincide with extratropical diversity peaks. The diversity gradient of this contrarian clade is therefore consistent with normal gradients in that diversity peaks are produced in regions of active diversification (see ref. 23). The nonplanktotrophic mode of development of Anomalodesmata, and of a number of other clades of mollusks and arthropods that show a weak or reversed LDG (25), might account for their failure to diversify in the tropics and for extratropical genera to invade tropical shelves. The overall tendency for this low-dispersal, low-fecundity mode of development to increase in frequency in high latitudes (26, 27) suggests that it is disadvantageous in many (although not all) tropical settings, so that evolutionary fixation in this mode might have profound effects on the evolutionary biogeography of major clades. The low metabolic rates and sluggish activity levels reported even for tropical anomalodesmatans relative to the veneroids (28, 29) may also be disadvantageous at low latitudes (30).
Although no direct determination of species age and spatial origination patterns can as yet be made, several lines of evidence indicate that genus-level data predict the formation of both genus- and species-level gradients. First, genus age and spatial origination patterns are significantly correlated with modern diversity distributions at both the genus and the species levels (Table 1 and Fig. 6). Second, regions of peak species-level diversity are also regions where species/genus ratios are highest, suggesting that regions of speciation and genus origination coincide. Finally, first-order genus-level patterns tend to map fairly well onto species-level patterns, with adaptive radiations tending to unfold at multiple taxonomic levels (31–33).
These results appear to conflict with those for birds (19, 20, 34) and bats (10), in which more derived lineages occur at higher latitudes and produce weaker LDGs than basal lineages (but see ref. 35). Phylogenetic analyses on birds attribute the LDG to high extinction rates at high latitudes (20, 34), again conflicting with the results presented here. Diversification rates in frogs and salamanders are evidently higher in the tropics (31), similar to the results presented here, but the most diverse amphibian clades are inferred to have recently invaded the tropics from temperate regions, whereas bivalves show the opposite direction of spread (11).
It is unclear why these terrestrial patterns should differ from the marine results. Historical processes in high latitudes, such as glaciation and climatic variability, may drive or damp origination more directly in terrestrial settings than in marine environments, supporting previous indications of a disconnect between the processes underlying latitudinal gradients on land and in the ocean (36). Deeper historical events might also have played a role. For example, the K-T mass extinction might have had a more profound phylogenetic and biogeographic effect on terrestrial vertebrates, in terms either of extinction or subsequent rebound, than on surviving marine clades, where widespread clades preferentially survived and latitudinal selectivity was weak or absent (18). Additional research is needed to resolve these issues. Analyses of other contrarian clades in a dynamic, phylogenetic context, from aquatic macrophytes (37, 38) to articulate brachiopods (25) to ichneumonid wasps (16, 39), would be valuable.
Conclusions
Differential patterns of origination in space and time offer a mechanism not only for the production of LDGs but for significant variations in the structure of the gradient among clades. As Hawkins et al. (40) note, “… the spatial structure of climatic variation on Earth causes nearly all theories developed to explain broadscale richness gradients to predict a positive correlation between richness and temperature, even when no causal link between them exists.” Thus, contrarian clades are especially valuable for detecting general dynamics independent of temperature, latitude, or their many covariates. The striking correspondence between the locus of originations through the Late Cenozoic and the shape of the present-day diversity trend (for both species and genera) indicates that a clade's evolutionary dynamic strongly influences its modern diversity patterns. This correlation also shows that spatial patterns of origination explain much of the variability, reducing (but not eliminating) the importance of extinction and phylogenetic position. The anomalodesmatans, with their contrarian diversity pattern, verify the importance of origination in creating LDGs because (i) diversity peaks are still associated with young genera, (ii) temperate zone diversity peaks are the result of damped origination in the tropics, and (iii) the steepness of their gradient is associated with the location of their originations, namely in temperate regions. Thus, the same evolutionary processes that create the pervasive and well known LDG can produce other diversity distributions, even among related taxa. Such contrarian clades can be disproportionately valuable in testing hypotheses for large-scale diversity patterns, by providing extreme values and breaking covariations that can obscure causal relationships.
Methods
We significantly expanded and revised a previously constructed, taxonomically standardized database of global spatial occurrences of living marine bivalves (31, 41). The database is restricted to occurrences from water depths <200 m, where bivalve distribution is well known and the fossil record more complete relative to their deep-water counterparts (42). Currently, six orders of marine bivalves are represented in the database, following the recent classification of Bieler and Mikkelsen (43): Protobranchia, Arcoida, Mytiloida, Carditoida, Anomalodesmata, and Veneroida (SI Fig. 7). Because of the incomplete sampling of the pterioids and the lack of limids in the database, the pterioids and pectinoids were collapsed to their common node and will be referred to as Pteriomorphia following Crame (44) and earlier classifications. These data are taxonomically standardized by using both recent taxonomic revisions in the literature and independent analysis of individual specimens. This database currently includes 773 genera and subgenera (hereafter termed genera), 4,588 species, and 20,816 occurrences from 203 localities around the world. Of the 773 genera, 82% are known from the fossil record. Despite our revisions and use of subgenera, which are less likely to enter the fossil record than more inclusive genera, this percentage is similar to that reported by Flessa and Jablonski (42) in previous analyses of these data (88%), and by Valentine (45) in a study of Pleistocene mollusks of the Californian Province (84%). Data were compiled primarily from an exhaustive search of the primary literature and an examination of museum collections.
To quantify the LDG for a given order, each locality within our database was assigned to tropical, temperate, or polar climate zones based primarily on the hydrographic compartments of Longhurst (46). This climate-zone approach has the advantage of measuring diversity trends more directly with respect to environmental conditions, as, for example, upwelling and cold-water currents can cause significant constriction of true tropical conditions at some low-latitude localities (e.g., Peru). The proportion of the total number of species or genera within an order was then determined for each climate zone. The strength of the LDG for each order was defined simply as the difference between the proportion of taxa found in the tropics versus the poles, or
where total is the number of taxa (species, genera) within an order, and tropical and polar are the number of taxa found in those climatic zones. Because proportions are used, changes in temperate diversity are indirectly accounted for by changing the total value. The only circumstance in which temperate diversity would not affect this metric is if there were no temperate endemics, an extreme situation not seen in any of the orders in our data set. Measuring gradient strength as the proportional difference between tropical and temperate diversity (by simply replacing polar diversity with temperate diversity) fails to alter the results, although the genus-level correlation barely loses statistical significance (r2 = 0.55, P = 0.09; species-level results remain significant). Gradients for the Northern and Southern hemispheres were determined separately and averaged to produce one value for the strength of the gradient for each order.
Previous studies have used the slopes of linear regressions of diversity against latitude to describe LDGs (7, 47), but simple linear slopes are inadequate for interorder comparisons of LDGs for several reasons. First, the slope of a linear regression will be heavily influenced by total species and genus richness, which varies considerably among orders. Proportional diversity was used here to produce standardized, and therefore comparable, gradient strengths for each bivalve order. Second, because diversity rarely declines as a simple linear function of latitude, linear regression slopes will tend to mask even strong variations in diversity patterns among orders. This variability is of particular importance because peak diversities can occur in different climate zones yet still result in similar slopes. Using climatic zones specifically to define the strength of the LDG avoids this problem. Finally, linear models fail to avoid the autocorrelation caused by many genera being shared in adjacent degrees latitude or latitudinal bins, which would exaggerate the significance of perceived slopes.
Analysis of patterns for latitudinal bands or climate zones at the global scale has the advantage of using data that are both spatially and temporally averaged, making them more robust to biasing factors such as sampling effort. Indeed, the patterns presented here have proven stable despite considerable taxonomic revision and the addition of several highly diverse localities [e.g., Madagascar, Montibello, and Christmas Islands (Western Australia), Dampier Archipelago]; these results suggest that the rich diversity remaining to be described in tropical waters will not qualitatively shift the observed patterns. Thus these global patterns appear to be robust representations of diversity patterns at this scale.
The contrasting tropical-temperate diversity patterns in the Anomalodesmata and the Veneroida were evaluated by using a G test for independence (48), comparing the maximum diversity of each clade to the corresponding diversity of the other clade in that latitudinal bin. Veneroid peak diversity (270 genera) occurs at 20°, where anomalodesmatan diversity is 66 genera. Anomalodesmatan peak diversity (78 genera) is at 35°, where veneroid diversity is 146 genera. Spatial autocorrelation should damp differences between latitudinal bins, making this test conservative. Linear correlations and standard nonparametric statistics were used to test the strength and significance of the relationships between ages of genera within an order and the strength of its gradient.
Geologic ages of genera were taken from an extensively revised and updated version of Sepkoski's compendium (11, 49, 50).
Supplementary Material
Acknowledgments
We thank K. Amano, A. G. Beu, R. Bieler, J. G. Carter, R. V. Cosel, J. S. Crampton, E. V. Coan, T. A. Darragh, H. H. Dijkstra, E. M. Harper, C. S. Hickman, S. Kiel, M. LaBarbera, K. Lam, K. Lamprell, K. A. Lutaenko, P. A. Maxwell, P. M. Mikkelsen, P. Middelfart, N. J. Morris, G. Paulay, F. Scarabino, J. A. Schneider, P. V. Scott, J. T. Smith, J. D. Taylor, J. D. Todd, T. R. Waller, A. Warén, and F. P. Wesselingh for advice, assistance, and/or access to collections in their care and G. Hunt, S. M. Kidwell, A. Purvis, P. D. Roopnarine, K. Roy, and J. T. Weir for reviews. This research was funded by the National Aeronautics and Space Administration.
Abbreviations
- LDG
latitudinal diversity gradient
- Myr
million years
- K-T
end-Cretaceous.
Footnotes
The authors declare no conflict of interest.
This article contains supporting information online at www.pnas.org/cgi/content/full/0709202104/DC1.
References
- 1.Fischer AG. Evolution (Lawrence, Kans) 1960;14:64–81. [Google Scholar]
- 2.Dobzhansky T. Am Sci. 1950;38:209–221. [Google Scholar]
- 3.Wallace AR. Tropical Nature and Other Essays. New York: Macmillan; 1878. [Google Scholar]
- 4.Rhode K. Oikos. 1992;65:514–527. [Google Scholar]
- 5.Pianka ER. Am Nat. 1966;100:65–75. [Google Scholar]
- 6.Wiens JJ, Donoghue MJ. Trends Ecol Evol. 2004;19:639–644. doi: 10.1016/j.tree.2004.09.011. [DOI] [PubMed] [Google Scholar]
- 7.Hillebrand H. Am Nat. 2004;163:192–211. doi: 10.1086/381004. [DOI] [PubMed] [Google Scholar]
- 8.Rosenzweig ML. Species Diversity in Space and Time. Cambridge, UK: Cambridge Univ Press; 1995. [Google Scholar]
- 9.Stephens PR, Wiens JJ. Am Nat. 2003;161:112–128. doi: 10.1086/345091. [DOI] [PubMed] [Google Scholar]
- 10.Stevens RD. Proc R Soc London Ser B. 2006;273:2283–2289. doi: 10.1098/rspb.2006.3596. [DOI] [PMC free article] [PubMed] [Google Scholar]
- 11.Jablonski D, Roy K, Valentine JW. Science. 2006;314:102–106. doi: 10.1126/science.1130880. [DOI] [PubMed] [Google Scholar]
- 12.Ricklefs RE, Schluter D. In: Species Diversity in Ecological Communities: Historical and Geographical Perspectives. Ricklefs RE, Schluter D, editors. Chicago: Univ of Chicago Press; 1993. pp. 350–363. [Google Scholar]
- 13.Willig MR, Kaufman DM, Stevens RD. Annu Rev Ecol Syst. 2003;34:273–309. [Google Scholar]
- 14.Chown SL, Sinclair BJ, Leinaas HP, Gaston KJ. PLoS Biol. 2004;2:1701–1707. doi: 10.1371/journal.pbio.0020406. [DOI] [PMC free article] [PubMed] [Google Scholar]
- 15.Wiens JJ. Am Nat. 2007;170(Suppl):S86–S106. doi: 10.1086/519396. [DOI] [PubMed] [Google Scholar]
- 16.Kindlmann P, Schodelbauerova I, Dixon AFG. In: Scaling Biodiversity. Storch D, Marquet PA, Brown JH, editors. Cambridge, UK: Cambridge Univ Press; 2007. pp. 246–257. [Google Scholar]
- 17.Darragh TA. Alcheringa. 1986;10:1–34. [Google Scholar]
- 18.Raup DM, Jablonski D. Science. 1993;260:971–973. doi: 10.1126/science.11537491. [DOI] [PubMed] [Google Scholar]
- 19.Hawkins BA, Diniz-Filho JAF, Jaramillo CA, Soeller SA. J Biogeogr. 2006;33:770–780. [Google Scholar]
- 20.Hawkins BA, Diniz-Filho JAF, Jaramillo CA, Soeller SA. Am Nat. 2007;170(Suppl):S16–S27. doi: 10.1086/519009. [DOI] [PubMed] [Google Scholar]
- 21.Kerr JT, Currie DJ. Ecoscience. 1999;6:329–337. [Google Scholar]
- 22.Middelfart P. Mol Res. 2002;22:23–85. [Google Scholar]
- 23.Allen AP, Gillooly JF. Ecol Lett. 2006;9:947–954. doi: 10.1111/j.1461-0248.2006.00946.x. [DOI] [PubMed] [Google Scholar]
- 24.Foote M. In: Evolutionary Patterns. Jackson JBC, Lidgard S, McKinney ML, editors. Chicago: Univ of Chicago Press; 2001. pp. 245–294. [Google Scholar]
- 25.Valentine JW, Jablonski D. Evolution (Lawrence, Kans) 1983;37:1052–1061. doi: 10.1111/j.1558-5646.1983.tb05632.x. [DOI] [PubMed] [Google Scholar]
- 26.Laptikhovsky V. Mar Ecol. 2006;27:7–14. [Google Scholar]
- 27.Jablonski D, Lutz RA. Biol Rev. 1983;58:21–89. [Google Scholar]
- 28.Morley SA, Peck LS, Tan KS, Martin SM, Portner HO. Mar Biol. 2007;151:1823–1830. [Google Scholar]
- 29.Checa AG, Jimenez-Jimenez AP. Palaeontology. 2003;46:709–724. [Google Scholar]
- 30.Vermeij GJ. Am Nat. 1999;153:243–253. doi: 10.1086/303175. [DOI] [PubMed] [Google Scholar]
- 31.Jablonski D, Flessa KW. Malacologia. 1986;27:43–66. [Google Scholar]
- 32.Sepkoski JJ. Philos Trans R Soc London B. 1998;353:315–326. doi: 10.1098/rstb.1998.0212. [DOI] [PMC free article] [PubMed] [Google Scholar]
- 33.Gaston KJ. Progr Phys Geogr. 2000;24:117–127. [Google Scholar]
- 34.Weir JT, Schluter D. Science. 2007;315:1574–1576. doi: 10.1126/science.1135590. [DOI] [PubMed] [Google Scholar]
- 35.Cardillo M, Orme CDL, Owens IPF. Ecology. 2005;86:2278–2287. [Google Scholar]
- 36.Roy K, Goldberg EE. Am Nat. 2007;170:S71–S85. doi: 10.1086/519403. [DOI] [PubMed] [Google Scholar]
- 37.Santelices B, Marquet PA. Diversity Distrib. 1998;4:71–75. [Google Scholar]
- 38.Bolton JJ. Bot Mar. 1994;37:241–245. [Google Scholar]
- 39.Janzen DH. Ecology. 1981;62:532–537. [Google Scholar]
- 40.Hawkins BA, Diniz-Filho JAF, Bini LM, Araujo MB, Field R, Hortal J, Kerr JT, Rahbek C, Rodriguez MA, Sanders NJ. Ecology. 2007;88:1898–1902. doi: 10.1890/06-2141.1. [DOI] [PubMed] [Google Scholar]
- 41.Flessa KW, Jablonski D. Hist Biol. 1995;10:24–47. [Google Scholar]
- 42.Flessa KW, Jablonski D. In: Evolutionary Paleobiology. Jablonski D, Erwin DH, Lipps JH, editors. Chicago: Univ of Chicago Press; 1996. pp. 376–397. [Google Scholar]
- 43.Bieler R, Mikkelsen PM. Zool J Linn Soc. 2006;148:223–235. [Google Scholar]
- 44.Crame JA. Paleobiology. 2000;26:188–214. [Google Scholar]
- 45.Valentine JW. Paleobiology. 1989;15:83–94. [Google Scholar]
- 46.Longhurst A. Ecological Geography of the Sea. San Diego: Academic; 1998. [Google Scholar]
- 47.Hillebrand H. Mar Ecol Prog Ser. 2004;273:251–267. [Google Scholar]
- 48.Sokal RR, Rohlf FJ. Biometry. 3rd Ed. New York: Freeman; 2003. [Google Scholar]
- 49.Sepkoski JJ. Bull Am Paleont. 2002;363:1–563. [Google Scholar]
- 50.Jablonski D, Roy K, Valentine JW, Price RM, Anderson PS. Science. 2003;300:1133–1135. doi: 10.1126/science.1083246. [DOI] [PubMed] [Google Scholar]
- 51.Rice WR. Evolution (Lawrence, Kans) 1989;43:223–225. doi: 10.1111/j.1558-5646.1989.tb04220.x. [DOI] [PubMed] [Google Scholar]
Associated Data
This section collects any data citations, data availability statements, or supplementary materials included in this article.


