Abstract
In many pine species (Family Pinaceae), ovulate cones structurally resemble a turbine, which has been widely interpreted as an adaptation for improving pollination by producing complex aerodynamic effects. We tested the turbine interpretation by quantifying patterns of pollen accumulation on ovulate cones in a wind tunnel and by using simulation models based on computational fluid dynamics. We used computer-aided design and computed tomography to create computational fluid dynamics model cones. We studied three species: Pinus radiata, Pinus sylvestris, and Cedrus libani. Irrespective of the approach or species studied, we found no evidence that turbine-like aerodynamics made a significant contribution to pollen accumulation, which instead occurred primarily by simple impaction. Consequently, we suggest alternative adaptive interpretations for the structure of ovulate cones.
Keywords: aerodynamics, computational fluid dynamics, computed tomography, wind pollination
Seed plants depend on their ability to cross-pollinate for sexual mating. In consequence, natural selection shapes their female reproductive organs to be effective pollen receptors. For animal-pollinated plants, adaptation in receptor form can be demonstrated empirically. For example, manipulative surgery can prove that changing a flower's form reduces pollination (1–3). For wind-pollinated plants, however, theoretical arguments based on the principles of fluid dynamics are customarily used to predict an ideal receptor form (4). Stokes' law of particle motion dictates that the proportion of oncoming suspended particles that impact with a receptor decreases with its diameter (5), all else being equal. Optimization of an impact collector under Stokes' law explains the features of many anemophilous flowers (i.e., those suited to wind pollination); typically, their petals are minute, and the stigma is a protuberant thin filament (4). However, the ovulate cones (megastrobili) of conifers such as pines (Pinus spp.) defy similar interpretation because they are robust structures with diameters of ≈4–10 mm at the time of pollination (6). Individual mature pine trees produce prodigious amounts of pollen (7), but pollination can limit seed set nevertheless (8, 9). Therefore, the size of ovulate cones appears counteradaptive for wind pollination unless the cones accumulate pollen by a mechanism other than simple impaction.
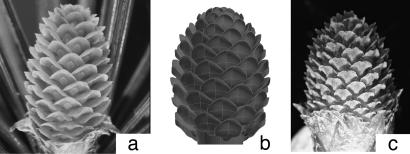
In many members of the pine family, ovulate cones structurally resemble a turbine because they comprise helically arranged scale-bract complexes (hereafter called scales), each curved like an aerofoil (Fig. 1). Previous studies have suggested that this turbine-like structure improves pollination by producing three complex aerodynamic effects (10–13). First, the cone creates a leeward eddy that draws in pollen that would otherwise pass by, which is analogous to wake-feeding by suspension-feeding aquatic animals (14). We term this “leeward recirculation.” Second, the cone may circulate pollen around its interior in a corkscrew vortex to increase the probability that pollen encounters a scale. We term this “helical recirculation.” Third, eddy vortices between the scales could have central doldrums of still air that cause pollen to sediment onto the adaxial surface of the scale. We term this “interstitial recirculation.” In pines and cedars (Cedrus spp.), each scale exudes a minute droplet of liquid on its adaxial surface near its base (15), which is analogous to the angiosperm stigma. Arguably, the turbine-like architecture of the ovulate cone is an adaptation for producing airflows that direct airborne pollen to these droplets (11). This view has been widely presented (15, 16), and we term it the “turbine interpretation” of cone structure. Here we call this interpretation into question. Consequently, the adaptive interpretation of the structure of ovulate cones becomes once again problematic, and we therefore consider alternatives.
Fig. 1.
Some ovulate cones used in this study. (a) C. libani. (b) CAD model based on C. libani. (c) P. radiata.
We investigated the interaction between ovulate cones and airborne pollen by quantifying patterns of pollen accumulation on cones exposed to a passing cloud of pollen in a wind tunnel. In addition, we used simulation models based on computational fluid dynamics (CFD) to visualize the interactions among cone architecture, air streams, and airborne pollen. CFD is used routinely in the analysis of engineering systems, and it involves the numerical solution of the Navier–Stokes equations that govern laminar flow and of the time-averaged Reynolds equations for turbulent flows (17). A CFD analysis describes the target system within a spatial grid or mesh, and then a computer solves the governing equations for each small cell of the mesh and updates them iteratively to describe the system's evolution. We constructed a mesh for the cone's geometry in two ways. First, we used computer-aided design (CAD) to create a likeness of the cone. Second, we used an x-ray microscanner and computed tomography (CT) to construct a mesh of a specimen cone. The CAD approach abstracts the main features of the cone, thereby enabling their aerodynamic importance to be evaluated. In contrast, CT scanning provides greater fidelity, but it is less suited for dissecting out features that govern aerodynamics.
We studied three tree species in the Pinaceae Family whose ovulate cones are variants on the classic family structure (Fig. 1): P. radiata D. Don (Monterey pine), C. libani A. Rich (Cedar of Lebanon), and P. sylvestris L. (Scots pine).
Results
Wind-Tunnel Experiments.
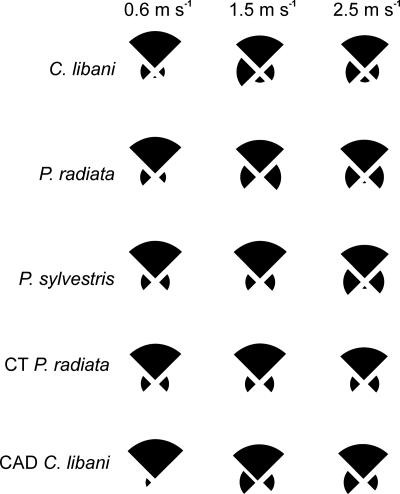
Irrespective of species, ovulate cones accumulated most pollen on their windward scales (mean proportion of accumulated pollen in the upwind quadrant = 71%, SE = 2.2, n = 49) (Fig. 2). Pollen accumulated on both the abaxial and adaxial surfaces of scales. Little pollen was found on surfaces facing directly downwind (downwind quadrant: mean = 2% of all accumulated pollen, SE = 0.4, n = 49) (Fig. 2). Pollen that accumulated in the lateral quadrants (left and right sides) of the cones was evenly distributed in the pines (P. radiata: proportion of pollen in left vs. right quadrant; paired t test, t = 1.25, df = 23, P > 0.05; P. sylvestris: t = 0.62, df = 9, P > 0.05) (Fig. 2), but not in the cedar (C. libani: t = 3.32, df = 14, P < 0.01) (Fig. 2).
Fig. 2.
Patterns of pollen accumulation (fresh cones) or impact (CFD model cones) in four quadrants (windward, leeward, left, and right) of the cones' surfaces in relation to wind speed (m/s). In each pie chart, the uppermost slice indicates the surfaces in the windward quadrant and the lowermost slice is leeward. The area of each slice is proportional to the mean percentage of pollen accumulated or particles impacted in that quadrant. For all CFD simulations, data shown are for a particle density of 200 kg/m3.
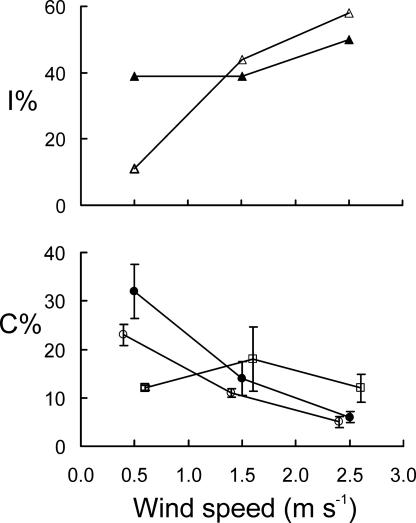
The collection efficiency of the cones varied between ≈5–30% depending on the wind speed (analysis of covariance; wind speed covariate; F1, 43 = 27.6, P < 0.001) (Fig. 3). The wind speed–collection efficiency relationship differed among species (analysis of covariance; wind speed–species interaction; F2, 43 = 7.7, P < 0.01) (Fig. 3). Although collection efficiency declined with wind speed in the pines (P. radiata and P. sylvestris), it was independent of wind speed in C. libani (Fig. 3).
Fig. 3.
Relationships between wind speed (x axis) and either impaction efficiency (y axis, Upper) or collection efficiency (y axis, Lower). (Upper) Open symbols indicate the CAD model cone, and closed symbols indicate the CT model cone. In CFD simulations, pollen was represented by 60-μm spherical particles with a density of 200 kg/m3. (Lower) Open circles indicate P. radiata, closed circles indicate P. sylvestris, and squares indicate C. libani. Results are shown for wind-tunnel trials by using conspecific pollen. Points are interpolated, and some in Lower are slightly displaced along the x axis for ease of inspection only.
CFD Simulations.
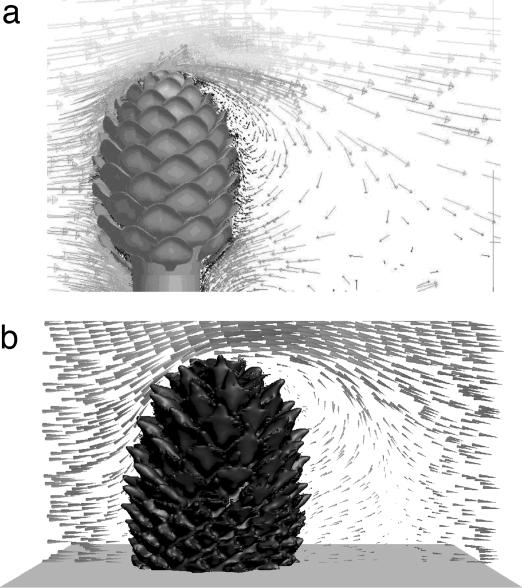
Airflow around both model cones exhibited leeward recirculation (Fig. 4), but we found no interior airflows counter to the prevailing direction of exterior flow in the windward half of the cone, which contraindicates helical and interstitial recirculation. Air flow in the leeward interior of the cone was virtually nil, although the direction was sometimes counter to prevailing exterior flow because of proximity to the leeward eddy. No vortices were found in the spaces between scales, which contraindicates interstitial recirculation.
Fig. 4.
CFD visualizations of leeward recirculation of airstreams behind model ovulate cones. (a) CAD model based on C. libani. (b) CT model based on P. radiata. Prevailing airflow is from left to right. Note that the visualization of the CT cone does not fully reflect the surface detail of the computer model.
At all wind speeds and particle densities, particles rarely recirculated in the leeward eddies, and none impacted on leeward surfaces (Fig. 2).
The impaction efficiency of both model cones increased with the speed of the oncoming air stream (Fig. 3). For a given wind speed, the impaction efficiency of the model cones exceeded the collection efficiency of real cones, particularly at higher wind speeds (Fig. 3).
Discussion
The turbine interpretation of ovulate cone structure has been supported in part by reference to photographic traces of minute airborne helium bubbles passing over a papier maché model of a generic ovulate cone (10–12). Like the bubble traces, our CFD simulations of airflows around model cones showed leeward recirculation, which is a phenomenon produced by any ovoid in an airflow (18); in contrast, the simulations did not produce helical or interstitial recirculation. We are confident of the verisimilitude of our model cones because they were obtained by digitizing specimens. Therefore, our CFD simulations begin to suggest that the turbine interpretation does not apply generally among conifer species. Also, we note that the low air velocities that we recorded within the simulated cone and the small size of interstices among scales combine to yield Reynolds numbers (Rs) of order <1, which implies that interstitial recirculation by turbulent flow is unlikely in principle.
The turbine interpretation also has been supported by photographic traces of particles in leeward recirculation, some of which appear on course for the cone's leeward surfaces (13). In contrast, our CFD simulations suggest that ovulate cones function as simple impact collectors for pollen. But how credible are our simulations? There are two uncertainties. First, we could not establish the density of conifer pollen. However, we obtained qualitatively identical results across a wide range of particle densities, which probably includes the actual pollen density. Second, we cannot be sure that the irregular shape of the pollen grain (15) makes no contribution to its aerodynamic interaction with the ovulate cone. However, manipulating the particle shape in the CFD simulation did not produce recirculation. Therefore, despite these uncertainties, we argue that our failure to simulate even a single instance of pollen accumulation by recirculation undermines the turbine hypothesis.
Patterns of pollen accumulation on freeze-dried (11) and fresh (13) ovulate cones also have been used to support the turbine interpretation. Leeward and helical recirculation should result in pollen grains accumulating on the cone's leeward surfaces, and interstitial recirculation should result in pollen accumulating primarily on adaxial surfaces of scales. Our observations in wind-tunnel trials contradicted both of these predictions. Furthermore, our observations are consistent with a previous wind-tunnel study (19), which found that the number of pollen grains on downwind-facing surfaces was zero or insignificant. Collectively, these observations cast serious doubt on the turbine interpretation of cone structure and indicate the importance of simple impaction in pollen collection.
It can be argued that pollen grains adhering to the cone's exterior are irrelevant and that complex airflows had nevertheless delivered some pollen precisely to the micropyles of ovules in our wind-tunnel trials. We would have failed to detect this result because we did not dissect the cones. However, Roussey and Kevan (19) dissected their cones and found virtually no pollen on the micropylar arms of ovules on the downwind scales.
Why do the results of wind-tunnel trials differ among studies? Contrasting patterns of pollen accumulation are found for cones of the same species (e.g., P. sylvestris) depending on whether the experimenters used fresh cones (this study and ref. 19) or freeze-dried cones (11), which suggests that outcomes are contingent on cone preparation. Unlike fresh cones, the surfaces of freeze-dried cones cannot secure pollen by adhesion (J.E.C., unpublished data). In wind-tunnel trials, pollen probably rebounds from dried windward scales, falls into the cone's interior, and possibly arrives at the leeward scales under the influence of the airflow between the scales.
We have argued that the architecture of the conifer ovulate cone cannot be interpreted as an adaptation for generating complex air currents to favor pollen capture. But then what is its adaptive function? We do not consider the broad requirements for protecting the ovules and maturing and dispersing the seeds, which are reviewed elsewhere (20). Instead, we offer two further adaptive interpretations. First, the arrangement of the cone's scales may have evolved as a form of guttering, which directs beads of water from rainfall and dew to roll over scale surfaces to the cone's interior, thereby bringing scavenged pollen to the micropyles (15). Second, the aerofoil profiles of scales may function as turgour-operated, bistable structures that enable the cone to open hydraulically, remain open during its pollination phase, and later close for the better protection of seeds. This mechanism produces the movements of the Venus flytrap (Aldrovanda vesiculosa), albeit at much greater speed (21).
Although it may function primarily as an impact collector, the ovulate cone has a greater collection efficiency than a solid ovoid of similar size (6). The discrepancy probably arises because ovulate conelets are not solid objects. Presumably, the airflow through the cone's interior reduces upwind disturbance, thereby enabling oncoming particles to maintain trajectories that lead to collision, which offsets the cone's apparent inefficiency as an impact collector.
We observed that the collection efficiency of ovulate cones either decreased as wind speed increased (P. radiata and P. sylvestris) or was independent of wind speed (C. libani). In contrast, the impaction efficiency of the system should increase with the rate of fluid flow. We postulate that this discrepancy results from increased rebound from the surfaces as the speed of airborne pollen increases. The relationship between collection efficiency and wind speed varies among conifer species (this study and ref. 19), which may be an adaptation for the wind conditions normally experienced by a species, although this remains to be tested.
Materials and Methods
Wind-Tunnel Experiments.
All wind-tunnel trials were conducted by using material freshly collected from trees on the University of Exeter campus (50°43′N, 3°31′W) in 2005 and 2006. Ovulate cones were used within 3 h of collection, and pollen (stored at room temperature) was used within 24 h. Where necessary, we removed natural accumulations of pollen from a cone with a fine artist's paintbrush before using it in the experiment. Cones were placed individually in a small wind tunnel and exposed to airborne pollen of their own species. The wind tunnel had a cross-section of 60 × 60 mm over a run of 185 mm, with an aerodynamically shaped contraction beginning with an initial cross-section of 250 × 250 mm (22). Pollen was loaded into a narrow nozzle formed from a trimmed 200-μl pipette tip (Life Sciences International, Basingstoke, U.K.) and then injected into the contraction of the wind tunnel using a syringe. To produce a uniform pollen cloud, we dispersed the pollen during injection with a baffle (8 × 8 mm mounted 25 mm in front of the nozzle) situated 60 mm from the tunnel's contraction. For each plant species and wind speed, the quantity of pollen injected was adjusted until an area density of ≈50 grains per mm2 was deposited on a petroleum jelly-coated target (1.6-mm-diameter steel pinhead). Each cone was exposed to a single pollen cloud at a uniform wind speed of either 0.6, 1.5, or 2.5 m/s, which are similar speeds to those of previous studies (10, 11). Trees typically bear ovulate cones erect, and so the cone in the wind tunnel was oriented with its proximal–distal axis perpendicular to the oncoming wind. We did not study extensively the effect of cone inclination because pilot trials with cones orientated at 45° to the airflow found no significant effect of such an angle, although previous studies proposed that this inclination may increase helical recirculation (10, 11).
After exposure to airborne pollen, we counted under a microscope the number of pollen grains adhering to the cone in each of its four 90° quadrants (windward, leeward, left, and right) and, if necessary, subtracted the small number of pollen grains counted immediately before the trial.
To estimate the collection efficiency of the cones, we compared the observed accumulation of pollen on the cone with the expected accumulation based on the cross-sectional area of the cone (mm2) multiplied by the area density of pollen on the jelly-coated target (grains per mm2). Using geometry, we estimated the cone's cross-sectional area (A) based on its height (H) and width (W) at the widest point by assuming that it was an ellipse truncated by one quarter of its height. The dimensions of the cones used in the trials were: C. libani, H = 11.8 mm (SE = 0.34), W = 6.4 mm (SE = 0.12), A = 54.9 mm2 (SE = 2.15), n = 15; P. radiata, H = 10.7 (SE = 0.31), W = 7.4 (SE = 0.12), A = 57.8 (SE = 2.72), n = 24; and P. sylvestris, H = 4.0 (SE = 0.05), W = 3.5 (SE = 0.07), A = 10.1 (SE = 0.3), n = 10. We calculated Rs for each conifer species in the wind-tunnel trials based on the geometric mean of an average cone's width and length.
CFD Simulations.
Based on measurements from photographic cross-sections, we formed an enlarged scale of C. libani in modeling clay, sliced it, and digitized its sections to generate a 3D shape in a CAD environment, GAMBIT (Fluent, Lebanon, NH). Using CAD, 96 such scales were arranged around a tapering central spine to mimic the cone's phyllotaxis (Fig. 1), with each helical parastichy of scales pitched at 39° from vertical. We varied the scale size to produce a realistic taper.
Using a microCT scanner (Skyscan 1170; Skyscan, Kontich, Belgium), we created a model ovulate cone of P. radiata. We used the software package ScanIP version 2.1.187/ScanFE version 2.0.11.1 (Simpleware, Exeter, U.K.) to re-create a 3D mesh from 256 × 217 × 165 cross-sectional scanner images. The original mesh comprising 40 × 106 cells was analyzed initially on a supercomputer (CSAR, Manchester, U.K.), but subsequent analyses were implemented on a smaller twin-processor machine (Workstar W425-HE; Digital Networks U.K., Ashton-under-Lyne, U.K.) with a reduced mesh of 1.8 × 10⁶ cells generated by subsampling and conversion to a polyhedral mesh. The aerodynamic behavior of the reduced mesh was qualitatively identical with that of the original. For both CAD and CT models, a mesh representing open space was extended around the cone, particularly downstream.
To investigate the aerodynamics of the model cones, we used Fluent Flow Modeling Software version 6.1 (P. radiata model) or version 6.2 (C. libani model). In reality, the airflow around a tree canopy will be turbulent, but the turbulent eddies probably occur at scales of similar size to the ovulate cone, and so the local flow around the cone will be approximately laminar. We explored the system's behavior at several wind speeds: 0.6 m/s2 (R = 350), 1.5 m/s2 (R = 870), and 2.5 m/s2 (R = 1,455), which matched the wind speeds of the wind-tunnel trials. It is plausible to assume that the flow around a bluff body at R = 350 is steady, but flow at R ≥ 870 will exhibit transient behavior, such as downstream vortex shedding. All simulations were initially run by using the steady-state SIMPLE algorithm, but those for R = 870 and R = 1,455 were finally implemented by using the transient PISO algorithm. Taking into account the fine nature of the computational mesh involved, first-order upwind differencing was used for the spatial derivatives.
To test for helical and interstitial recirculation in each simulation, we examined a series of cross-sections of each model cone for interior airflows counter to the prevailing exterior flow. We used Lagrangian particle tracking to simulate the trajectories of 60-μm-diameter spherical pollen grains through the flow field. Within the CFD environment, adjustments to particle shape parameters designed to mimic the irregular shape of pine pollen (23) made no qualitative difference to patterns of pollen impacts, and so we did not adopt them. The density of conifer pollen grains is unknown, so we used 200 kg/m3 because, under Stokes law, a 60-μm sphere of this density achieves a terminal velocity typical of pine pollen (i.e., ≈20 mm/s) (10). For generality, we also investigated a range of other particle densities (100, 300, 400, 500, 700, 900, and 1,100 kg/m3) at a wind speed of 0.6 m/s2.
In the CFD simulations, particles were released from 15 × 15 grids at the inlet upstream of the cone. The ratio of the area of the release grid to the projected cone area was used to determine the number of directly oncoming particles (i.e., those that would impact the cone if no deflection occurred). For each cone, we recorded the percentage of impacting particles in each quadrant of the cone's surfaces and calculated impaction efficiency as the proportion of oncoming particles that collided with any cone surface.
Acknowledgments
We thank Dr. Andy Wade for converting the CT mesh to polyhedra, Fay Baro for technical assistance, Simcha Lev-Yadun and an anonymous reviewer for improving our manuscript, and Phil Shears for photographing the specimen cones. This work was supported in part by University of Manchester's Computer Services for Academic Research Grant cs3035.
Abbreviations
- CAD
computer-aided design
- CFD
computational fluid dynamics
- CT
computed tomography.
Footnotes
The authors declare no conflict of interest.
This article is a PNAS Direct Submission.
References
- 1.Bell G. Proc R Soc London Ser B. 1985;224:223–265. [Google Scholar]
- 2.Clements FE, Long FL. Experimental Pollination. Ithaca, NY: Cornell Univ Press; 1923. [Google Scholar]
- 3.Cresswell JE. Ecology. 2000;81:3244–3249. [Google Scholar]
- 4.Whitehead DR. In: Pollination Biology. Real L, editor. Orlando, FL: Academic; 1983. pp. 97–108. [Google Scholar]
- 5.Perry RH, Green DW, O'Hara Maloney J. Perry's Chemical Engineer's Handbook. New York: McGraw–Hill; 1997. [Google Scholar]
- 6.Paw UKT, Hotton C. Am J Bot. 1989;76:445–453. [Google Scholar]
- 7.Khanduri VP, Sharma CM. Ann Bot (London) 2002;89:587–593. doi: 10.1093/aob/mcf101. [DOI] [PMC free article] [PubMed] [Google Scholar]
- 8.Sorensen FC, Webber JE. Can J Forest Res. 1997;27:63–68. [Google Scholar]
- 9.DiFazio SP, Wilson MV, Vance NC. Am J Bot. 1998;85:910–918. [PubMed] [Google Scholar]
- 10.Niklas KJ, Paw UKT. Am J Bot. 1983;70:568–577. [Google Scholar]
- 11.Niklas KJ. Proc Natl Acad Sci USA. 1982;79:510–514. doi: 10.1073/pnas.79.2.510. [DOI] [PMC free article] [PubMed] [Google Scholar]
- 12.Niklas KJ. Science. 1982;217:442–444. doi: 10.1126/science.217.4558.442. [DOI] [PubMed] [Google Scholar]
- 13.Niklas KJ. Am J Bot. 1984;71:356–374. [Google Scholar]
- 14.Shimeta J, Jumars PA. Oceanogr Mar Biol. 1991;29:191–257. [Google Scholar]
- 15.Owens JN, Takaso T, Runions CJ. Trends Plants Sci. 1998;3:479–485. [Google Scholar]
- 16.Ackerman JD. Plant System Evol. 2000;222:167–185. [Google Scholar]
- 17.Douglas JF, Gasiorek JM, Swaffield JA. Fluid Mechanics. Englewood Cliffs, NJ: Prentice– Hall; 2001. [Google Scholar]
- 18.Van Dyke M. An Album of Fluid Motion. Stanford, CA: Parabolic; 1982. [Google Scholar]
- 19.Roussy A, Keven PG. Am J Bot. 2000;87:215–220. [PubMed] [Google Scholar]
- 20.Tomlinson PB, Takaso T. Can J Bot. 2002;80:1250–1273. [Google Scholar]
- 21.Forterre Y, Skotheim JM, Dumais J, Mahadevan L. Nature. 2005;433:421–425. doi: 10.1038/nature03185. [DOI] [PubMed] [Google Scholar]
- 22.Cresswell JE, Davies TW, Patrick MA, Russell F, Pennel C, Vicot M, Lahoubi M. Funct Ecol. 2004;18:861–866. [Google Scholar]
- 23.Schwendemann A, Wang G, Mertz M, McWilliams R, Thatcher S, Osborn J. Am J Bot. 2007;94:1371–1381. doi: 10.3732/ajb.94.8.1371. [DOI] [PubMed] [Google Scholar]


