Abstract
A series of 11 simple phylloquinone derivatives, each lacking the extended phytyl side chain but featuring H-bond donor amides at one or both peri positions, were prepared and some salient physical properties were measured. A correlation between both IR frequency and NMR peak position, as indicators of internal H-bond strength, and the quinone half-wave reduction potential, was observed. These data are consistent with the prevailing hypothesis that quinone carbonyl H-bonding in general, and stronger H-bonds in particular, favorably bias the endogenous quinone's electrochemical potential toward easier reduction.
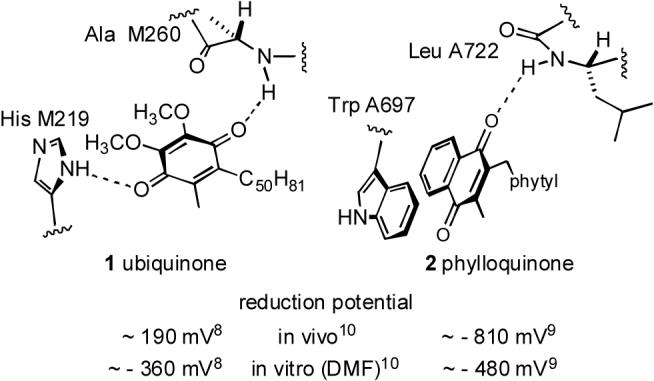
The complete structural characterization of the photosynthetic reaction centers Photosystem 1 (PS1)1 and bacterial reaction center (bRC)2 has enabled unparalleled advances in understanding the mechanistic underpinnings of photosynthesis.3 Even as Angstrom-level features have come into focus, the relationship between structure and function, in many cases, has yet to be clarified. One pivotal feature of the light-driven electron transfer from each system's primary chlorophyll acceptor to the terminal repository, a quinone (bRC) or Fe4S4 cluster (PS1), involves reaction through an intermediate quinone transfer junction (ubiquinone (1) in bRC and phylloquinone (2) in PS1), Fig. 1. The critical reduction potentials of these quinones are thought to be responsive to local electrostatic effects, with proximal negatively charged amino acid side chains and a juxtaposed negatively charged iron-sulfur cluster contributing to a lower value (harder to reduce) for phylloquinone in PS1 compared with an adjacent and reduction-facilitating Fe2+ site in bRC.4 In addition to these charge effects, both H-bonding and π-stacking also are cited as influential factors in determining the quinone reduction potential. Ubiquinone is pinioned by the protein matrix between two H-bonds as shown, and so it is not surprising that it's estimated reduction potential in vivo is higher than (more easily reduced than) the same quinone in the non-protic media DMF. Whereas the inexact modeling of a protein interior by DMF does not allow too firm of a conclusion to be drawn, it is likely that at least some of the diminished reduction potential of the in vivo version can be attributed to dual H-bond activation of the quinone's carbonyls. It is quite surprising, then, that the analogous quinone 2 of PS1 exhibits a reduction potential that is substantially lower than various phylloquinone models in DMF solution, given that it, too, presumably benefits from the single H-bond shown.5 The role that the enveloping protein plays in modulating the reduction potential of this quinone has been a matter of speculation, and one theory in current ascendancy focuses on the protein-mediated modulation of a π-stacking interaction with the adjacent indole ring of TrpA697.6 From this perspective, the π-stacking interaction is viewed as energetically favorable for the parent quinone, but destabilizing (and yet structurally unavoidable) for the reduced species. Nevertheless, the contributions of the singular H-bond to 2 cannot be ignored, especially when circumstantial evidence suggests that this H-bond, in contrast to the dual H-bonded arrangement exhibited for the analogous quinone 1 in bRC, is particularly strong as a consequence of an extended H-bonding network provided by the protein matrix and associated waters.7 Thus, the overarching question emerges, how can amide H-bonding, and more precisely, the strength of amide H-bonding, influence a quinone's reduction potential?
Figure 1.

Structures and figures of merit for the quinones of bRC (left) and PS1 (right). All reduction potentials are reported vs. the normal hydrogen electrode.10
The relationship between H-bond strength and quinone reduction potential11 was probed using simple model 5-amido and 5,8-diamidonaphthoquinones. This approach is precedented by a long history of studying the relationship between the reduction potential of ortho hydroxy- and amino substituents on benzo- and naphthoquinones,12 and peri-positioned hydroxy, and in a few examples amino,13a groups on naphtho- and 9,10-anthroquinones.13 The upshot of these earlier studies is that a peri-substituted hydroxyl (i.e., 5-hydroxy or 5,8-dihydroxy in the naphthoquinones series) renders the quinone more easily reduced as a consequence of the LUMO-lowering effect of a geometrically favorable14 internal H-bond. The ortho-hydroxylated (aminated) benzoquinones, on the other hand, do not consistently follow this trend. Unfortunately, the H-bond strength of the peri-hydroxyls cannot be modulated, and so these types of substrates cannot be employed to test the hypothesis that reduction potential scales with H-bond strength. However, the use of a series of naphthoquinones bearing peri-positioned amide units with deliberately varying H-bond donor capabilities can overcome this limitation and represents one approach by which the effect of varying H-bond strength on quinone reduction potential can be probed.
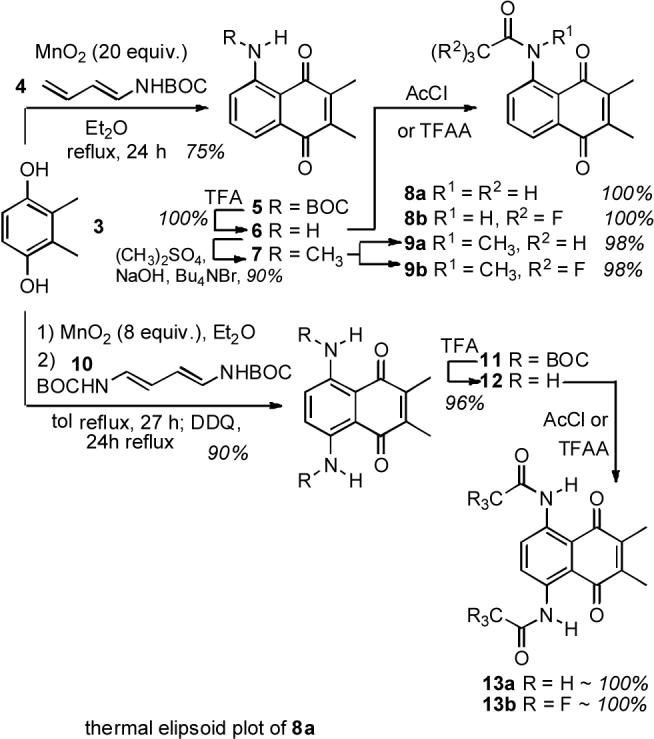
This premise was explored by synthesis of both unsymmetrically and symmetrically peri-functionalized 2,3-dimethylnaphthoquinones 5−9 and 11−13, respectively, and correlation of salient molecular attributes reflecting H-bond strength with their half-wave reduction potentials. The syntheses of the target quinones were accomplished by modification of Diels Alder/oxidation chemistry reported by Fillion15 using the mono amidobutadiene 416 and the bis amidobutadiene 10,17 Scheme 1 (see Supplementary Data for details). In this chemistry, the efficiency of naphthoquinone formation was increased over prior work by consolidating the oxidation-cycloaddition-oxidation sequence into a single pot operation. Simply exposing the dihydroquinone 3 and the requisite diene to excess oxidant (MnO2) furnished good yields of the desired naphthoquinone products 5 and 11. These BOC-protected intermediates then served as branch points for the preparation of all of the other aminonaphthoquinone derivatives. All quinone products were characterized fully,18 including single crystal X-ray for 8a (Supplementary Data).19 The X-ray derived structure clearly indicated the dominating effect of the N–H--O=C H-bond, which held the amide side chain in a coplanar orientation with the quinone framework.
Scheme 1.

Synthesis of the target naphthoquinones 5− 9, and 11−13; X-ray structure of 8a. The thermal ellipsoid diagram (50% probability) was obtained with Bruker XSHELL software.
Measurement of half-wave reduction potentials of the substituted naphthoquinones in CH2Cl2 led to the data shown in Table 1. These values were obtained under the following standard conditions: Pt disc electrode (1.6 mm diameter), Ag/AgNO3 reference (0.01 M in CH3CN), 2 mM in quinone, 100 mM in TBAP, 3 V/s, 0 to −2496 mV range, T = 20 °C. Under these conditions, ferrocenium ion exhibited a reduction potential of +200 mV (lit. 206 mV vs. Ag/AgPF6)20. The IR frequency of the H-bond, which is well known to scale with H-bond strength, and the 1H NMR H-bond signal position, a value also related to H-bond strength,21 are reported in Table 1 as well. Concentration studies with 8a over the span 1–100 mM revealed that neither the IR nor the 1H NMR signal values varied significantly (± 1 cm−1, and ± 0.05 ppm, respectively) throughout the experimental range.
Table 1.
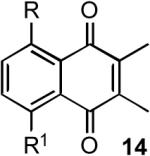
Half-wave reduction potentials, salient IR frequencies, and 1H NMR signal positions for the naphthoquinones 14.
 | ||||||
|---|---|---|---|---|---|---|
| entry | cmpd. # | R | R1 | Red. Pot. (mV) CH2Cl2a | N-H IR CCl4 (cm-1) | N-H 1H NMR C6D6 (δ) |
| a | H | H | -623 | --- | --- | |
| b | 6 | NH2 | H | -721 | 3339 | not observed |
| c | 7 | NHCH3 | H | -697 | 3304 | 9.29 |
| d | 5 | NHBOC | H | -551 | 3263 | 11.77 |
| e | 8a | NHAc | H | -484 | 3262 | 11.92 |
| f | 8b | NHTFA | H | -347 | 3109 | 13.08 |
| g | 9a | N(CH3) Ac | H | -560 | --- | --- |
| h | 9b | N(CH3)TF A | H | -554 | --- | --- |
| i | 12 | NH2 | NH2 | -819 | 3288 | not observed |
| j | 11 | NHBOC | NHBOC | -419 | 3240 | 12.06 |
| k | 13a | NHAc | NHAc | -359 | 3201 | 12.18 |
| l | 13b | NHTFA | NHTFA | -108 | 3076 | 13.18 |
All reduction potentials have been converted to NHE values via the formula: E(NHE) = E(AgNO3) + 541 mV; see Handbook of Analytical Chemistry; Meites, L., Ed.; McGraw-Hill: New York, 1963.
Examination of these data reveals a clear correlation between the half-wave reduction potential and both H-bond strength metrics. However, a dissection of the two related effects that result when an amide is introduced onto the naphthoquinone framework is necessary in order to make further sense out of the data.
Both the (1) strong and directional H-bond between N–H and O=C and the (2) contributions of the nitrogen's lone pair via resonance with the carbonyl can play a role. Much precedent from the peri-hydroxylated cases suggest that H-bond activation of the carbonyl exerts the dominant influence, between these two interactions, on quinone reduction potential.12a,13a-c,e In an effort to probe the relative contributions of these two features in the amide substituted series examined herein, the controls 6, 7, 9a, and 9b were evaluated. In the absence of any electron-engaging carbonyl (amide) fu nctions, the nitrogen's lone pair certainly has the expected effect on the quinone's reduction potential, making it harder to reduce by 98 mV; compare entry a (R = H) with entry b (6, R = NH2). In this instance, the N-H--O=C bond (IR absorption at 3339 cm−1) can only be described as modest at best, and so this comparison is closest to a case where the H-bonding is turned off whereas the nitrogen lone pair contribution is turned on. Designing the complementary control (H-bonding turned off, nitrogen lone pair turned on) cannot be assured in this system due to uncertainty in the degree of overlap between the nitrogen's lone pair and the quinone, but entries 9a and 9b, where H-bonding has been abolished by methyl incorporation, come closest to approximating this goal. In these instances, the quinone reduction potential is depressed compared to the H-bonding analogues 8a/8b by 76 mV (8a vs. 9a) and 207 mV (8b vs. 9b), respectively. In fact, the large difference between these values appears to be attributable primarily to the increased strength of the H-bond in the NHTFA case 8b, as the reduction potentials of the H-bond incapable species 9a and 9b are essentially equivalent. From these data, it is apparent that whereas the nitrogen lone pair definitely contributes to depression of the quinone's reduction potential, its effects are relatively smaller that the H-bond effect and consistent throughout the relevant substrates. Therefore, the differences in measured reduction potential between the different acylated aminoquinone substrates should to a large measure reflect the impact of the H-bond, much as they do in the more well-studied peri-hydroxylated series.
Overall, the data for substrates 5, 8a, 8b, 11, 13a, and 13b do support the contention that quinone reduction potential correlates with the strength of the H-bond, but the imperfect measures of H-bond strength used for this correlation do little to encourage linearity. Double activation of the quinone function leads to increases in the reduction potential, as expected, but the amount of increase does not scale with increased H-bond strength. Thus, introducing an additional H-bond in the BOC species leads to an increase in reduction potential of 132 mV (entries d vs. j), whereas in the NHAc series (stronger H-bond), the difference is 125 mV (entries e vs. k) and in the NHTFA analogues (strongest H-bond), 239 mV (entries f vs. l). Extrapolation from these model compounds to photosynthetically relevant quinones embedded in protein matrices must be viewed with caution, but at the very least, the following hypotheses are supported by the data: (1) stronger N–H--O=C hydrogen bonds, as might be provided by H-bond networks in the enveloping proteins, makes the quinones more easily reduced, and (2) simultaneous N–H--O=C hydrogen bonding to both quinone carbonyls makes the quinones even more easily reduced than simple additivity might suggest.
Supplementary Material
Supplementary Data. Experimental procedures and full spectral data for 5−13. Crystal structure data for 8a, and a plot of 1H NMR and IR signal position as a function of concentration for 8a.
Acknowledgment.
Funding via the National Institutes of Health, General Medical Sciences Division (GM 37861) and via the National Science Foundation for the X-Ray structural analysis facility (CHE-013111) is gratefully acknowledged.
Footnotes
Publisher's Disclaimer: This is a PDF file of an unedited manuscript that has been accepted for publication. As a service to our customers we are providing this early version of the manuscript. The manuscript will undergo copyediting, typesetting, and review of the resulting proof before it is published in its final citable form. Please note that during the production process errors may be discovered which could affect the content, and all legal disclaimers that apply to the journal pertain.
References
- 1.Jordan P, Fromme P, Witt HT, Klukas O, Saenger W, Krauβ N. Nature. 2001;411:909. doi: 10.1038/35082000. [DOI] [PubMed] [Google Scholar]
- 2.Lancaster CRD, Bibikova MV, Sabatino P, Oesterhelt D, Michel H. J. Biol. Chem. 2000;275:39364. doi: 10.1074/jbc.M008225200. [DOI] [PubMed] [Google Scholar]
- 3.Golbeck JH, editor. Photosystem 1: The Light-Driven Plastocyanin:Ferredoxin Oxidoreductase. Springer; The Netherlands: 2006. [Google Scholar]
- 4.Ishikita H, Knapp E-W. J. Biol. Chem. 2003;278:52002. doi: 10.1074/jbc.M306434200. [DOI] [PubMed] [Google Scholar]
- 5.Swallow AJ. In: Function on Quinones in Energy Conserving Systems. Trumpower BL, editor. Academic Press; New York, N.Y.: 1982. pp. 59–72. [Google Scholar]
- 6.Kaupp M. Biochemistry. 2002;41:2895. doi: 10.1021/bi0159783. [DOI] [PubMed] [Google Scholar]
- 7.Pushkar YN, Golbeck JH, Stehlik D, Zimmermann H. J. Phys. Chem. B. 2004;108:9439. [Google Scholar]
- 8.(a) Woodbury NW, Parson WW, Gunner MR, Prince RC, Dutton PL. Biochem. Biophys. Acta. 1986:6. doi: 10.1016/0005-2728(86)90243-4. [DOI] [PubMed] [Google Scholar]; (b) Prince RC, Dutton PL, Bruce JM. FEBS Lett. 1983;160:273. [Google Scholar]
- 9.Sakuragi Y, Zybailov B, Shen G, Jones AD, Chitnis PR, van der Est A, Bittl R, Zech S, Stehlik D, Golbeck JH, Bryant DA. Biochemistry. 2002;41:394. doi: 10.1021/bi011297w. [DOI] [PubMed] [Google Scholar]
- 10.Howell JO, Goncalves JM, Amatore C, Klasnic L, Wightman RM, Kochi J. K. J. Am. Chem. Soc. 1984;106:3968. [Google Scholar]; The reduction potentials for 1 and models for 2 (i.e., menaquinone and 14a in DMF were reported vs. a standard calomel electrode (SCE). These values were converted to NHE values by the formula E(NHE) = E(SCE) + 240 mV; see
- 11.(a) Gupta N, Linschitz H. J. Am. Chem. Soc. 1997;119:6384. [Google Scholar]; (b) Macías-Ruvalcaba N, Okamura N, Evans DH. J. Phys. Chem. B. 2006;110:22043. doi: 10.1021/jp064003v. and references cited therein. [DOI] [PubMed] [Google Scholar]
- 12.(a) Edwards TG, Grinter R. Trans. Farad. Soc. 1968;69:1070. [Google Scholar]; (b) Aguilar-Martínez M, Cuevas G, Jiménez-Estrada M, González I, Lotina-Hennsen B, Macías-Ruvalcaba N. J. Org. Chem. 1999;64:3684. doi: 10.1021/jo990186o. [DOI] [PubMed] [Google Scholar]; (c) Aguilar-Martínez M, Bautista-Martínez JA, Macías-Ruvalcaba N, González I, Tovar E, del Alizal Marín, Collera O, Cuevas G. J. Org. Chem. 2001;66:8349. doi: 10.1021/jo010302z. [DOI] [PubMed] [Google Scholar]; (d) Macías-Ruvalcaba N, González I, Aguilar-Martínez M. J. Electrochem. Soc. 2004;151:E110. [Google Scholar]
- 13.(a) Bezuglyi VD, Shapovalov VA, Fain VY. J. Gen. Chem., USSR (Eng. Trans) 1976;46:693. [Google Scholar]; (b) Rao GM, Lown JW, Plambeck JA. J. Electrochem. Soc. 1978;125:540. [Google Scholar]; (c) Ashnagar A, Bruce JM, Dutton PL, Prince RC. Biochem. Biophys. Acta. 1984;801:351. doi: 10.1016/0304-4165(84)90138-7. [DOI] [PubMed] [Google Scholar]; (d) Crawford PW, Carlos E, Ellegood JC, Cheng CC, Dong Q, Liu DF, Luo YL. Electrochim. Acta. 1996;41:2399. [Google Scholar]; (e) Gómez M, González FJ, González I. J. Electroanal. Chem. 2005;578:193. [Google Scholar]
- 14.(a) Schutte CJH, Paul SO, Smit RJ. Molec. Struct. 1993;297:235. [Google Scholar]; (b) Uno B, Okumura N, Goto M, Kano K. J. Org. Chem. 2000;65:1448. doi: 10.1021/jo991590q. [DOI] [PubMed] [Google Scholar]; (c) Fukuzumi S, Kitaguchi H, Suenobu T, Ogo S. J. Chem. Soc., Chem. Commun. 2002:1984. doi: 10.1039/b205517a. [DOI] [PubMed] [Google Scholar]
- 15.(a) Chigr M, Fillion H, Rougny A, Berlion M, Riondel J, Beriel H. Chem. Pharm. Bull. 1990;38:688. doi: 10.1248/cpb.38.688. [DOI] [PubMed] [Google Scholar]; (b) Potts KT, Bhattacharjee D. Synthesis. 1983:31. [Google Scholar]; (c) Schmidt RR, Wagner A. Synthesis. 1981:273. [Google Scholar]; See also
- 16.Overman LE, Taylor GF, Petty CB, Jessup PJ. J. Org. Chem. 1978;43:2164. [Google Scholar]
- 17.Prepared in one pot (49%) by treatment of (E,E)-1,6-hexa-2,4-dienic diacid with (PhO)2PON3/Et3N and t-BuOH at reflux; recrystallized from 80/20 EtOH/ H2O. See the Supporting Data, and ref. 15c for the synthesis of a related compound
- 18.Banks JA, Cameron DW, Crossley MJ, Samuel EL. Aust. J. Chem. 1976;29:2247. [Google Scholar]; Compound 6, with limited spectral data, has been reported
- 19.CCDC 649146 contains the supplementary crystallographic data for 8a. These data can be obtained free of charge from The Cambridge Crystallographic Data Centre via www.ccdc.cam.ac.uk/data_request/cif.
- 20.Attia AS, Bhattacharya S, Pierpoint CG. Inorg. Chem. 1995;34:4427. [Google Scholar]
- 21.(a) Pimentel GC, McClellan AL, Freeman WH. The Hydrogen Bond. San Francisco: 1960. [Google Scholar]; (b) Takasuka M, Matsui Y. J. Chem. Soc., Perkin Trans. II. 1979:1743. [Google Scholar]; (c) Del Bene JE, Perera AA, Bartlett RJ. J. Phys. Chem. A. 1999;103:8121. [Google Scholar]
Associated Data
This section collects any data citations, data availability statements, or supplementary materials included in this article.
Supplementary Materials
Supplementary Data. Experimental procedures and full spectral data for 5−13. Crystal structure data for 8a, and a plot of 1H NMR and IR signal position as a function of concentration for 8a.


