Abstract
We describe the resonance wavelength-dependent signal of absorptive particles in surface plasmon resonance (SPR)-based detection using both modeling and experimental results. The particles, gold nanocages, have a significant absorption cross-section in the nearinfrared (NIR), resulting in a wavelength-dependent refractive index as measured by SPR. The SPR signal due to the nanocages varies by 4-fold over resonance wavelengths from 650 nm to 950 nm. The greatest SPR signal occurs at the longest resonance wavelengths; its magnitude is due to the inherent increase in sensitivity of SPR on gold with increasing wavelength and the optical absorption properties of the nanocages.
Introduction
Signal amplification using particle tags is a common method of enhancing the surface plasmon resonance (SPR)-based detection of low molecular weight or low concentration analytes. Amplification tags have included secondary/tertiary antibodies1, latex particles2, 3, and liposomes4. The most effective tags for SPR-based detection are composed of materials that produce large changes in refractive index (RI) per unit volume of material. For this reason, there has been much interest in metal particle tags. Most notably, Lyon et al.5-7investigated the use of colloidal gold nanoparticles as amplification tags in SPR-based detection. Optical absorptive effects of the particles resulted in dramatic changes in the shape of the SPR curves. Specifically, SPR curves observed in the presence of the gold colloid were broadened and had a significantly increased minimum reflectivity as compared to SPR curves with no gold colloid on the surface. In these and additional studies8, 9, the amplification potential of colloidal gold particles at a single excitation wavelength was demonstrated.
The effect of the excitation wavelength on the interaction between the surface plasmon polariton field and nanometer-scale metal particles was investigated experimentally in several systems. Holland and Hall10, 11observed the greatest shift in the surface plasmon dispersion relation, in their system of silver islands on planar silver, at excitation wavelengths near the absorbance peak of the silver islands. Kume et al.12observed the largest degree of broadening and the greatest increase in minimum reflectivity of the surface plasmon curves, in their system of silver particles on planar aluminum, at excitation wavelengths matched to the absorbance peak of the silver particles. More recently, we reported the experimental observation of similar excitation wavelength-dependent effects in a system of gold nanocages on planar gold13.
The modulation of the surface plasmon reflectivity curve due to absorptive material has also been investigated theoretically by Kurihara et al.14, 15They presented a model for absorption-based SPR, treating the sample as a collection of Lorentz oscillators and the active metal layer as a Drude free electron gas. Most notably, their model of absorption-based SPR predicts that the direction of the shift of the resonance depends on the relationship between excitation frequency and sample peak absorption frequency. They also showed qualitative agreement between their model and experimental angle interrogation results from an absorption-based SPR sodium ion sensor.
In this report, we describe the resonance wavelength-dependent signal of alloyed gold/silver nanocages on planar gold using both modeling and experimental results. Our model, which incorporates particle absorption as in the work of Kurihara et al.14, 15, shows good agreement with experimental SPR curves. We find that the SPR signal, as quantified by the normalized sum of the absolute value of the difference curve, depends strongly on the resonance wavelength and varies by 4-fold across the wavelength range from 650 to 950 nm. The greatest SPR signal occurs at the longest resonance wavelengths and is due to a combination of the well-established inherent increase in sensitivity of SPR on gold with increasing wavelength16, 17and the optical absorption properties of the nanocages.
Experimental
Nanocage synthesis
A typical procedure for the synthesis of the gold nanocages18, 19follows. First, silver nanocubes were synthesized. Approximately 5 mL of ethylene glycol (EG, J. T. Baker, NJ) was heated at 149°C for 8 min under a 0.5 SLPM flow of nitrogen to quickly remove water. The solution was then heated under air for 52 min. Next, two 3 mL EG solutions were simultaneously injected into the hot EG at a rate of 45 mL per hour using a syringe pump (KDS-200, Stoelting, IL). One solution contained 94 mM silver nitrate (Sigma-Aldrich, MO), and the other solution contained 0.22 mM NaCl (Fisher Scientific, PA) and 144 mM poly(vinyl pyrrolidone) (PVP, Sigma-Aldrich, MO, M.W. ≈ 55,000). The PVP concentration was calculated in terms of the repeating unit. Magnetic stirring was applied throughout the synthesis. The solution typically turned yellow, orange, and then clear within the first hour after injection. After approximately 20 hours, the solution became orange-red, indicating the presence of 30 nm silver cubes. The reaction was terminated and the nanocubes were washed with acetone and then water before being dispersed in water for the galvanic replacement reaction. A solution of 5 mg poly(vinyl pyrridone) (Sigma-Aldrich, MO, M.W. ≈ 10,000) in 5 mL de-ionized water was heated to boiling and a 75-μL aliquot of a silver nanocube dispersion (8.1 mM silver) was added to the solution. This diluted dispersion of silver nanocubes was then refluxed for 2 min and then 750 μL of 0.2 mM HAuCl4aqueous solution was added at a rate of 0.8 mL/h using a syringe pump. The solution was refluxed for another 10 min until its color became stable. Vigorous magnetic stirring was applied during the entire process. After the solution cooled to room temperature, a white AgCl precipitate formed that was then dissolved by adding a saturated solution of NaCl. The mixture was then centrifuged at 10,000 rpm for 15 min, and the supernatant containing the dissolved AgCl was decanted. The product was rinsed with water and centrifuged twice, and finally re-dispersed in water until use.
Nanocage characterization
The particles were characterized using scanning electron microscopy (SEM) and atomic emission spectroscopy. SEM samples were prepared by putting a drop of product solution on a small piece of silicon wafer or a carbon-coated copper grid and then vacuum dried. SEM images were taken using a field-emission microscope (FEI, Sirion, OR) operated at acceleration voltages near 15 kV. Approximately 50 particles were analyzed to characterize their size distribution. The metal content of the nanocages was analyzed using an atomic emission spectrophotometer (Thermo Jarrel Ash Corp., MA) equipped with an inductively coupled plasma system. Emission lines at 242.8 nm and 328.0 nm were used to estimate the percentage of gold and silver within the final product. An absorption spectrum of the particles in solution was obtained using a diode array spectrophotometer (Hewlett-Packard, CA).
SPR measurements
The SPR instrument was a custom built Plasmon IV (Institute of Radio Engineering and Electronics [IREE], Czech Republic) with 4 independent channels. Briefly, light from a tungsten halogen lamp (Avantes, The Netherlands) was collimated, polarized, and coupled to the sample film via a BK-7 prism. The reflected light was then collected by a multichannel spectrometer. The SPR reflectivity spectrum was calculated from , where rTM(λ)was the spectrum acquired with transverse-magnetically-polarized light, rTE (λ)was the spectrum acquired with transverse-electrically-polarized light, and rdark(λ)was the dark spectrum (acquired with no incident light). To position the resonance minimum at a given wavelength, the angle of incidence was varied by adjustment of the rotation arms on the instrument (decreasing the angle of incidence increases the resonance wavelength).
SPR substrates were prepared by sputtering 2 nm Cr and 55 nm Au (TTS Ltd., Czech Republic) onto BK7 slides (Schott, Germany). The coated substrates were cleaned in a 5:1:1 solution of water, 30% hydrogen peroxide, and ammonium hydroxide for approximately 10 min at 40-70°C and then stored in water until use. The cleaned substrates were passivated with mercaptoethylamine (MEA from Sigma Aldrich, MO) by incubation in a 3 mM MEA in ethanol solution for approximately 3 h, followed by sonication in ethanol for 10 min. The flowcell was composed of the MEA-treated substrate as the base, a midlayer with channels defined in 70 μm mylar/adhesive, and a capping layer of acrylic. All solutions were hand-injected using syringes.
First, water was introduced into a channel and reflectivity spectra were acquired at the three resonance wavelengths of 674 nm, 777 nm, and 927 nm. Next, a nanocage solution of approximately 0.2 nM was introduced into the channel and incubated for approximately 30 min. The nanocage solution was then rinsed from the channel with approximately 10 system volumes of water and reflectivity spectra again acquired at the different resonance wavelengths. A reference channel containing water was monitored throughout the experiment and indicated that the effects of temperature and instrument drift were minimal. The surface coverage of nanocages for the sample was estimated by counting particles in 2 μm × 2 μm regions sampled over an area of 10 μm × 15 μm using SEM at acceleration voltages near 5 kV.
Modeling
The experimental data was modeled in a two-stage process. In each stage, optimization on multiple parameters was performed at the three experimental resonance wavelengths of 674 nm, 777 nm, and 927 nm to obtain the best fit to the experimental data. The SPR model was custom coded in MATLAB. Optimization was performed using a constrained branch and fit algorithm by Huyer and Neumaier20. The goodness-of-fit parameter was defined as a weighted sum of the squares of the difference between the experimental and simulated reflectivity curves. The weighting factor, the inverse square of the experimental reflectivity curve, was chosen to emphasize the region about the minimum of the SPR curve.
In the first stage, the MEA-only sample was modeled as a five-layer system composed of prism, chromium layer, gold layer, MEA layer, and water. Optimization to obtain the best fit to the experimental SPR curves for the MEA-only sample was performed simultaneously at the three resonance wavelengths. The refractive indices of the MEA layer and water, assumed to be constant with respect to wavelength, were modeled as 1.5 and 1.333 respectively. The dispersion relations of the prism, chromium, and gold layers were modeled using polynomial fits to values of the wavelength-dependent refractive indices reported in the literature. In the case of gold, the literature values corresponded to electropolished gold [110]21. It is expected that the RI of the sputtered gold layer used in the experiment will vary significantly from the RI of the electropolished gold. Thus, the imaginary part of the gold layer RI used in the model was subsequently allowed to vary to within 40% of the above literature values. The gold thickness was allowed to vary within 5% of the experimental target thickness of 55 nm. Additionally, the angle of incidence for each of the resonance wavelengths was allowed to vary in a range of ± 1°. An experimental angle spread of 0.3° was assumed (estimate from IREE) in all cases. Table 1lists the optimized values of the relevant parameters.
Table 1.
The table lists the model input parameters
| Parameter | Model |
|---|---|
| BK7 prism RI | Schott dispersion formula |
| BK7 thickness | Semi-infinite |
| Chromium RI | 8thorder polynomial fit to values from21 |
| Chromium layer thickness | 2.5 nm
(2 nm target for sputtered film by TTS) |
| Gold RI | See Figure 3dfor imaginary part
8thorder polynomial fit to values from 21for real part |
| Gold layer thickness | 58 nm
(55 nm target for sputtered film by TTS) |
| MEA RI | 1.521, 26 |
| MEA layer thickness | 0.527 |
| Nanocage absorption peak | 920 nm |
| Nanocage absorption FWHM | 214 nm |
| Nanocage layer thickness | 40 nm
(40+/-5 nm as measured from SEM images) |
| Nanocage oscillator strength | 4 ×10⁵ |
| Nanocage layer background ε | 1.803 (1.343) |
| Water RI | 1.333 |
| Water layer thickness | Semi-infinite |
| Angle spread | 0.3°
(estimate from IREE) |
In the second stage, the MEA-plus-nanocage sample was modeled as a six-layer system composed of prism, chromium layer, gold layer, MEA layer, nanocage layer, and water. The set of best fit parameters obtained for the five-layer system in the first stage was fixed, and the MEA-plus-nanocage sample was modeled at the three resonance wavelengths. The nanocage layer was modeled as a collection of Lorentz oscillators after Kurihara et al.14, 15The expression used for the permittivity of the nanocage layer is , where ω is the angular frequency of incident light, is the oscillator angular frequency, f(N) is the oscillator strength (proportional to the number density of particles, N), and is the oscillator damping angular frequency. Hereλmaxis the peak absorption wavelength of the nanocages,λFWHMis the full width at half maximum (FWHM) of the absorption peak of the nanocages, and cis the speed of light in vacuum. The parameter is the frequency-independent background permittivity. The parameters f(N),λFWHM,λmax , and were simultaneously varied under constrained optimization. The optimized values of these parameters are listed in Table 1.
Results and Discussion
An SEM image of the nanocages used for size characterization is shown in Figure 1. The average edge length was measured to be 40 ± 5 nm. The gold:silver ratio of the nanocages was approximately 4:1, producing an absorption peak in the near infrared (NIR) with a peak wavelength of 795 nm and a full width at half maximum (FWHM) of 150 nm for nanocages in solution. However, the absorption peak of the nanocages will be influenced by the proximity of the nanocages to the planar gold. Reports in the literature on other metal nanoparticles show that the absorption peaks are significantly red-shifted22, 23, consistent with the modeling results below. The surface coverage of the nanocages was estimated from SEM to be approximately 1×10⁹particles/cm2(approximately 10% of the area density of a close-packed monolayer). SPR measurements at three different surface coverages of similarly sized nanocages indicated that the maximum change in reflectivity is approximately linear with surface coverage below 3×10⁹particles/cm2(as measured by an alternate SPR-based instrument, data not shown).
Figure 1.
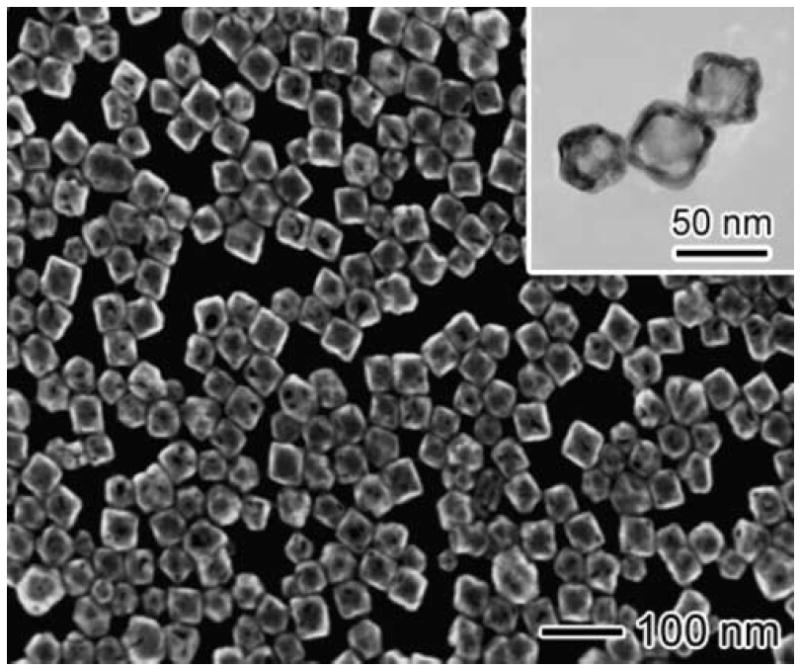
SEM image of the nanocages. The inset image was acquired with a transmission electron microscope. The nanocages were composed of gold and silver in a ratio of 4:1 and were approximately 40 nm ± 5 nm in edge length.
The SPR curves for the MEA-only sample and MEA-plus-nanocages sample at each of the three incident angles are shown in Figure 2. The nanocages produce three main effects on the SPR curve. The SPR curve is broadened with respect to the MEA-only curve, its minimum reflectivity increases, and its minimum is shifted to lower wavelengths (corresponding to greater incident angle, for angle interrogation measurements) with respect to the MEA-only sample. These results are consistent with the observations of Lyon et al.using gold colloid5-7. Most notably, the degree of modulationof the SPR curve depends on the resonance wavelength. At 674 nm, the effects, though measurable, are small in magnitude. The modulation effects are increased at 777 nm and greatest at 927 nm.
Figure 2.
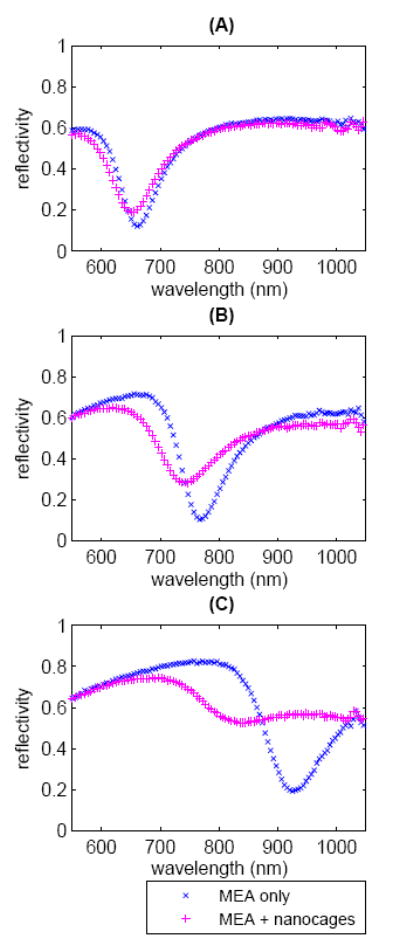
The SPR curves of the MEA-only sample and the MEA-plus-nanocages sample for the MEA resonance wavelength of (A) 674 nm, (B) 777 nm, and (C) 927 nm. The effects of the nanocages are to broaden, increase the minimum reflectivity of, and shift the resonance wavelength of the SPR curves.
The difference between the MEA-plus-nanocages sample and the MEA-only sample is shown in Figure 3, for three resonance wavelengths. One measure of the signal change due to absorptive particles used in previous reports5, 24is the maximum change in reflectivity; with this measure, the signal change due to nanocages is approximately 9% at 674 nm, 23% at 777 nm, and 37% at 927 nm. Alternative measures, which more completely describe the quantifiable difference in signal have been discussed in detail25. In this study, we use the normalized sum of the absolute value of the difference curve. Specifically, the sum of the absolute value of the difference curve is multiplied by the range of wavelengths interrogated and divided by the total number of data points in the range of wavelengths interrogated. Since this measure depends on the difference curve across the entire investigated wavelength range, it should be more sensitive to the nanocage-induced modulation of the SPR curve, as compared to the maximum change in reflectivity. The normalized sum of the absolute value of the difference curve is 15.3 for the resonance at 674 nm, 40.1 for the resonance at 777 nm, and 65.6 for the resonance at 927 nm.
Figure 3.
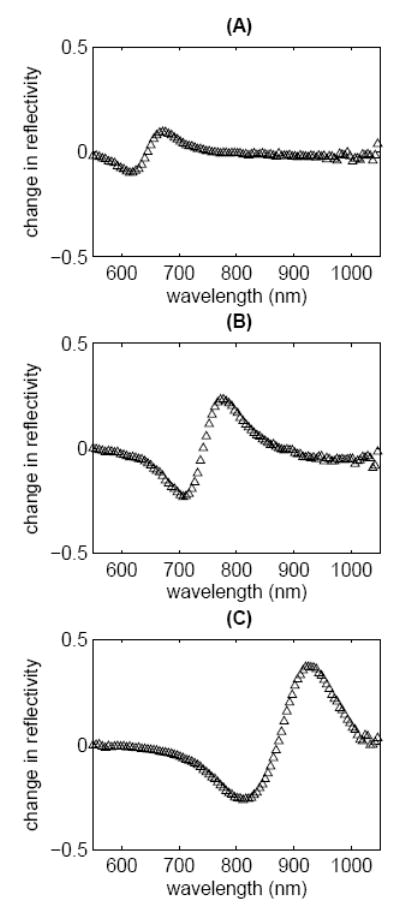
The difference curve of the MEA-plus-nanocages sample and the MEA-only sample for the MEA resonance wavelength of (A) 674 nm, (B) 777 nm, and (C) 927 nm. The normalized sum of the absolute value of the difference curve can be used to quantify the signal change due to the particles. The normalized sum is 15.3, 40.1, and 65.6 for case (A), (B), and (C), respectively.
The model and experimental SPR curves for the MEA-only sample at the three resonance wavelengths are plotted together in Figure 4A-Cand show good agreement. The imaginary part of the gold RI used in the model as well as the literature values for electropolished gold [110] are shown in Figure 4D. The model and experimental SPR curves for the MEA-plus-nanocages sample are shown in Figure 5A-C; here again, good agreement is observed between the model and experimental data. The optimized model results indicate a nanocage absorption peak centered at 920 nm with a FWHM of 214 nm. The imaginary part of the nanocage RI used to obtain the model results is shown in Figure 5D. The parameters used in the model are listed in Table 1.
Figure 4.
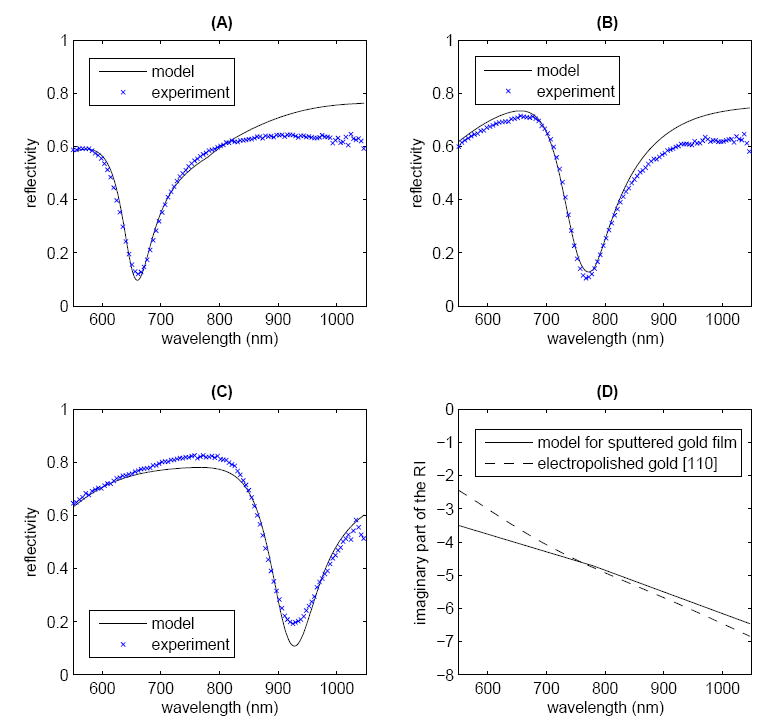
Comparison of model and experimental SPR curves for the experimental MEA resonance wavelength of (A) 674 nm, (B) 777 nm, and (C) 927 nm show good agreement. (D) The imaginary part of the RI of gold between 550 and 1050 nm. For comparison, the literature values for electropolished gold [110]21are also shown. The other model parameters are listed in Table 1.
Figure 5.
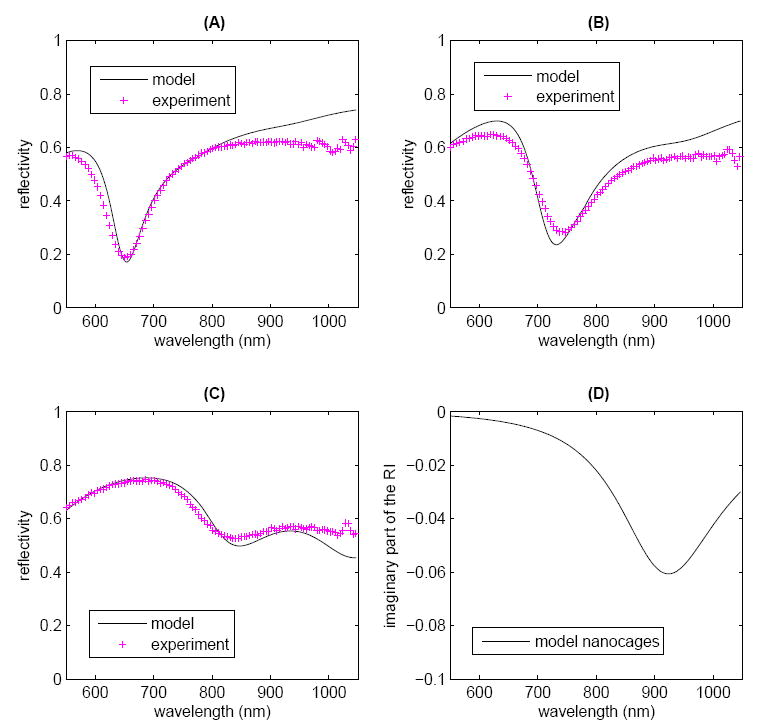
Comparison of model and experimental SPR curves for MEA plus nanocages for the experimental MEA resonance wavelength of (A) 674 nm, (B) 777 nm, and (C) 927 nm show good agreement. (D) The imaginary part of the RI of the nanocages between 550 and 1050 nm, used in the model. The other model parameters are listed in Table 1.
The SPR signal of the nanocages, as measured by the normalized sum of the absolute value of the difference curve, as a function of resonance wavelength is shown in Figure 6A. The model and experimental results indicate that the magnitude of the signal varies by 4-fold over the wavelength range investigated. This increase is due in part to the NIR absorption peak of the nanocages. However, a greater sensitivity is also achieved at longer wavelengths for non-absorptive samples on planar gold16, 17. Also shown for comparison is the model result of the signal change for the replacement (above the MEA layer) of a non-absorbing bulk solution with ΔRI=0.001 RIU. As expected, the non-absorbing bulk solution exhibits signal enhancement at the longer wavelengths, though less than the absorptive nanocages.
Figure 6.
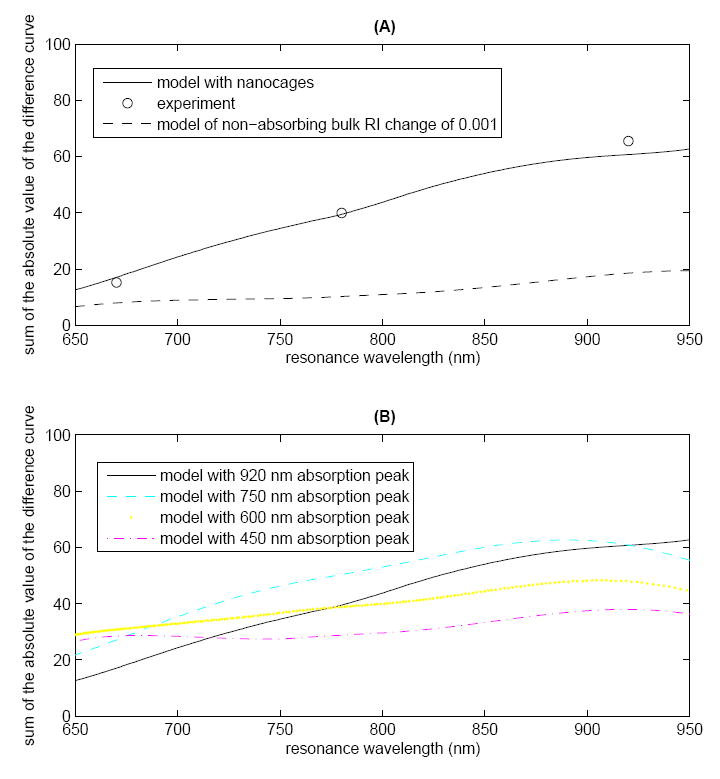
The SPR signal, the normalized sum of the absolute value of the difference curve of the MEA-only and the MEA-plus-nanocages samples, as a function of resonance wavelength. (A) Model results (solid line) are plotted for resonance wavelengths from 650 nm to 950 nm with the experimental data points (o) overlaid. For comparison, the model result of the signal change due to the replacement of a non-absorbing bulk solution with ΔRI=0.001 RIU above the MEA layer is shown (-). (B) Model results of the effect of shifting the wavelength of the particle absorption peak. All other parameters are unchanged. The results suggest that for a given resonance wavelength, the particle absorption peak wavelength does have a significant impact on the SPR signal. However, for a particle with a given absorption peak wavelength, the dominant effect is the greater sensitivity at longer wavelengths.
Model results of the effect of nanocage absorption peak wavelength on the SPR signal are shown in Figure 6B. All other parameters of the system are unchanged. Note that it would be impossible to synthesize nanocages that were similar in all respects except for the wavelength of the absorption peak. Nonetheless, these model results are useful for exploring the relative effects of 1) matching the wavelength of the particle absorption peak to the resonance wavelength and 2) using longer resonance wavelengths to enhance sensitivity. The results suggest that for a given resonance wavelength, the particle absorption peak wavelength does have a significant impact on the SPR signal. However, the dominant effect is the inherent greater sensitivity at longer wavelengths. In the context of the model, the greatest signal will be achieved at long resonance wavelengths for a particle with a long-wavelength absorption peak.
Conclusion
We have demonstrated the resonance wavelength-dependent SPR signal of nanocage particles using both modeling and experimental results. A simple model of SPR reflectivity incorporating the absorptive effects of the particles was demonstrated to be in good agreement with the experimental results. The SPR signal of the particles was shown to vary by a factor of 4 across the range of resonance wavelengths investigated and was greatest at the longest wavelengths. The magnitude of the SPR signal in the NIR was due to a combination of two effects: (1) the inherent increase of the SPR signal on gold at longer wavelengths and (2) the absorption peak of the particles in the NIR. The absorptive SPR model could serve as a useful tool to probe the relationship between particle absorption properties and the SPR signal as a function of resonance wavelength for a number of recently reported particles systems with tunable optical absorption properties.
Acknowledgments
The authors (EF, TC, and PY) gratefully acknowledge financial support from NIDCR grant number 1U01 DE014971. The authors gratefully acknowledge the Center for Nanotechnology at the University of Washington for the use of their facilities. EF thanks Marek Piliarik for helpful discussions.
Footnotes
Publisher's Disclaimer: This is a PDF file of an unedited manuscript that has been accepted for publication. As a service to our customers we are providing this early version of the manuscript. The manuscript will undergo copyediting, typesetting, and review of the resulting proof before it is published in its final citable form. Please note that during the production process errors may be discovered which could affect the content, and all legal disclaimers that apply to the journal pertain.
References
- 1.Naimushin A, Soelberg S, Bartholomew D, Elkind J, Furlong C. A portable surface plasmon resonance sensor system with temperature regulation. Sensors and Actuators B . 2003;96:253–260. [Google Scholar]
- 2.Besselink GAJ, Kooyman RPH, van Os P, Engbers GHM, Schasfoort RBM. Signal amplification on planar and gel-type sensor surfaces in surface plasmon resonance-based detection of prostate-specific antigen. Analytical Biochemistry. 2004;333:165–173. doi: 10.1016/j.ab.2004.05.009. [DOI] [PubMed] [Google Scholar]
- 3.Devries EFA, Schasfoort RBM, Vanderplas J, Greve J. Nucleic-Acid Detection with Surface-Plasmon Resonance Using Cationic Latex. Biosensors & Bioelectronics. 1994;9:509–514. [Google Scholar]
- 4.Wink T, van Zuilen S, Bult A, van Bennekom W. Liposome-mediated enhancement of the sensitivity in immunoassays of proteins and peptides in surface plasmon resonance spectroscopy. Analytical Chemistry. 1998;70:827–832. doi: 10.1021/ac971049z. [DOI] [PubMed] [Google Scholar]
- 5.Lyon L, Musick M, Natan M. Colloidal Au-enhanced surface plasmon resonance immunosensing. Analytical Chemistry. 1998;70:5177–5183. doi: 10.1021/ac9809940. [DOI] [PubMed] [Google Scholar]
- 6.Lyon LA, et al. Surface plasmon resonance of colloidal Au-modified gold films. Sensors and Actuators B-Chemical. 1999;54:118–124. [Google Scholar]
- 7.Lyon LA, Pena DJ, Natan MJ. Surface plasmon resonance of Au colloidmodified Au films: Particle size dependence. Journal of Physical Chemistry B. 1999;103:5826–5831. [Google Scholar]
- 8.Mitchell JS, Wu YQ, Cook CJ, Main L. Sensitivity enhancement of surface plasmon resonance biosensing of small molecules. Analytical Biochemistry. 2005;343:125–135. doi: 10.1016/j.ab.2005.05.001. [DOI] [PubMed] [Google Scholar]
- 9.Pieper-Furst U, Stocklein WFM, Warsinke A. Gold nanoparticle-enhanced surface plasmon resonance measurement with a highly sensitive quantification for human tissue inhibitor of metalloproteinases-2. Analytica Chimica Acta. 2005;550:69–76. [Google Scholar]
- 10.Holland WR, Hall DG. Optical-Properties of Metal Particles near Conducting Surfaces. Journal of the Optical Society of America. 1982;72:1747–1747. [Google Scholar]
- 11.Holland WR, Hall DG. Surface-Plasmon Dispersion-Relation - Shifts Induced by the Interaction with Localized Plasma Resonances. Physical Review B. 1983;27:7765–7768. [Google Scholar]
- 12.Kume T, Nakagawa N, Hayashi S, Yamamoto K. Interaction between Localized and Propagating Surface-Plasmons - Ag Fine Particles on Al Surface. Solid State Communications. 1995;93:171–175. [Google Scholar]
- 13.Fu E, et al. In: Microtas 2005 . Jensen K, Han J, Harrison D, Voldman J, editors. Boston : 2005. pp. 1510–1512. [Google Scholar]
- 14.Kurihara K, Nakamura K, Hirayama E, Suzuki K. An absorption-based surface plasmon resonance sensor applied to sodium ion sensing based on an ion-selective optode membrane. Analytical Chemistry. 2002;74:6323–6333. doi: 10.1021/ac0203241. [DOI] [PubMed] [Google Scholar]
- 15.Kurihara K, Suzuki K. Theoretical understanding of an absorption-based surface plasmon resonance sensor based on Kretchmann’s theory. Analytical Chemistry. 2002;74:696–701. doi: 10.1021/ac010820+. [DOI] [PubMed] [Google Scholar]
- 16.de Bruijn H, Kooyman R, Greve J. Choice of metal and wavelength for surface-plasmon resonance sensors: some considerations. Applied Optics. 1992;31:440–442. doi: 10.1364/AO.31.0440_1. [DOI] [PubMed] [Google Scholar]
- 17.Homola J. On the sensitivty of surface plasmon resonance sensors with spectral interrogation. Sensors and Actuators B. 1997;41:207–211. [Google Scholar]
- 18.Chen J, et al. Gold nanocages: Engineering the structure for biomedical applications. Advanced Materials. 2005;17:2255–2261. [Google Scholar]
- 19.Sun Y, Xia Y. Mechanistic study on the replacement reaction between silver nanostructures and chloroauric acid in aqueous medium. Journal of the American Chemical Society. 2004;126:3892–3901. doi: 10.1021/ja039734c. [DOI] [PubMed] [Google Scholar]
- 20.Huyer W, Neumaier A. SNOBFIT-Stable noisy optimization by branch and fit. 2006 Submitted to ACM Transactions on Mathematical Software. [Google Scholar]
- 21.Weast R, Lide D, Astle M, Beyer W, editors. CRC Handbook of Chemistry and Physics. CRC Press Inc; Boca Raton: 1989. [Google Scholar]
- 22.Okamoto T, Yamguchi I. Optical absorption study of the surface plasmon resonance in gold nanoparticles immobilized onto a gold substrate by self-assembly technique. The Journal of Physical Chemistry B. 2003;107:10321–10324. [Google Scholar]
- 23.Pinchuk A, Hilger A, von Plessen G, Kreibig U. Substrate effect on the optical response of silver nanoparticles. Nanotechnology. 2004;15:1890–1896. [Google Scholar]
- 24.Nelson B, Frutos A, Brockman J, Corn R. Near-infrared surface plasmon resonance measurements of ultrathin-films. 1. angle shift and SPR imaging experiments. Anal Chem. 1999;71:3928–3934. [Google Scholar]
- 25.Chinowsky T, Yee S. Quantifying the information content of surface plasmon resonance reflection spectra. Sensors and Actuators B. 1998;51:321–330. [Google Scholar]
- 26.Jung L. Chemistry . University of Washington; Seattle: 1999. [Google Scholar]
- 27.Ulman A. Formation and structure of self-assembled monolayers. Chemical Reviews. 1996;96:1533–1554. doi: 10.1021/cr9502357. [DOI] [PubMed] [Google Scholar]


