Abstract
In clinical practice, dentists must frequently bond adhesives to caries-affected dentin substrates, but the bond that characteristically forms with these substrates does not provide the durability necessary for long-term clinical function. The purpose of this study was to characterize and compare the interfacial chemistry of adhesive with caries-affected and noncarious dentin using micro-Raman spectroscopy. The results indicated that the differences in the Raman spectra between noncarious and caries-affected dentin could not be accounted for by simple decreased mineralization. Both the structure of collagen and mineral in the caries-affected dentin has been altered by the caries process. The differences in structure and composition not only interfered with acid-etching process but also subsequent resin monomer penetration. It was shown that the interface between the adhesive and caries-affected dentin was wider and more complicated than that of the adhesive and noncarious dentin. As a result of adhesive phase separation, a structurally integrated hybrid layer did not form at the interface with either caries-affected or non-carious dentin. Using chemical imaging techniques, this study provides the direct evidence of adhesive phase separation at the interface with caries-affected dentin. Although our group previously reported adhesive phase separation at the interface with noncarious dentin, the chemistry of caries-affected dentin leads to greater variability and a more highly irregular composition along the length and breadth of the interface.
Keywords: dentin bonding, dental adhesive, interface, collagen, carious dentin
INTRODUCTION
Bonding to dentin depends not only on adhesive systems but also on dentin bonding substrates. Most dentin bonding studies are done on sound, flat, polished noncarious dentin. Although the results are of great value regarding the effectiveness of a particular bonding system or for comparative purposes, noncarious dentin is not the substrate most frequently involved in clinical dentistry. Instead, dentists usually must bond adhesives to irregular dentin substrates such as carious dentin. Carious dentin can be classified into outer caries-infected dentin and inner carious-affected dentin. After caries excavation, the majority of the bonding surface is composed of caries-affected dentin.1,2
Since caries-affected dentin substrates frequently appear as small areas within many cavity preparations and current bond strength test techniques generally require much larger bonding areas, it has been very difficult to prepare conventional bond strength specimens using these clinically relevant substrates. Consequently, there is very limited information about bonding to these clinically relevant substrates. In the menagerie of bond strength tests, the microtensile test can utilize dentin specimens with cross-sectional bond testing areas as small as 0.25 mm2. Thus, this testing approach may be more appropriate for testing adhesive bond strength to caries-affected dentin substrates.3 Using the microtensile test technique, it has been reported that the bond strengths to caries-affected dentin substrates were significantly lower than the bond strengths to noncarious dentin obtained from the same tooth at the same dentin depth.4–7
SEM and TEM observations of adhesive/caries-affected dentin interfaces showed a much thicker hybrid layer than was seen with noncarious dentin.7,8 Presumably, the thicker hybrid layer in caries-affected dentin may be due to the fact that caries-affected dentin is partially demineralized and more porous than noncarious dentin. This hypomineralized, porous substrate may allow deeper penetration of the acid etchant, leading to a deeper demineralization with diffused monomer. However, it is not clear why there is a poor relationship between hybrid layer thickness and bond strength. It has been speculated that the structure of the caries-affected dentin substrates might interfere with dentin hybridization.5,7 Nevertheless, the understanding of these dentin substrates and how they effect adhesive penetration is very limited because chemical characterization techniques were not available. Thus, the factors and mechanisms involved in the very low bond strengths to caries-affected dentin and premature failure of the adhesive bond to these clinically relevant dentin substrates remain unclear.
Micro-Raman spectroscopic (μRS) studies from this laboratory have provided direct and quantitative measurement of the concentration of adhesive within the hybrid layer.9,10 To date, there has not been an investigation of the difference in the chemistry of the adhesive/noncarious dentin versus adhesive/caries-affected dentin interfaces. The purpose of this study was to compare the molecular and chemical structure at the interfaces between adhesives and noncarious or caries-affected dentin.
MATERIALS AND METHODS
Specimen preparation
Three extracted unerupted human third molars and three extracted human third molars with coronal caries were collected from the Oral Surgery Clinic at the University of Missouri-Kansas City (UMKC) School of Dentistry. The teeth were collected after the patient’s informed consent was obtained under a protocol approved by the UMKC adult health sciences institutional review board. Following extraction, the teeth were placed in separate vials containing 0.9% phosphate buffered saline and 0.002% sodium azide and stored at 4°C. For noncarious teeth, initial specimen preparation proceeded as follows: the occlusal one-third of the crown was sectioned perpendicular to the long axis of the tooth by means of a water-cooled low speed diamond saw (Buehler, Lake Bluff, IL). The exposed dentin surfaces were inspected with a microscope to ensure that no enamel remained. A uniform smear layer was created by abrading the exposed dentin surface with 600-grit SiC under water for 30 s.11
The preparation of caries-affected dentin specimens followed the technique described by Nakajima et al.4,12 Characteristically, carious dentin is described as consisting of infected and affected layers. The affected layer is generally not removed during treatment. The infected layer is removed by grinding the specimens using 600-grit SiC under running water. The carious occlusal surface was ground perpendicular to the long axis of the tooth until a flat surface composed of the caries-affected dentin surrounded by non-carious dentin is exposed. This process was facilitated by the use of caries detector solution (CarieStain; Parkell, Farming-dale, NY) and visual inspection. Then the specimen was longitudinally sectioned using same water-cooled diamond saw as before through the caries-affected dentin; the section with larger area of affected dentin was used for the adhesive treatment, and another section with smaller area was used for the micro-Raman analysis.
Both the prepared noncarious dentin as well as prepared caries-affected dentin specimens were treated with a current commercial dentin adhesive Single Bond (3M ESPE Dental Products, St. Paul, MN). The application of the adhesive followed the manufacturer’s instructions. The prepared dentin surfaces were etched for 15 s with 35% phosphoric acid. After acid etching, the teeth were rinsed with water for 10 s and blotted dry, leaving the dentin surface moist. Two consecutive coats of Single Bond were applied with a fully saturated brush. The surface was gently dried for 5 s and light-cured (550 mW/cm2, Spectrum® 800; Densply, Milford, DE) for 20 s. These specimens were stored for a minimum of 24 h in H2O at 37°C before proceeding with subsequent sectioning; the treated dentin surfaces were cut perpendicular and parallel to the bonded surface in 2-mm increments by means of a H2O-cooled low-speed diamond saw. The specimens were then cut at a depth of ~2 mm below the interface to create a number of resin bonded beams or slabs. The final dimensions of these slabs were 10 × 2 × 2 mm3.
Micro-Raman spectroscopy
The adhesive/dentin interface specimens were mounted and covered with distilled water in preparation for μRS analysis. Raman spectra were recorded using a Jasco NRS-2000 Raman spectrometer, which consisted of an argon ion laser beam (514.5 nm) focused through a 60× Olympus Plan Neofluor water-immersion objective (NA 1.2) to a ~1.5 μm beam diameter. Raman back-scattered light was collected through the objective and resolved with a monochromator. The spectra were recorded with a liquid nitrogen-cooled charge-coupled device detector. The slit width of the spectrograph was set at 140 μm, providing a spectral resolution of 8 cm−1. Spectra were recorded at positions corresponding to 1-μm intervals across the adhesive/dentin interface with the use of the computer-controlled x-y-z stage. With a minimum step width of 50 nm, two consecutive scans of spectra (with 60 s accumulation time each) were obtained from each site. The laser power was ~3 mW, no thermal damage of the tissue specimens was observed during measurement. Spectra were Raman shift frequency calibrated using known lines of neon and silicon.
RESULTS
Representative Raman spectra of noncarious and caries-affected dentin are presented in Figure 1. All spectra were recorded in the region of 877–1785 cm−1, which covers the fingerprint region associated with dentin mineral and collagen. The principal Raman active peaks associated with dentin have been well assigned. The most intense peak at 961 cm−1 (ν1 symmetric stretch, ) is assigned to the dentin mineral phosphate. The peak at 1070 cm−1 (ν1 symmetric stretch, ) is assigned to the mineral carbonate. The dentin collagen matrix features are present at 1667 (backbone amide I), 1452 (CH2), 1273 (amide III), and 1242 cm−1 (amide III). Particular areas of the spectrum which had been used to examine specific aspects of mineralized tissue are then examined. The differences between the mineral features of the spectra are clearly noticed in the region of 877–1100 cm−1, with the mineral (phosphate and carbonate)/collagen ((961 and 1070)/1452) ratios significantly smaller for caries-affected dentin when compared with noncarious dentin.
Figure 1.
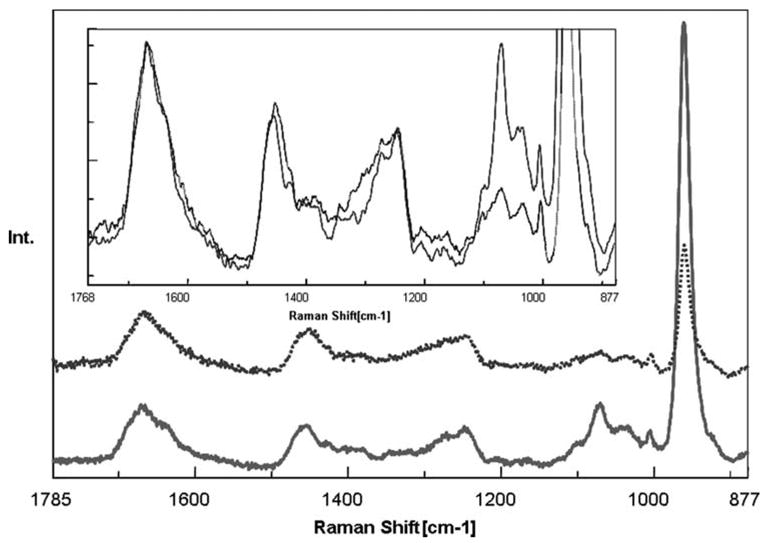
Raman spectra of noncarious dentin (solid line) and caries-affected dentin (dotted line) in the region of 1785–877 cm−1. The expanded view was presented in the inset area. [Color figure can be viewed in the online issue, which is available at www.interscience.wiley.com.]
The spectral features correlated with the collagen component in caries-affected dentin are more or less similar to those of noncarious dentin. The slight differences are shown in the expanded view of Figure 1. Amide peaks are thought to be representative of protein conformation. The position and intensity of these peaks (amide I and III) are typical of collagen fibril with a triple helical structure. In a careful comparison of this spectral region of caries-affected and noncarious dentin, both the amide I and III peaks were broader in caries-affected dentin. This broadening, in corroboration with the relative peak shift at 1452 cm−1, suggests that the collagen in caries-affected dentin may undergo micro-structural changes during the caries process.
Representative mapping spectra collected at 1-μm intervals across the adhesive/noncarious dentin interfaces are shown in Figure 2(A). The peaks associated with the adhesive occur at 1720 (carbonyl), 1609 (phenyl C=C), 1454 (CH2), 1113 cm−1 (C—O—C); the major peaks assigned to the dentin appear at 1667 (amide I), 1242 (amide III), and 961 cm−1 (P—O). As shown in Figure 2(A), the first four spectra were acquired from pure adhesive. The Raman peak of the P—O group in the thirteenth spectrum suggested that this represented the floor of the demineralized dentin layer. A contour plot over the spectral windows of 877–1785 cm−1 and a spatial range of 18 μm over the adhesive/noncarious dentin interface was shown in Figure 2(B), with color corresponding to the intensity of the Raman scattered light. Red represents high intensity and dark blue represents low intensity. The plot is oriented such that the adhesive is in the lower aspect of the image and dentin is in the upper aspect. The decreased intensity of the Raman peaks attributed to the adhesive (1720, 1609, 1454, 1113 cm−1) as a function of position indicates the gradual decline of adhesive infiltration into dentin. The peaks at 1720, 1609, 1113 cm−1 begin to decrease in intensity at 4 μm and the peak at 1454 cm−1 begins to decrease at 8 μm. The commercial adhesive used in the study consists of hydrophilic HEMA and hydrophobic BisGMA components. The peak at 1454 cm−1 is assigned to the CH2 group of both BisGMA and HEMA, while the other three peaks are assigned to BisGMA only. The abrupt decrease in intensity of these three peaks indicates that BisGMA resists to penetrating into the demineralized dentin. The intensity assigned to the dentin mineral (961) is no longer detectable in the interface zone, indicating that the mineral has been removed from this region during acid etching. Overall, the image qualitatively suggests the adhesive does not infiltrate to the depth of the dentin demineralization.
Figure 2.
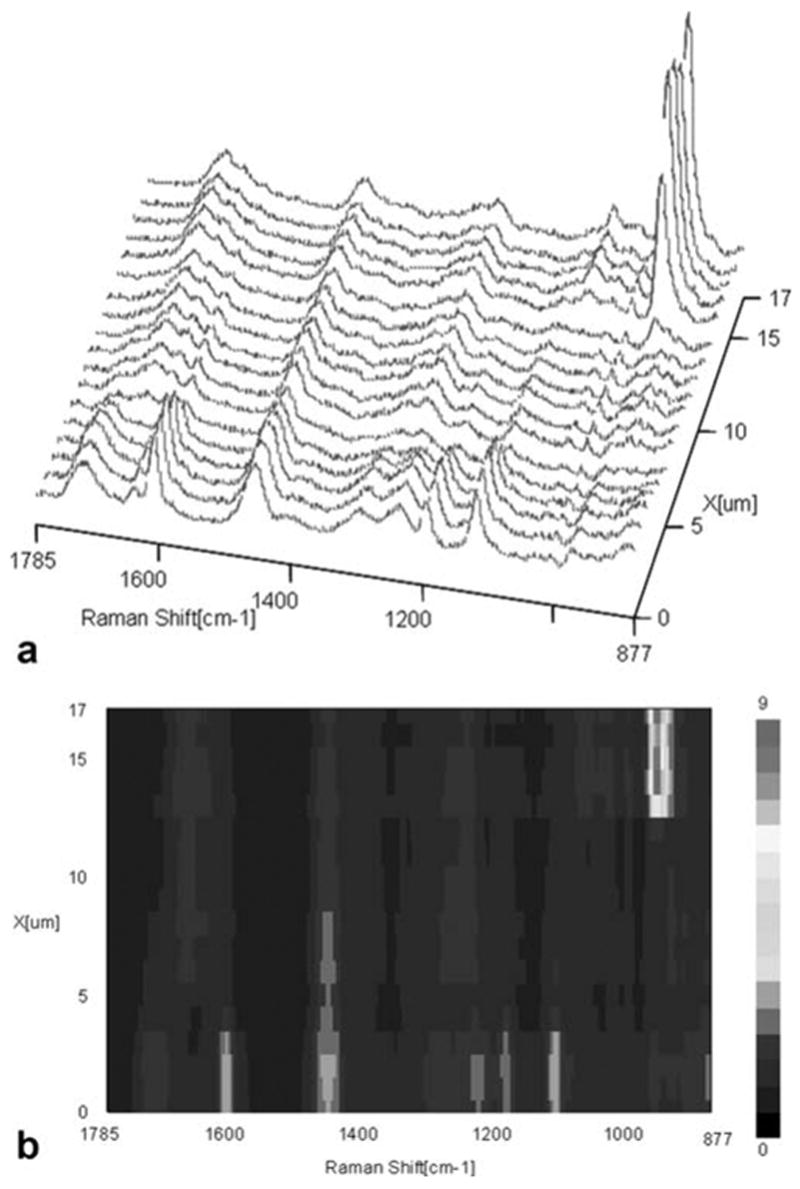
Micro-Raman mapping spectra acquired at 1-μm intervals across the SB adhesive/noncarious dentin interface (A); a contour plot over the spectral windows of 877–1785 cm−1 and a spatial range of 18 μm over the adhesive/noncarious dentin interface (B). [Color figure can be viewed in the online issue, which is available at www.interscience.wiley.com.]
Representative mapping spectra collected at 1-μm intervals across the adhesive/caries-affected dentin interfaces are shown in Figure 3(A). The first several spectra were acquired from pure adhesive. The Raman peak at 961 cm−1 starts to increase at 30 μm, indicating that this is the floor of the demineralized dentin layer. A contour plot over the spectral windows of 877–1785 cm−1 and a spatial range of 40 μm over the adhesive/caries-affected dentin interface was shown in Figure 3(B). The image shows a wider and more complicated interface than the adhesive/noncarious dentin interface reported in Figure 2(A,B). Very weak spectral features/signals appear at 4–5 μm, acquired from the region close to the bonded caries-affected dentin surface. Based on visual examination by light microscopy, this phenomenon may be due to the gap frequently existing between adhesive and caries-affected dentin. Very limited contribution from spectral features assigned to the adhesive is noted beyond ~8 μm. The Raman intensity assigned to BisGMA declines abruptly while the peak at 1454 cm−1 extends deeper into the interface.
Figure 3.
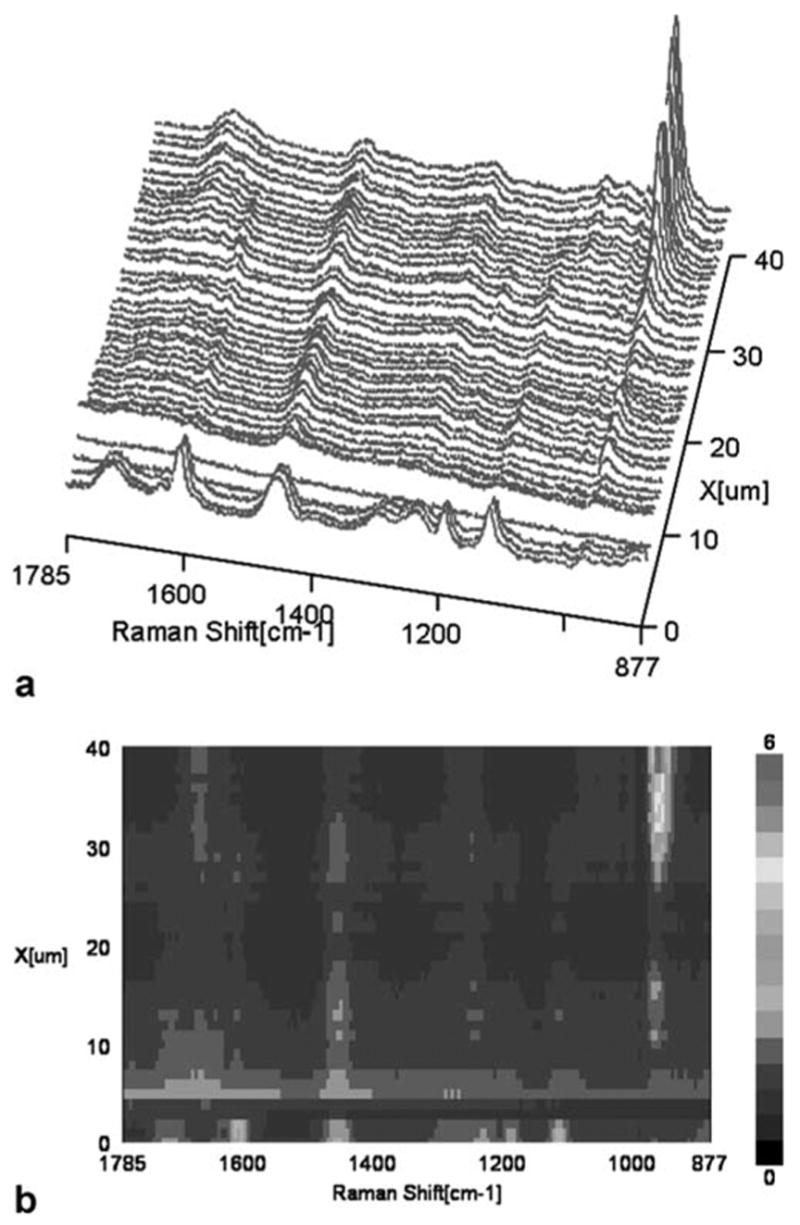
Micro-Raman mapping spectra acquired at 1-μm intervals across the SB adhesive/caries-affected dentin interface (A); a contour plot over the spectral windows of 877–1785 cm−1 and a spatial range of 40 μm over the adhesive/caries-affected dentin interface (B). [Color figure can be viewed in the online issue, which is available at www.interscience.wiley.com.]
The intensity assigned to the mineral is still detectable in the adhesive/caries-affected dentin interface zone, indicating that the mineral was not totally removed from this region during acid etching. In situ spectra acquired from the acid-etched and nonacidetched caries-affected dentin are shown in Figure 4. The phosphate peak is shifted from 961 to 965 cm−1 and its width has increased. This might arise from the alteration of apatite to other phosphates such as tricalcium phosphate.
Figure 4.
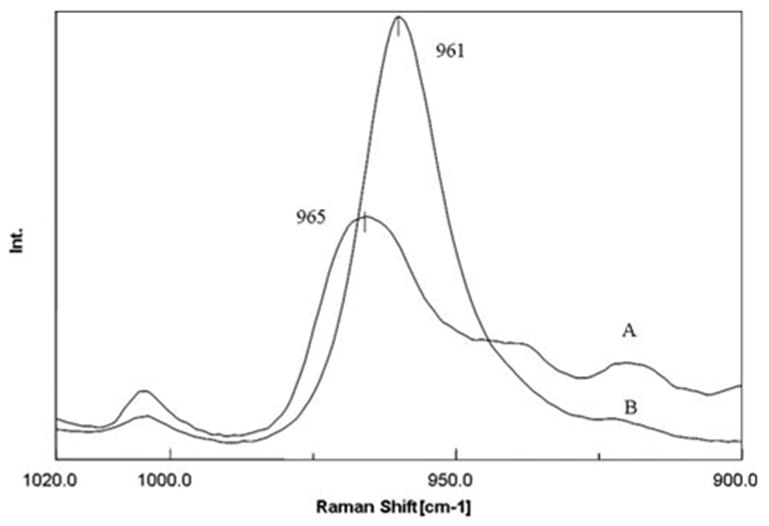
In-situ Raman spectra recorded from the acid-etched (A) and nonacid-etched (B) caries-affected dentin at the adhesive/caries-affected dentin interface. [Color figure can be viewed in the online issue, which is available at www.interscience.wiley.com.]
Figures 5 and 6 represent the adhesive penetration and degree of dentin demineralization as a function of depth at the interfaces with noncarious and caries-affected dentin, respectively. The adhesive penetration and degree of demineralization across the interface was combined into one figure. To determine differences in adhesive penetration as a function of spatial position across the interfaces, the ratios of the relative integrated intensities of the spectral features associated with the adhesive and collagen (1667 cm−1, amide I) were calculated.13 The peak at 1454 cm−1, which is assigned to both BisGMA and HEMA, and the peak at 1113 cm−1, which is assigned to the C—O—C group of BisGMA, were used to monitor the resin adhesive and BisGMA concentration. At both the interfaces, the ratio of 1454/1667 (HEMA+BisGMA/collagen) shows a gradual decline, while the ratio of 1113/1667 (BisGMA/collagen) shows a dramatic decrease in the concentration of BisGMA monomer across the interfaces. When compared with the HEMA component, BisGMA shows less diffusion across both interfaces. The degree of adhesive penetration was higher in the first several micrometers within the interfacial region of the noncarious dentin when compared with the caries-affected dentin.
Figure 5.
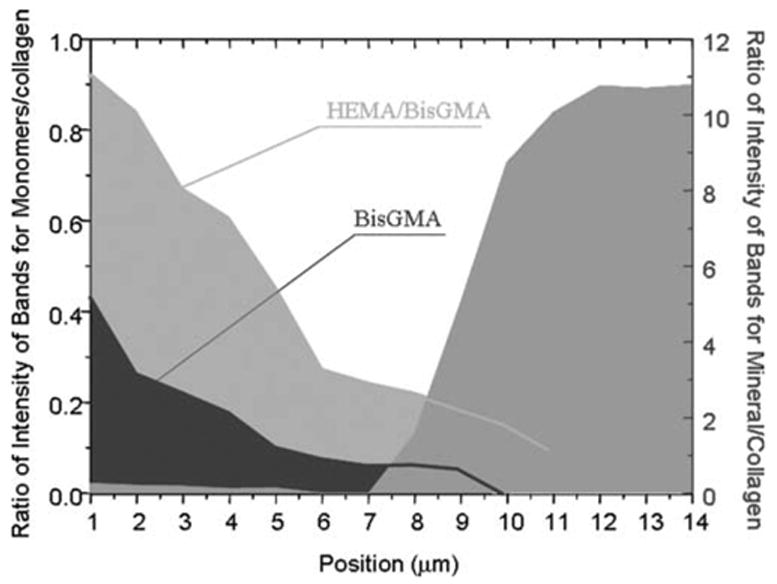
Penetration of HEMA/BisGMA monomers and degree of demineralization as a function of spatial position across the adhesive/noncarious dentin interface. The position 1 is related to the first micrometer in the interface. [Color figure can be viewed in the online issue, which is available at www.interscience.wiley.com.]
Figure 6.
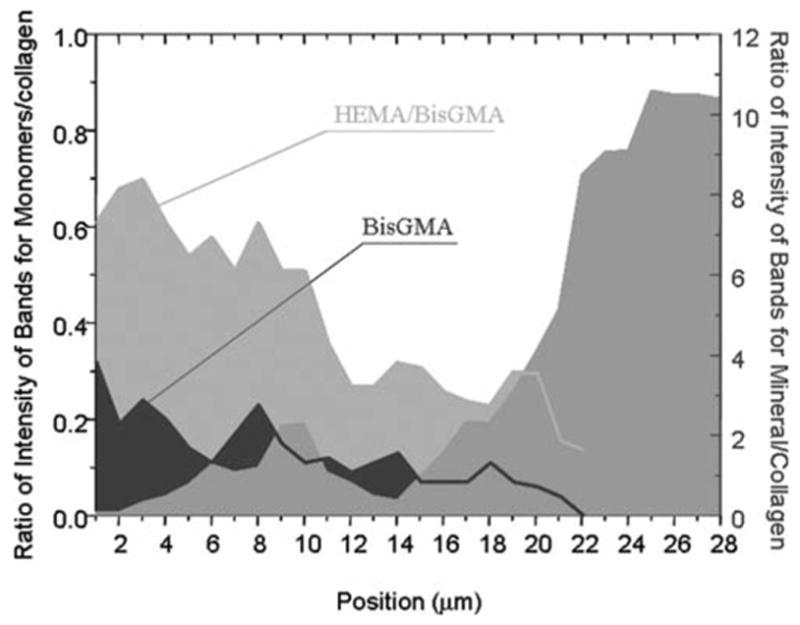
Penetration of HEMA/BisGMA monomers and degree of demineralization as a function of spatial position across the adhesive/caries-affected dentin interface. The position 1 is related to the first micrometer in the interface. [Color figure can be viewed in the online issue, which is available at www.interscience.wiley.com.]
The extent of dentin demineralization was determined based on the ratios of the relative integrated intensities of the spectral features from the mineral (961 cm−1, P—O) and collagen (1452, CH2) (mineral/matrix ratios). Noncarious dentin was demineralized to a depth of ~7–8 μm (Fig. 5). In comparison, the depth of demineralization in caries-affected dentin was ~14–16 μm (Fig. 6). The profile of demineralization in caries-affected dentin was more complicated, and the mineral existed across the interface. The spectroscopic results suggested that majority of the demineralized dentin matrix in both noncarious dentin and caries-affected dentin was not protected by the adhesive, especially the critical BisGMA dimethacrylate component. This zone was even wider in the caries-affected dentin due to deeper demineralized layer.
DISCUSSION
Caries-affected dentin includes several zones such as transparent, subtransparent and apparently normal zones under the transparent zone. The caries-affected transparent zone is usually thought to be harder than noncarious dentin due to occlusions of the dentin tubules with mineral in transparent zone. However, it has been reported that the transparent layer in caries-affected dentin can be softer than noncarious dentin.14 Using AFM nanoindentation, Marshall et al. measured the mechanical properties of caries-affected transparent dental layers.15 It was found that carious-affected dentin showed either little change or lower values of elastic modulus and hardness, which was not significantly different from the underlying noncarious dentin zone.16 Using electron microscopy, it was demonstrated that intermolecular crosslinks of collagen fibrils still remained in the caries-affected dentin, and collagen fibrils were present with distinct banding structure closely resembling those in noncarious dentin.17,18 There has been limited information on the chemical structure of the caries-affected dentin substrates.
The current Raman results suggested some structural or chemical alterations in dentin when comparing caries-affected and noncarious dentin. The mineral phosphate and carbonate content decreased in the caries-affected region of dentin when compared with noncarious dentin. The mineral composition is also different from that of normal apatite due to cyclic demineralization–remineralizations. The relative intensity of the mineral carbonate peak at 1070 cm−1 decreased dramatically in the caries-affected dentin, indicating that carbonate ions are easily dissolved in the caries process.19 However, the differences between noncarious and caries-affected dentin went beyond mineral differences. The secondary structure of collagen in the caries-affected dentin also appeared to be slightly altered by the caries process as noted by spectral changes in the amide I and III regions (Fig. 1).
The modifications of composition and structure in the caries-affected dentin also induced big differences in the interfacial profile between the adhesive and dentin when compared with non-carious dentin. The micro-Raman analysis provided a comprehensive representation of the extent of dentin demineralization, the depth of demineralization, adequacy of adhesive resin penetration, and the width of the hybrid layer. It was shown that the interface between the adhesive and caries-affected dentin was wider and more complicated than that of the adhesive and noncarious dentin. The depth of demineralization in the caries-affected dentin was twofold deeper than that in the noncarious dentin. The adhesive monomers infiltrated the depth of demineralized noncarious dentin, and the penetration gradually declined across the interface in noncarious dentin; however, the penetration of adhesive monomers was nonregularly distributed and declined across the wider depth of demineralization in the caries-affected dentin.
The spectroscopic results indicated that etched caries-affected dentin created a different type of demineralized zone from that created in noncarious dentin. The presence of caries-affected dentin resulted in deeper and nonuniform acid etching of dentin. The differences in the demineralization depth may be due to the fact that the caries-affected dentin is partially demineralized. As shown in Figure 1, the relative mineral/matrix ratio (961/1452) in noncarious dentin was much higher than the ratio in carious-affected dentin. Thus, the carious-affected dentin is more susceptible to the effect of acid etching, which results in the formation of a deeper demineralized layer. In addition, the demineralized layer in the carious-affected dentin still contains more residual mineral when compared with that in noncarious dentin (Figs. 5 and 6). The use of phosphoric acid in the SB system was insufficient to remove most of the mineral in the caries-affected dentin. It has been reported that the caries-affected dentin contains deposits of β-tricalcium phosphate (β-TCP) (also called whitlockite) in the dentinal tubules.20,21 The β-TCP is less soluble than hydroxyapatite at a pH < 5.5.22 By comparing the in-situ spectrum of residual mineral (Fig. 4) with the spectrum of β-TCP,23 it is confirmed that majority of the residual mineral is composed of the acid-resistant TCP deposits. Since these mineral deposits restrict access of the acid to the dentin, the presence of these tubule deposits alters the demineralization process within the caries-affected dentin, thus inducing a complex, partly demineralized layer.
The blockage of the tubule lumina by mineral deposits not only interfered with acid etching process but also subsequent resin monomer penetration. The presence of mineral deposits and partial demineralization cause disproportional, nongradient infiltration of resin monomers into the caries-affected dentin substrates. This difference in interfacial chemical profile might have been caused by less lateral diffusion of resin monomer from the dentin tubules. In other words, the occlusion of the tubules by mineral crystals prohibits the use of dentin tubules as paths for resin monomer infiltration. The resin monomer penetration can only occur through narrow, interfibrillar diffusion channels. In addition, the deeper partially demineralized layer results in more residual water after rinsing the acid-etched dentin. The wet bonding technique will further promote an overwet condition. This excess water would interfere with resin monomer penetration, complicate the interfacial integrity, and compromise the photopolymerization.13 It has been previously reported that the SB adhesive used in this study undergoes physical separation into hydrophobic and hydrophilic phases under wet conditions.24 The divergence between the depth of resin monomer infiltration and that of demineralization in both noncarious and caries-affected dentin was clearly observed by combining the information into one figure (Figs. 5 and 6). In the both cases, the hydrophilic HEMA monomer tends to penetrate into the depth of demineralized layer, while the hydrophobic BisGMA monomer exhibits less than adequate penetration into the demineralized dentin. The results indicated that the problems associated with phase separation observed in noncarious dentin can be extended to include caries-affected dentin. However, there was a big difference in the width of demineralized matrix that exhibited very limited contribution from BisGMA between both interfaces. Nearly ~14–16 μm of the demineralized matrix in the caries-affected dentin was not protected by the critical BisGMA, which contributes most to the crosslinked resin.
In the previous studies, it has been suspected that the strength of bonding to caries-affected dentin is lower than that to noncarious dentin due to a thicker hybrid layer that is not completely penetrated by the resin.8 However, there were no objective measures of structure and composition of the infiltrated resins and the hybrid layer. This study represents, to the best of our knowledge, the first to characterize chemical structure of the adhesive/caries-affected dentin interface using μRS. Results from the present study provide direct spectroscopic evidence of a wide, complicated interface with limited resin contribution in the caries-affected dentin. The use of phosphoric acid might be too aggressive for the already partially demineralized caries-affected dentin. However, stronger acids or longer etching times were originally suggested for solubilization of acid resistant mineral deposits within the caries-affected tubule lumens,4,5` since it was speculated that the lower bond strengths of caries-affected dentin might be due to the lack of resin penetration into the tubules to form resin tags.4 This study suggests that the majority of the residual mineral deposits were β-TCP, which is very resistant to acid dissolution even after a long exposure time. Thus, if a longer etching time was used to potentially dissolve the β-TCP, the longer etching time would also produce a deeper, more complex demineralized layer, which is more resistant to adhesive resin penetration. The current results indicate that bonding to caries-affected dentin might require specific etching treatments that have not yet been defined.
CONCLUSION
This study provided clear, direct evidence of distinct differences in the depth of dentin demineralization and degree of adhesive infiltration in noncarious and caries-affected dentin. It was shown that the interface between the adhesive and caries-affected dentin was wider and more complicated than that of the adhesive and noncarious dentin. The chemistry and structure of caries-affected dentin lead to greater variability and highly irregular composition across the interface. It appears that the structure of mineral and collagen in the caries-affected dentin has been slightly altered by the caries process. Although the modifications are small, it is suspected that secondary structure changes in collagens fibrils when lacking adequate adhesive protection might adversely affect the long-term durability of the dentin bond. For example, the exposed, altered collagen may be more susceptible to further collagen disorganization or denaturation in the clinical environment. Future studies should be performed to determine what effect these structural differences have on the adhesive/dentin bond following aqueous aging.
Footnotes
Contract grant sponsor: National Institute of Dental and Craniofacial Research, National Institutes of Health; contract grant numbers: DE 014392, DE 015281
References
- 1.Fusayama T. Two layers of carious dentin: Diagnosis and treatment. Oper Dent. 1979;4:63–70. [PubMed] [Google Scholar]
- 2.Marshall GW, Marshall SJ, Kinney JH, Balooch M. The dentin substrate: Structure and properties related to bonding. J Dent. 1997;25:441–458. doi: 10.1016/s0300-5712(96)00065-6. [DOI] [PubMed] [Google Scholar]
- 3.Pashley DH, Sano H, Ciucchi B, Yoshiyam M, Carvalho RM. Adhesion testing of dentin bonding agents: A review. Dent Mater. 1995;11:117–125. doi: 10.1016/0109-5641(95)80046-8. [DOI] [PubMed] [Google Scholar]
- 4.Nakajima M, Sano H, Burrow MF, Tagami J, Yoshiyama M, Ebisu S, Ciucchi B, Russell CM, Pashley DH. Tensile bond strength and SEM evaluation of caries-affected dentin using dentin adhesives. J Dent Res. 1995;74:1679–1688. doi: 10.1177/00220345950740100901. [DOI] [PubMed] [Google Scholar]
- 5.Nakajima M, Sano H, Urabe I, Tagami J, Pashley DH. Bond strengths of single-bottle dentin adhesives to caries-affected dentin. Oper Dent. 2000;25:2–10. [PubMed] [Google Scholar]
- 6.Yoshiyama M, Sano H, Ebisu S, Tagami J, Carvalho RM, Johnson MH. Regional strengths of bonding agents to cervical sclerotic root dentin. J Dent Res. 1996;75:1404–1413. doi: 10.1177/00220345960750061201. [DOI] [PubMed] [Google Scholar]
- 7.Yoshiyama M, Urayama A, Kimochi T, Matsuo T, Pashley DH. Comparison of conventional vs self-etching adhesive bonds to caries-affected dentin. Oper Dent. 2000;25:163–169. [PubMed] [Google Scholar]
- 8.Yoshiyama M, Tay FR, Doi J, Nishitani Y, Yamada T, Itou K, Carvalho RM, Nakajima M, Pashley DH. Bonding of self-etch and total-etch adhesives to carious dentin. J Dent Res. 2002;81: 556–560. doi: 10.1177/154405910208100811. [DOI] [PubMed] [Google Scholar]
- 9.Spencer P, Wang Y, Walker MP, Wieliczka DM, Swafford JR. Interfacial chemistry of the dentin/adhesive bond. J Dent Res. 2000;79:1458–1463. doi: 10.1177/00220345000790070501. [DOI] [PubMed] [Google Scholar]
- 10.Wang Y, Spencer P. Hybridization efficiency of the adhesive dentin interface with wet bonding. J Dent Res. 2003;82:141–145. doi: 10.1177/154405910308200213. [DOI] [PubMed] [Google Scholar]
- 11.Wang Y, Spencer P. Analysis of acid-treated dentin smear debris and smear layers using confocal Raman microspectroscopy. J Biomed Mater Res. 2002;60:300–308. doi: 10.1002/jbm.10108. [DOI] [PubMed] [Google Scholar]
- 12.Nakajima M, Sano H, Zheng L, Tagami J, Pashley DH. Effect of moist vs. dry bonding to normal vs. caries-affected dentin with Scotchbond Multi-Purpose Plus. J Dent Res. 1999;78:1298–1303. doi: 10.1177/00220345990780070301. [DOI] [PubMed] [Google Scholar]
- 13.Wang Y, Spencer P. Interfacial chemistry of class II composite restoration: Structure analysis. J Biomed Mater Res A. 2005;75: 580–587. doi: 10.1002/jbm.a.30451. [DOI] [PubMed] [Google Scholar]
- 14.Ogawa K, Yamashita Y, Ichijo T, Fusayama T. The ultrastructure and hardness of the transparent layer of human carious dentin. J Dent Res. 1983;62:7–10. doi: 10.1177/00220345830620011701. [DOI] [PubMed] [Google Scholar]
- 15.Marshall GW, Habelitz S, Gallagher R, Balooch M, Balooch G, Marshall SJ. Nanomechanical properties of hydrated carious human dentin. J Dent Res. 2001;80:1768–1771. doi: 10.1177/00220345010800081701. [DOI] [PubMed] [Google Scholar]
- 16.Zheng L, Hilton JF, Habelitz S, Marshall SJ, Marshall GW. Dentin caries activity status related to hardness and elasticity. Eur J Oral Sci. 2003;111:243–252. doi: 10.1034/j.1600-0722.2003.00038.x. [DOI] [PubMed] [Google Scholar]
- 17.Kuboki Y, Tsuzaki M, Sasaki S, Liu CF, Mechanic GL. Location of the intermolecular cross-links in bovine dentin collagen, solubilization with trypsin and isolation of cross-link peptides containing dihydroxylysinonorleucine and pyridinoline. Biochem Biophys Res Commun. 1981;102:119–126. doi: 10.1016/0006-291x(81)91497-2. [DOI] [PubMed] [Google Scholar]
- 18.Ogushi K, Fusayama T. Electron microscopic structure of the two layers of carious dentin. J Dent Res. 1975;54:1019–1026. doi: 10.1177/00220345750540050301. [DOI] [PubMed] [Google Scholar]
- 19.LeGeros RZ. Chemical and crystallographic events in the caries process. J Dent Res. 1990;69:567–574. doi: 10.1177/00220345900690S113. [DOI] [PubMed] [Google Scholar]
- 20.Daculsi G, LeGeros RZ, Jean A, Kerebel B. Possible physicochemical processes in human dentin caries. J Dent Res. 1987; 66:1356–1359. doi: 10.1177/00220345870660081401. [DOI] [PubMed] [Google Scholar]
- 21.Duke ES, Lindemuth J. Variability of clinical dentin substrates. Am J Dent. 1991;4:241–246. [PubMed] [Google Scholar]
- 22.Frank RM, Voegel JC. Ultrastructure of the human odontoblast process and its mineralization during dental caries. Caries Res. 1980;14:367–380. [Google Scholar]
- 23.Penel G, Delfosse C, Descamps M, Leroy G. Composition of bone and apatitic biomaterials as revealed by intravital Raman microspectroscopy. Bone. 2005;36:893–901. doi: 10.1016/j.bone.2005.02.012. [DOI] [PubMed] [Google Scholar]
- 24.Spencer P, Wang Y. Adhesive phase separation at the dentin interface under wet bonding conditions. J Biomed Mater Res. 2002;62:447–456. doi: 10.1002/jbm.10364. [DOI] [PubMed] [Google Scholar]


