

Abstract
PPARγ regulates both glucose metabolism and bone mass. Recent evidence suggests that the therapeutic modulation of PPARγ activity with anti-diabetic thiazolidinediones elicits unwanted effects on bone. In this study, the effects of rosiglitazone on the skeleton of growing (1 month), adult (6 month), and aged (24 month) C57BL/6 mice were determined. Aging was identified as a confounding factor for rosiglitazone-induced bone loss that correlated with the increased expression of PPARγ in bone marrow mesenchymal stem cells. The bone of young growing mice was least affected, although a significant decrease in bone formation rate was noted. In both adult and aged animals bone volume was significantly decreased by rosiglitazone. In adult animals bone loss correlated with attenuated bone formation, whereas in aged animals bone loss was associated with increased osteoclastogenesis, mediated by increased RANKL expression. PPARγ activation led to changes in marrow structure and function such as a decrease in osteoblast number, an increase in marrow fat cells, an increase in osteoclast number, and a loss of the multipotential character of marrow mesenchymal stem cells. In conclusion, rosiglitazone induces changes in bone reminiscent of aged bone and appears to induce bone loss by altering the phenotype of marrow mesenchymal stem cells.
Introduction
Osteoporosis, obesity, and diabetes are major public health concerns due to their prevalence in our increasingly sedentary and aging society (1). The peroxisome proliferator-activated receptor-gamma (PPARγ) is a DNA-binding nuclear hormone receptor that has been shown to regulate bone mass, energy expenditure, and glucose metabolism (2–4). At the cellular level, diverse pathologies such as obesity and osteoporosis share several features including a genetic predisposition and a common cell progenitor (5).
With aging, bone loss occurs universally in animals and humans and, in contrast to postmenopausal bone loss, affects individuals regardless of their sex steroid status (6). Age-related bone loss occurs only at the endosteal surface, which is in contact with the bone marrow, and results from attenuated and unbalanced bone turnover as a consequence of an oversupply of osteoclastic cells, relative to the need for bone resorption, and an undersupply of osteoblastic cells, relative to the need for cavity repair (6). While aging has a negative effect on bone formation and osteoblast production, it has a positive effect on the proportion of fatty marrow and the number of marrow adipocytes (7). In humans, the femoral cavity becomes occupied by fat by the third decade of life (7). Similarly, high fat content in the vertebral marrow is positively correlated with osteopenia and osteoporosis in both elderly men and postmenopausal women (5).
Osteoblasts and adipocytes share a common progenitor and are derived from marrow mesenchymal stem cells (MSC) (8). MSC commitment toward the osteoblast or adipocyte lineage occurs via a stochastic mechanism, in which lineage-specific transcription factors, such as runt related transcription factor 2 (Runx2) for osteoblasts and PPARγ2 for adipocytes, are activated (9, 10). Aging alters the balance in lineage commitment of marrow MSCs and increases their differentiation toward the adipocyte lineage, while decreasing differentiation toward the osteoblast lineage (9, 11). These lineage changes are reflected in the expression pattern of phenotype-specific transcription factors; an increase in the expression of PPARγ2 and a simultaneous decrease in the expression of Runx2 (11). In addition, marrow mesenchymal cell support of osteoclastogenesis is increased due to the increased production of macrophage colony-stimulating factor (M-CSF) and receptor activator of nuclear factor-κB ligand (RANKL) (12). Thus, normal aging changes the status of marrow MSCs with respect to both their differentiation potential and their production of specific signaling molecules. Such molecular changes contribute to the formation of the specific microenvironment necessary for the maintenance of bone homeostasis.
Multiple alternate PPARγ transcripts translate to two protein isoforms, PPARγ1 and PPARγ2. PPARγ1 is expressed in many cell types, including osteoblasts, whereas PPARγ2, is specifically expressed in adipocytes and is responsible for the regulation of both differentiation and function (10, 13). PPARγ activation requires heterodimerization with another nuclear receptor, retinoid X receptor (RXR), and binding of a specific ligand (14). Ligands for PPARγ include polyunsaturated fatty acids, oxidized metabolites of prostaglandin J2, certain phospholipids, and antidiabetic drugs such as thiazolidinediones (TZDs) (14). Currently, two TZDs, rosiglitazone and pioglitazone, are used to control glucose levels in diabetic patients.
An essential role for PPARγ in the maintenance of bone homeostasis has been demonstrated in several animal models of either bone accrual or bone loss, depending on the status of PPARγ activity (2, 3, 15–18). In models of bone accrual, a decrease in PPARγ activity in either heterozygous PPARγ-deficient mice or mice carrying a hypomorphic mutation in the PPARγ gene locus led to increased bone mass due to increased osteoblast number (3, 17). Moreover, the rate of bone loss with aging was significantly lower in heterozygous PPARγ-deficient mice compared to the control animals, which possessed both chromosomal copies of PPARγ (3). In contrast, in models of bone loss due to PPARγ activation, administration of rosiglitazone to mice and rats resulted in significant decreases in bone mineral density (BMD) and bone volume, and changes in bone microarchitecture (2, 15, 16, 18). This treatment-induced bone loss was associated with changes in the structure and function of bone marrow, such as a decreased number of osteoblasts and an increased number of adipocytes (2, 18).
In humans, 4-year follow-up data from the Health, Aging, and Body Composition observational study revealed that TZD administration results in progressive bone loss in diabetic older postmenopausal women, but not in older diabetic men (19). In addition, the clinical evaluation of PPARγ gene polymorphisms strongly suggests a role in the regulation of bone mass in humans (20). A silent C→T transition in exon 6 results in a lower bone density and a predisposition to osteoporosis (20). Several novel polymorphisms were also identified in the coding region of PPARγ that, particularly in women, correlated with BMD independently of body weight and type 2 diabetes in the Framingham Offspring Study (21).
Since PPARγ expression increases in marrow MSC with aging, the effect of PPARγ activation by rosiglitazone on the skeletons of growing, adult, and aging animals was examined. Rosiglitazone treatment resulted in distinctive changes in bone microarchitecture and strength, as well as age-dependent changes in the function of the mesenchymal compartment of bone marrow. These changes included decreased osteoblast number in adult, increased osteoclast number in aged, and an increased number of marrow adipocytes in all ages of animals analyzed. Moreover, rosiglitazone suppressed the multipotential phenotype of adult marrow MSC to a level comparable to that observed in aged animal marrow. The bone loss that occurs due to rosiglitazone treatment shares the features of, and involves mechanisms similar to, age-related bone loss.
Methods
Experimental animals and treatment regime
Non-diabetic male C57BL/6 mice were obtained from the colony maintained by the NIA under contractual agreement with Harlan Sprague Dawley, Inc. (Indianapolis, IN). Animals, identified by punched ears, were housed (four per cage) with free access to water and were maintained at a constant temperature, on a 12 h light-dark cycle. The animal treatment and care protocols conformed to NIH Guidelines and were performed using a University of Arkansas for Medical Sciences (UAMS) IACUC approved protocol.
Animals were grouped and referred to as follows: young (1-month old) – 10 animals per group; adult (6-month old) and old (24-month old) - 8 animals per group. Animals were fed 5 grams of food per day per animal with pelleted chow (F05072, Bio-Serv, Frenchtown, NJ) supplemented with rosiglitazone maleate (Avandia, GlaxoSmithKline, King of Prussia, PA) at the concentration of 0.14 mg/g of chow. The control group was fed the same amount of non-supplemented chow. Animals were fed every other day for either 8 (young) or 7 (adult and old) weeks and food and rosiglitazone intake per cage, and body weights of individual animals were monitored. To permit dynamic bone histomorphometric measurements, mice were injected intraperitoneally with 30 μg/g body weight of tetracycline 7 and 2 days prior to sacrifice as described (2).
Measurements of serum metabolic parameters
Blood was collected by cardiac puncture at the time of sacrifice, allowed to clot and serum collected by centrifugation. Plasma glucose levels were measured using Accu-Check Advantage Blood Glucose Meter (Roche Diagnostic Corporation, Indianapolis, IN). Serum insulin levels were determined using Mouse Insulin ELISA kit (ALPCO, Windham, NH), serum bone specific alkaline phosphatase levels were determined in p-nitrophenol reaction using Phosphatase Substrate (Sigma, St. Louis, MO) in the presence of 10mM L-phenylalanine to inhibit any circulating intestinal alkaline phosphatase, and serum C-telopeptide degradation products from type I collagen were measured using RatLaps ELISA kit (Nordic Bioscience Diagnostics, Herlev, Denmark).
Bone mineral density measurements
Bone mineral density (BMD) was determined using the Piximus instrument and software V1.46 (GE Lunar, Madison, WI). Mice were anesthetized and scanned at the beginning of the experiment and prior to the onset of rosiglitazone treatment, an intermediate time point (4 weeks) and at sacrifice (7 weeks). Total body BMD (g/cm2), excluding the head region, was obtained from each scan, and the percent change in BMD was determined as described (2). Internal variations of repeated measures of total murine body BMD have been determined to be 1.7–2.0%.
Micro-computed tomography (MicroCT) analysis
After sacrifice, the right tibia of each animal was dissected and fixed in Millonig's phosphate-buffered 10% formalin, pH 7.4. After 24h, the tibia was dehydrated successively in 70%, 95%, and 100% ethanol and measured without further sample preparation in a microCT 40 (Scanco Medical, Bassersdorf, Switzerland), as described (2, 22).
Mechanical testing
The fifth lumbar vertebrae (L5) was harvested and used for biomechanical testing. The compressive strength of L5 vertebrae were determined in a single load-to-failure compression test as we have previously described (23) using a MTS 858 Bionex Test Systems load frame (MTS, Eden Prairie, MN) with computer control, data logging, and calculations of load-to-failure using TestWorks version 4.0 (MTS). The load frame was operated at a constant rate of 0.1 mm/sec with load and displacement recorded at 100 Hz. Load-to-failure was recorded as the load after a 2% drop from peak load.
Bone Histomorphometry
Following microCT data collection, the same tibiae were embedded undecalcified in methyl methacrylate and sectioned at 4 μm using a tungsten carbide steel knife on an automatic, retractable Microtom 355 with a D-profile. Adjacent sections were stained with Masson Trichrome, Goldner Trichrome, Von Kossa, and two left unstained for evaluation of tetracycline labeling evaluation (2, 24). Osteoclasts were quantified in sections stained for tartrate resistant acid phosphatase (TRAP), with osteoclasts identified as TRAP+ multinucleated cells, adjacent to bone. All histomorphometric examination was performed in a blinded, non-biased manner using a computerized semi-automated OsteoMeasure system (OsteoMetrics Inc., Atlanta, GA) as previously described (2). Briefly, all measurements were confined to the secondary spongiosa and restricted to an area between 700 and 1500 μm distal to the growth plate-metaphyseal junction of the proximal tibia. A minimum of 25 fields in the proximal tibia were evaluated (2). Static measurements and dynamic lengths of single and double-labeled bone surfaces were obtained (2, 24) and reported using the terminology recommended by the Histomorphometry Nomenclature Committee of ASBMR (25). Adipocyte number in the methaphysis of the proximal tibia was measured on 5 different microscopic fields at 20× magnification.
RNA isolation and quantitative real- time RT-PCR analysis
Total RNA was isolated from the left tibia of each animal and gene expression in the entire bone was analyzed using quantitative real-time RT-PCR. Immediately after animal sacrifice, the tibia was cleaned of all remaining soft tissue, cut into pieces, and homogenized in the presence of TRIzol Reagent (Life Technologies, Grand Island, NY) followed by RNA isolation as described by the manufacturer. Real time PCR reactions were performed as described (22).
Gene expression was analyzed using the following primer pairs: RANKL (forward - ATGCTGCCAGCATCCCA; reverse - CCCAGCCTCGATCGTGG), OPG (forward - TCCGGCGTGGTGCAAG; reverse - AGAACCCATCTGGACATTTTTTG), PPARγ (forward - TCATCTCAGAGGGCCAAGGA; reverse - CACCAAAGGGCTTCCGC), PPARγ2 (forward - AAACTCTGGGAGATTCTCCTGTTG; reverse - GAAGTGCTCATAGGCAGTGCA), and 18S rRNA (forward – TTCGAACGTCTGCCCTATCAA; reverse – ATGGTAGGCACGGCGACTA).
Murine primary bone marrow cultures and the assessment of osteoblast and adipocyte differentiation
Bone marrow cultures were established from femur marrow aspirates as described (22). Bone marrow was isolated from individual mice (n=8) and seeded separately in triplicate at a density of 2.5×10⁵ cells/cm2 on six-well tissue culture plates (Becton Dickinson Labware, Franklin Lakes, NJ) in αMEM medium (Life Technologies) supplemented with 15% fetal bovine serum (FBS) (Hyclone, Logan, UT). To measure the number of osteoblastic progenitors (CFU-OB), cells were maintained in osteoblastic medium (basal medium supplemented with 0.2 mM ascorbic acid and 10 mM β-glycerophosphate, Sigma, St. Louis, MO) for 28 days with one-half of the medium changed every 6 days. Mineralization was determined by Von Kossa staining as described (24). To measure the number of adipocytic progenitors (CFU-AD), after initial 10 days of growth, cultures were exposed for the next 3 days to the medium supplemented with 10−6 M rosiglitazone (Tularik Inc., South San Francisco, CA). Fat-containing cells were visualized with Oil Red O staining and adipogenesis was quantified by enumerating colonies containing at least 10% Oil Red O-positive cells (26).
The assessment of the multipotential phenotype of MSCs was performed as described (10). Briefly, murine bone marrow adherent cells were grown in the presence of basal medium for 10 days followed by either an additional 3 days of growth in the same medium or grown in basal medium supplemented with 10−6 M rosiglitazone. Next, all medium was changed to pro-osteoblastic medium (basal medium supplemented with 0.2 mM ascorbic acid and 10 mM β-glycerophosphate). All cultures were then allowed to grow for an additional 28 days. The number of mineralized CFU-OB was enumerated after von Kossa staining.
Osteoclastogenesis
To assess the effects of rosiglitazone treatment on mesenchymal cell support for osteoclastogenesis, co-culture of murine bone marrow and immortalized murine marrow mesenchymal cells stably transfected with PPARγ2 expression construct (U-33/γ2 cells) (10) were used. The U-33/γ2 cells are rosiglitazone-responsive, endogenously express RANKL and OPG, and support recruitment and development of TRAP-positive osteoclasts from the fraction of non-adherent primary bone marrow cells. U-33/γ2 cells were seeded (1 × 10⁴ cells/well) on 48-well tissue culture plates (Becton Dickinson Labware, Franklin Lakes, NJ) in αMEM supplemented with 10% FBS.
In the first set of experiments, after 24 hr of growth cells were pretreated with either vehicle (DMSO) or 10−6 M rosiglitazone for 2 days followed by the addition of the non-adherent fraction of primary murine bone marrow cells (2.5×10⁵cells/well), as a source of osteoclast progenitors. Non-adherent cells were collected from primary murine bone marrow cultures, established two days earlier, by plating marrow isolates at 2×10⁵ cells/cm2. The co-cultures of non-adherent murine bone marrow cells and U-33/γ2 cells, pretreated or not with rosiglitazone (10−6 M), were grown either in the presence of non-supplemented αMEM medium or medium supplemented with 10−8M 1,25(OH)2D3 (Sigma) in quadruplicate. In the second series of experiments, co-cultures of U-33/γ2 cells and non-adherent bone marrow cells were either supplemented or not with 10−6 M rosiglitazone (as above) in the presence or absence of 10−8M 1,25(OH)2D3 for the remainder of the experiment. Cultures were grown for 6 days with a half medium change on day 3 followed by staining for TRAP according to the manufacturer (Acid Phosphatase Leukocyte Kit, Sigma). TRAP-positive (TRAP+) multinucleated cells per well were enumerated. In addition, the number of nuclei per TRAP+ multinucleated cell was measured.
Statistical analysis
Statistically significant differences between groups were detected using one-way Anova followed by post-hoc analysis by Student-Neuman-Keuls within the SigmaStat software (SPSS, Inc., Chicago, IL) after establishing homogeneity of variance and the normal distribution of the data. Data that were not normally distributed were analyzed by Mann-Whitney on the ranks and Dunn's post-hoc tests using SigmaStat software. In all cases, p<0.05 was considered significant. Histomorphometric data were analyzed using SigmaStat (SPSS Science, Chicago, IL) or SAS software (SAS Institute Inc., Cary, NC) (2). All values are presented as the Mean ± SD. Differences between group means in all histomorphometric studies are evaluated with Student’s t test, or ANOVA after P values are adjusted with Bonferroni’s correction (2).
Results
The C57BL/6 mouse strain is a commonly accepted model of bone aging (27). Changes that occur in the tibial methaphysis and diaphysis in male C57BL/6 mice closely resemble changes that occur in human bone with aging (27, 28). Bone growth in C57BL/6 males, measured as increasing BMD, occurs during the first 3–4 months of life, peaks at around 5–6 months, and is followed by a gradual decline that continues throughout the life-span of the animal (approx. 26–36 months) (Figure 1). Similar to humans, bone loss in older animals is accompanied by a corresponding increase in the number of marrow adipocytes (Figure 1). There is no significant difference in adipocyte number in young growing animals and adult animals at peak BMD, however, adipocyte numbers increase sharply in old animals and are positively correlated with the decreased BMD observed (Figure 1).
Figure 1.
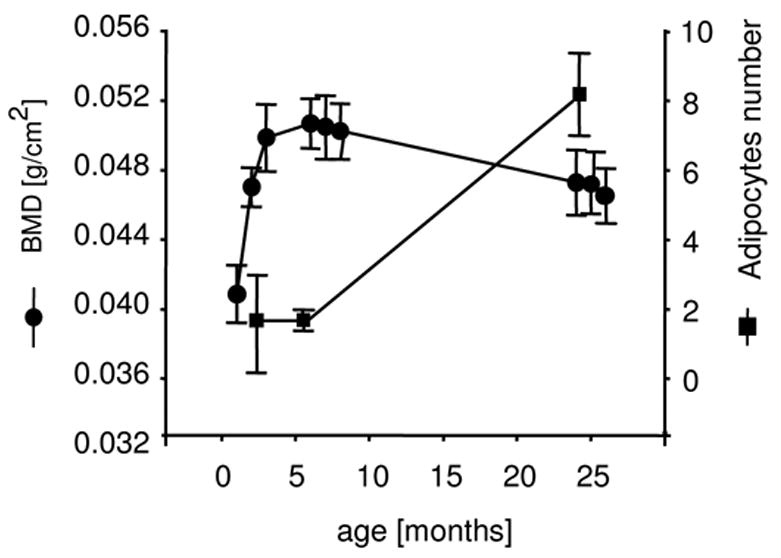
The inverse relationship between BMD and marrow adipocytes. Bone mineral density (BMD) (circles) and the total number of marrow adipocytes in tibia (squares) were measured as a function of aging in C57BL/6 mice. Adipocyte number was measured in the methaphysis of the proximal tibia. Numbers represent a mean of 5 fields at a magnification 20×. Data were collected from 10 young, 8 adult and 8 old animals.
Age-related effects of rosiglitazone on bone mass
Since osteoblasts and adipocytes share a common mesenchymal progenitor and expression of the adipocyte-related PPARγ2 isoform increases in undifferentiated MSC with aging (11), we hypothesized that PPARγ activation following rosiglitazone treatment will induce bone loss as a function of age. Therefore, the skeletal responses to rosiglitazone of young (1 month), adult (6 months), and old (24 months) animals were examined. Animals in each age group were fed a diet supplemented with rosiglitazone for 7 weeks. At the end of 7 weeks, animals were 3, 8, and 26 months old, respectively. The average daily dose of rosiglitazone, calculated at the end of experiment, was not significantly different between groups (17.4 μg/g body weight – young; 18.7 μg/g – adult; 16.1 μg/g – old). However, the differences between the cumulative doses in each group (daily dose × duration of experiment) were significant (p <0.05) (974.4 μg/g body weight – young; 916.3 μg/g – adult; 788.9 μg/g – old). Thus, young animals received the largest cumulative dose of rosiglitazone, whereas old animals received the smallest.
Animals that received a diet supplemented with rosiglitazone responded with higher food intake, decreased weight of epididymal or white fat (WAT), and increased weight of interscapular or brown fat (BAT) (Figure 2A–C). However, in contrast to type 2 diabetic patients and animal models, rosiglitazone treatment of non-diabetic animals did not change body weight nor alter serum glucose levels (Figure 2D, E) (29). Interestingly, insulin levels were significantly compromised, suggesting activation of compensatory mechanisms in non-diabetic animals, which stabilized blood glucose levels in the presence of rosiglitazone (Figure 2F). No changes in serum levels for bone specific alkaline phosphatase, or C-telopeptide were detected (data not shown).
Figure 2.

Changes in metabolic parameters as function of aging and rosiglitazone administration. (A) Total food intake per mouse during the experiment. (B) The average weight of white epididymal fat (WAT) and (C) brown interscapular fat (BAT) measured at the end of experiment. (D) The average change in body weight calculated as a percent change between the beginning and the end of experiment; (E) The level of blood glucose measured at the end of experiment; (F). Serum insulin levels measured at the end of experiment. Data were collected from the following number of animals in each group: young -10 control and 10 rosiglitazone, adult – 8 control and 8 rosiglitazone, old – 8 control and 7 rosiglitazone. Gray bars – control; black bars – rosiglitazone; ND – no data; * p < 0.05 vs. control; # p < 0.05 vs. young; ^ p < 0.05 vs. adult
A change in global BMD, calculated as a percent fraction between individual animal’s BMD value at the beginning and at the end of experiment, indicated that rosiglitazone decreased BMD in adult and old, but not young animals (Figure 3A). However, measurement of the changes in bone mineral content (BMC) demonstrated a negative effect of rosiglitazone in all age-groups tested (Figure 3B). Furthermore, detailed examination of the kinetics of bone loss accompanying rosiglitazone treatment demonstrated that the majority of the bone loss in adult animals (~63% of total bone loss) occurred during the final 3 weeks of rosiglitazone treatment, whereas the bone loss in old animals (~70% of total bone loss) occurred during the initial 4 weeks of treatment (Figure 3C and D, respectively). Such a time-dependent difference in the response to rosiglitazone treatment suggests that different cellular targets and/or different mechanisms are responsible for the rosiglitazone-induced bone loss in adult and old animals.
Figure 3.
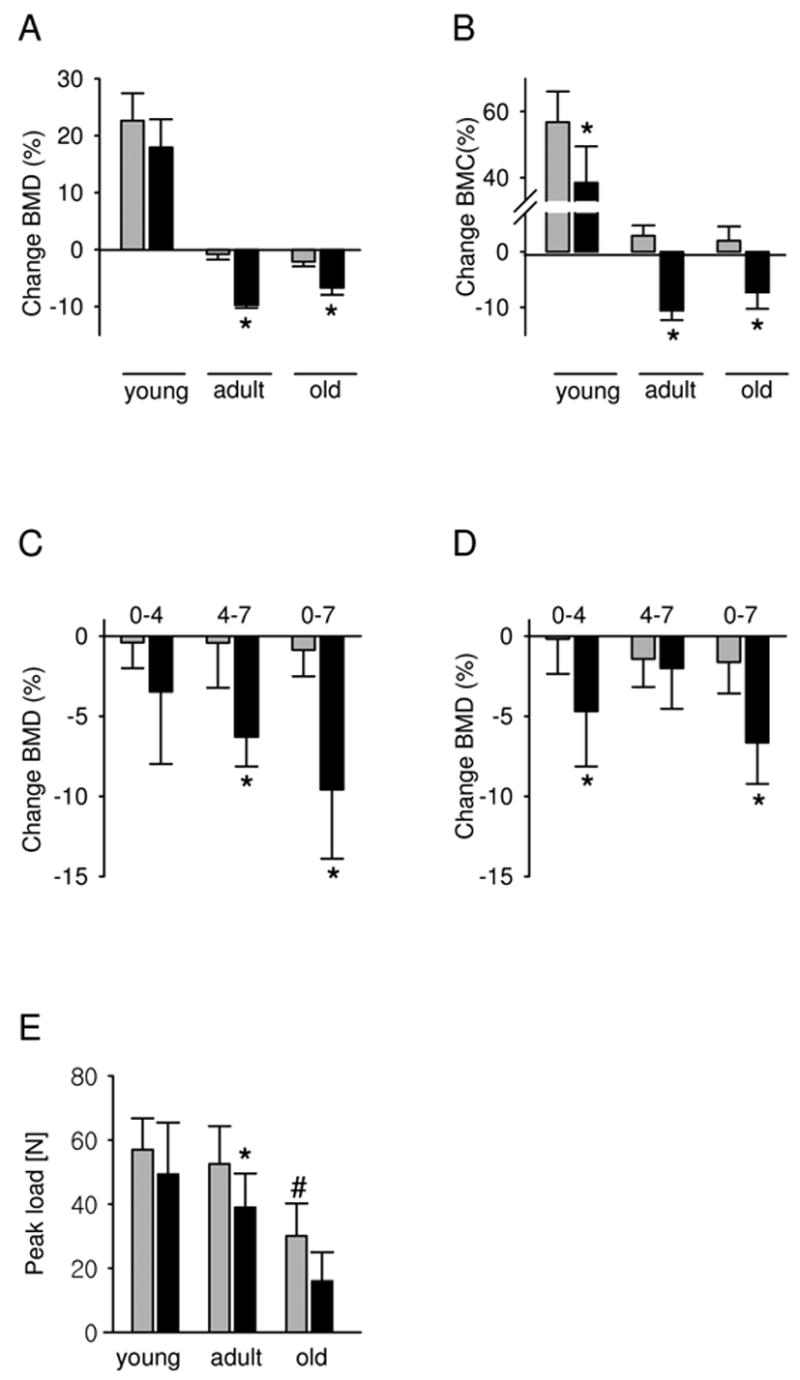
Changes in BMD, BMC, and bone strength as a function of rosiglitazone treatment and aging. Changes in BMD and BMC are expressed as a percent change at the end of experiment, compared to the values at the beginning of the experiment. (A) Change in global BMD. (B) Change in global BMC. (C) Kinetics of the change in global BMD of adult and (D) old animals. Values represent changes that occurred during the first 4 weeks of treatment (0–4), between 4th and 7th week of treatment (4–7), and between the beginning and the end of treatment (0–7). (E) Vertebral bone strength was measured at the end of experiment as described in Material and Methods. Data were collected from the following number of animals in each group: young -10 control and 10 rosiglitazone, adult – 8 control and 8 rosiglitazone, old – 8 control and 7 rosiglitazone. Gray bars – control; black bars – rosiglitazone. * p < 0.05 vs control; # p < 0.05 vs young
Next, the effect of rosiglitazone treatment on vertebral bone strength was determined. Rosiglitazone treatment significantly decreased load-to-failure of L5 vertebral bodies in adult, but not young, animals to a similar level to that of aged, control animals (Figure 3E). The decrease in mechanical strength was positively correlated with the decrease in BMD in rosiglitazone-treated adult animals. As expected, bone strength in aged control animals was significantly compromised compared to both young and adult animals. Rosiglitazone administration further decreased vertebral strength in aged animals however the values did not achieve statistical significance (Figure 3E).
Analysis of bone microarchitecture by microCT
Analysis of trabecular bone microarchitecture in the proximal tibia using micro-computed tomography (microCT) revealed that rosiglitazone induced changes in bone architecture that paralleled the changes observed with aging (Figure 4). In adult animals, both aging and rosiglitazone treatment decreased bone volume fraction (Figure 4B), trabecular number (Figure 4C) and increased trabecular spacing (Figure 4D). No changes in connectivity density (Figure 4E) or trabecular thickness were seen with advancing age or with rosiglitazone treatment in young animals, however rosiglitazone treatment significantly decreased trabecular thickness in adult animals (Figure 4F). No changes in trabecular bone microarchitecture were observed in young animals treated with rosiglitazone. In old animals treated with rosiglitazone, bone loss was so extensive that little or no trabecular bone remained, making analysis by microCT problematic and unreliable statistically.
Figure 4.
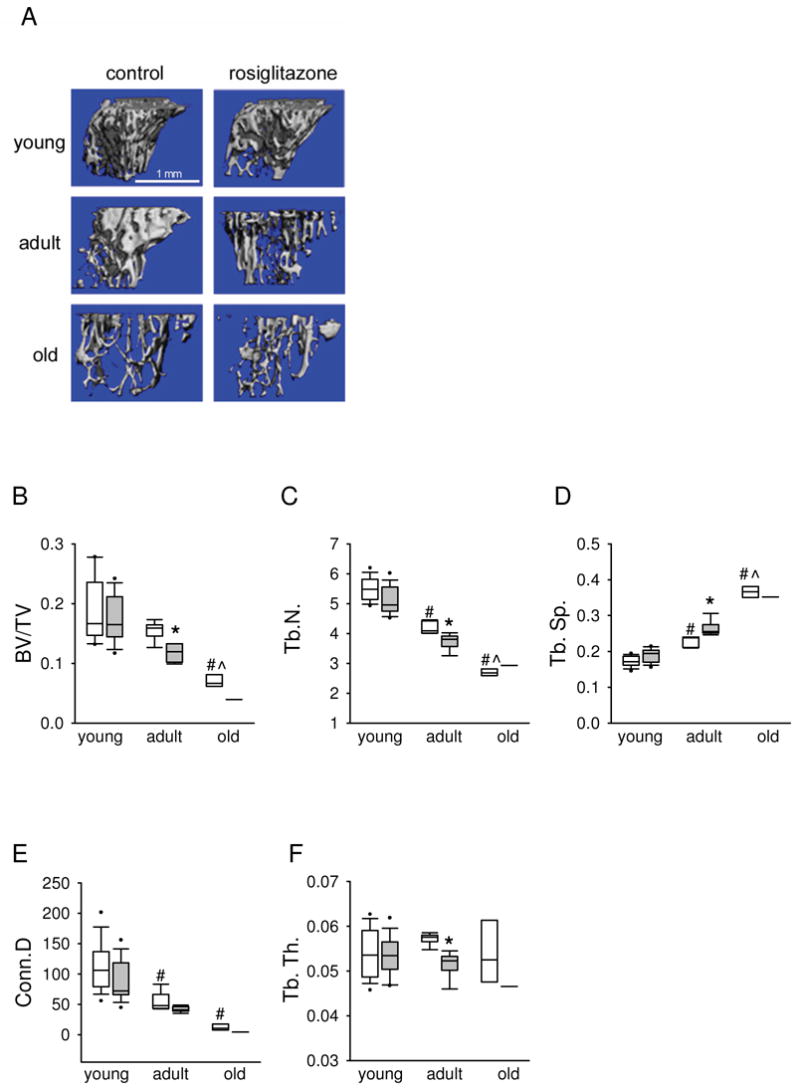
MicroCT analysis of bone microarchitecture. (A) 3-dimensional reconstructions of microCT data from the tibiae of control and rosiglitazone treated young, adult and old animals. Scale bar corresponds to 1 mm. (B) Bone volume per tissue volume (BV/TV). (C) Trabecular number (Tb.N.). (D) Trabecular spacing (Tb.SP.). (E) Connectivity D (Conn.D.). (F) Trabecular thickness (Tb.Th.). The following number of tibiae were analyzed in each group: young – 10 control and 10 rosiglitazone; adult – 5 control and 5 rosiglitazone; old – 4 control and 1 rosiglitazone. In old animals treated with rosiglitazone, bone loss was so extensive that little or no trabecular bone remained, making analysis by microCT reliable for only one experimental tibia. The data are presented as box plots with plotted median (horizontal lines) and percentile. White boxes – control; gray boxes – rosiglitazone. * p<0.05 vs. control; # p<0.05 vs. young animals; ^ p<0.05 vs. adult animals.
Histomorphometric analysis of bone formation and bone resorption parameters
Histomorphometric analysis (Table 1) demonstrated the cellular basis for the age-dependent effect of rosiglitazone to increase bone loss. In young growing animals, rosiglitazone treatment significantly decreased bone formation rate. No other osteoblast parameters in young mice were significantly affected. Rosiglitazone did not affect osteoclast number in either young or adult animals (Table 1). However, in adult animals, rosiglitazone decreased the number of osteoblasts resulting in a decreased mineral apposition rate and ultimately decreased bone formation rate (Table 1), as we and others have shown previously (2, 18).
Table 1.
Effect of rosiglitazone and aging on cancellous bone in the proximal tibia
| Parameter | Young | Adult | Old | |||
|---|---|---|---|---|---|---|
| Control | Rosi | Control | Rosi | Control | Rosi | |
| Bone area/tissue area (%) | 7.0±2.5 | 4.9±1.4 | 8.2±3.4 | 4.9±2.2 | 2.5±4.4B,C | 1.3±1.8 |
| Trabecular width (μm) | 36.6±2.1 | 36.7±3.2 | 37.1±3.2 | 36.6±6.1 | 29.3±4.3 | 31.1±5.8 |
| Trabecular spacing (μm) | 325±121 | 366±102 | 425±183 | 693±145A | 477±89B | 779±176A |
| Trabecular number(N/mm2 tissue area) | 1.3±0.7 | 1.6±0.5 | 1.8±0.3 | 1.5±0.7 | 0.8±0.3C | 1.1±0.7 |
| Osteoid width (μm) | 2.1±0.3 | 2.3±0.3 | 2.4±0.3 | 2.1±0.3 | 1.7±0.3 | 1.9±0.3 |
| Osteoblast number(N/mm2 tissue area) | 76.2±12.1 | 34.6±22.7 | 83.2±21.1 | 46.6±12.7A | 21±12.7B,C | 24±11.2 |
| Osteoblast number(N/mm bone perimeter) | 23.3±6.2 | 19.2±12.2 | 21.3±7.2 | 11.2±4.1 | 3.2±1.1B,C | 3.6±1.7 |
| Mineral apposition rate(μm/d) | 1.11±0.2 | 0.8±0.2 | 2.82±0.3B | 0.9±0.4A | 1.0±0.3C | 0.9±0.4 |
| Bone formation rate/bone perimeter (μm 2/μm/day) | 0.135±0.042 | 0.069±0.029A | 0.204±0.101 | 0.077±0.039A | 0.08±0.04C | 0.07±0.02 |
| Osteoclast number(N/mm2 tissue area) | 5.1±0.8 | 5.2±1.2 | 6.2±0.7 | 5.9±1.1 | 6.9±0.7B | 9.5±1.2A |
| Osteoclast number(N/mm bone perimeter) | 2.0±0.2 | 1.7±0.5 | 3.1±0.4B | 3.4±0.7 | 2.9±0.1 | 4.1±0.7A |
p<0.05 vs age-matched control;
p<0.05 vs control young;
p<0.05 vs control adult
The following number of animals in each group was analyzed: young - 5 control and 5 rosiglitazone; adult – 5 control and 5 rosiglitazone, old – 5 control and 3 rosiglitazone.
In contrast, the cellular basis for bone loss in rosiglitazone-treated aged animals was distinctly different. As expected, parameters of bone formation, such as bone formation rate, mineral apposition rate and osteoblast number, were greatly compromised in old non-treated animals. Rosiglitazone administration had no significant effect on any measured osteoblast parameter in old animals. However, in contrast to adult animals, in old rosiglitazone-treated animals bone loss was directly related to the significant increase in osteoclast number (Table 1). These results suggest that rosiglitazone treatment affects distinct cellular bone compartments in adult and aged animals.
To assess the effect of aging and rosiglitazone on the support for osteoclastogenesis, the ratio of RANKL-to-OPG mRNA expression was examined (30–32) (Figure 5A). Since RANKL and OPG are expressed in the marrow by cells of different lineages and support osteoclastogenesis in a paracrine fashion, the expression of their transcripts was measured in the intact bone of experimental animals as oppose to the specific marrow cellular compartment. As shown in Figure 5B and C, during aging relative levels of RANKL mRNA increase, whereas levels OPG mRNA decrease, respectively. This results in the increased RANKL-to-OPG ratio in the tibia of both adult and old animals, but not in the tibia of young animals (Figure 5A). This ratio was further increased in the bone of rosiglitazone treated animals (Figure 5A). The observed increase in the RANKL-to-OPG ratio in rosiglitazone-treated animals was entirely due to increased RANKL mRNA expression, since no significant change in OPG mRNA expression was detected (Figure 5B and C, respectively). Interestingly, the RANKL-to-OPG ratio was also increased in the bone of adult rosiglitazone-treated animals in the absence of increased bone resorption (Figure 5A, see Table 1). However the relative expression of RANKL in adult animals was lower, and OPG expression higher, compared to the expression levels in the bone of old rosiglitazone-treated animals (Figure 5B and C, respectively). These data may explain the observed lack of increase in osteoclastogenesis in rosiglitazone-treated adult animals in vivo. Rosiglitazone did affect neither RANKL-to-OPG ratio nor RANKL nor OPG expression in young animals, which is consistent with the lack of effect of this drug on bone resorption in young animals.
Figure 5.

Measurement of the RANKL and OPG mRNA expression in bone as a function of age and rosiglitazone administration. Total RNA was extracted from the proximal tibia and analyzed by real time PCR. (A) Determination of the RANKL/OPG mRNA ratio. (B) RANKL mRNA expression levels. (C) OPG mRNA expression levels. Tibiae RNA were extracted from the following number of animals in each group: young - 4 control and 4 rosiglitazone, adult – 3 control and 4 rosiglitazone, old – 4 control and 4 rosiglitazone. Gray bars – control; black bars – rosiglitazone. * p < 0.05 vs. control; # p < 0.05 vs. young animals; ^ p < 0.05 vs. adult animals.
Rosiglitazone increases mesenchymal cells support for osteoclastogenesis in vitro
The effect of rosiglitazone on the support of osteoclastogenesis by marrow MSCs was examined using U-33/γ2 cells, a mesenchymal cell line, in which osteoblast and adipocyte differentiation are under the control of PPARγ2 (10, 26). U-33/γ2 cells support the recruitment and differentiation of osteoclast-like cells in co-culture with non-adherent bone marrow cells, as measured by tartrate-resistant acid phosphatase staining (TRAP+) multinucleated cell formation (Table 2), due to the endogenous expression of RANKL. Rosiglitazone treatment (10−6 M) completely inhibited U-33/γ2 support of osteoclast development, whereas treatment of U-33/γ2 cells with 1,25(OH)2D3 (10−8M) significantly enhanced osteoclastogenesis (Table 2). Interestingly, pre-treatment of U-33/γ2 cells with rosiglitazone (10−6 M) followed by treatment with 1,25(OH)2D3 (10−8 M) significantly increased total osteoclast-like cell number compared to treatment with 1,25(OH)2D3 alone (Table 2; Experiment type 1). Furthermore, analysis of cellular morphology demonstrated that under basal conditions U-33/γ2 cells modestly supported the recruitment of TRAP+ cells (1–3 nuclei/cell), whereas in the presence of 1,25(OH)2D3 the number of more mature multinucleated TRAP+ cells (33) (4–19 or ≥20 nuclei/cell) was significantly increased (Table 2). Pretreatment with rosiglitazone followed by treatment with 1,25(OH)2D3 not only increased the total number of TRAP+ osteoclast-like cells but also the number of osteoclast-like cells containing 4 or more nuclei (Table 2).
Table 2.
The effect of 1,25(OH2)D3 and rosiglitazone on osteoclast development in co-culture of non-adherant bone marrow cells and U-33/γ2 cells.
| Treatment | Experiment type 1A | Experiment type 2B | ||||||
|---|---|---|---|---|---|---|---|---|
| 1–3C | 4–19C | >20C | TotalD | 1–3C | 4–19C | >20C | TotalD | |
| V | 25.7±2.1E | 0 | 0 | 25.7±2.1E | 32.0±6.0E | 0 | 0 | 32.0±6.0E |
| R | 0 | 0 | 0 | 0 | 0 | 0 | 0 | 0 |
| D3 | 288.8±25.5 | 162.8±27.3 | 3.0±1.4 | 454.5±18.9 | 325.0±13.7 | 240.3±33.8 | 4.8±1.7 | 570.0±42.3 |
| R+D3 | 166.3±17.4E | 313.5±24.8E | 73.8±6.2E | 553.5±30.5E | 102.5±7.9E | 151.0±7.5E | 24.8±6.4E | 278.3±14.4E |
U-33/γ2 cells were pretreated with 10−6 M rosiglitazone for 2 days followed by media change and addition of 10−8 M 1,25(OH2)D3 and non-adherant bone marrow cells followed by TRAP staining after 6 days of growth;
Osteoclastogenesis in the presence of 10−6 M rosiglitazone and 10−8 M 1,25(OH2)D3 followed by TRAP staining after 6 days of growth;
Number of nuclei per TRAP+ cell;
total number of TRAP+ cells per well;
p < 0.05 vs D3
V – vehicle; R – rosiglitazone; D3 - 1,25(OH2)D3; R+D3 – rosiglitazone + 1,25(OH2)D3
To further examine the functional consequences of rosiglitazone and 1,25(OH)2D3 on osteoclast-like cell formation, U-33/γ2 and non-adherent bone marrow cells were co-cultured in the presence of both, 1,25(OH)2D3 and rosiglitazone (Table 2; Experiment type 2). As shown in Table 2, the simultaneous combination of rosiglitazone and 1,25(OH)2D3 decreased the total number of TRAP + osteoclast-like cells, compared to treatment with 1,25(OH)2D3 alone. This result is entirely consistent with the inhibitory effects of rosiglitazone on osteoclast precursors observed by others (34–36).
The change in U-33/γ2 cell support of osteoclastogenesis following pre-treatment with rosiglitazone positively correlated with the observed changes in the RANKL-to-OPG ratio (Figure 6A). Treatment of U-33/γ2 cells with rosiglitazone alone decreased the RANKL–to-OPG ratio. In contrast, the RANKL-to-OPG ratio was significantly increased by 1,25(OH)2D3 treatment and was further enhanced in cells pre-treated with rosiglitazone prior to the addition of 1,25(OH)2D3 (Figure 6A). Rosiglitazone increased the RANKL-to-OPG ratio primarily by an up-regulation of RANKL mRNA (Figure 6B and C). A similar effect of rosiglitazone on RANKL and OPG mRNA expression was observed in U-33/γ2 cells simultaneously treated with both, rosiglitazone and 1,25(OH)2D3 (data not shown). Collectively, these results suggest that PPARγ may have a dual role in the regulation of osteoclastogenesis. PPARγ activation increases the support for osteoclastogenesis mediated by 1,25(OH)2D3-stimulated increases in RANKL expression in mesenchymal cells, and also affects the recruitment of osteoclast-committed precursors from the pool of hematopoietic cells.
Figure 6.

Rosiglitazone and 1,25(OH)2D3 effects on RANKL and OPG expression in U-33/γ2 cells. U-33/γ2 cell were cultured in the presence of either vehicle (V), or 10−6 M rosiglitazone (R), 10−8 M 1,25(OH)2D3 (D3), or both (R+D3) for 7 days followed by total RNA isolation. The levels of RANKL and OPG gene expression were measured using real time PCR. (A) RANKL/OPG expression ratio. (B) RANKL mRNA expression. (C) OPG mRNA expression. * p < 0.05 vs vehicle; # p < 0.05 vs 1,25(OH)2D3
Rosiglitazone induces changes in bone histology characteristic of aging bone
Histological examination of the proximal tibia of young, adult and aged animals revealed that rosiglitazone-induced changes in the bone and marrow compartments closely resemble age-induced changes (Figure 7A). With aging bone volume in the primary spongiosa and metaphysis decreases, and the growth plate closes (28). Marrow infiltration into the epiphysis becomes more pronounced, leading to the fusion of both the metaphyseal and epiphyseal areas and replacement of the bone space with marrow infiltrated with fat cells (Figure 7A) (28). A similar pattern of histological changes are seen in animals treated with rosiglitazone. The histological appearance of the proximal tibia of adult animals following 7 weeks of rosiglitazone treatment closely resembles the proximal tibia of aged animals (Figure 7A). These similarities include the loss of bone in the epiphysis and fat accumulation in the marrow, which replaces bone. The loss of an intact epiphysis and an increase in adipocyte number is also seen in young animals treated with rosiglitazone (Figure 7A). Since such changes in the epiphysis may affect longitudinal bone growth (28), we measured the length of the tibia in young animals using digital calipers. There were no significant differences in the length of the tibia in control versus rosiglitazone-treated animals (data not shown).
Figure 7.
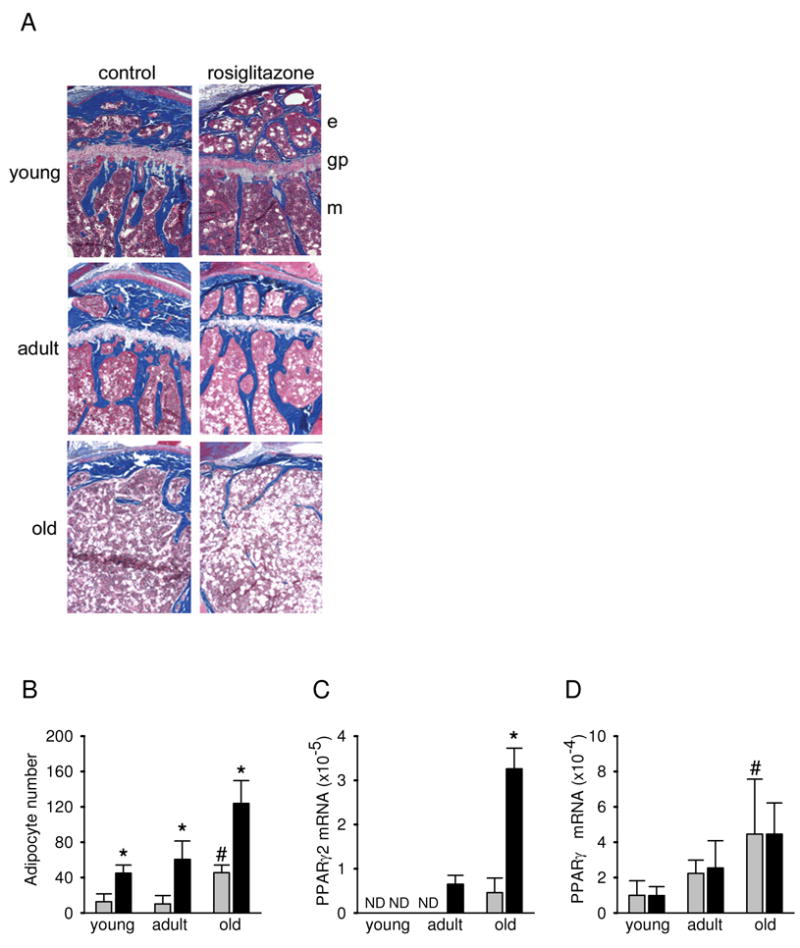
Examination of histological appearance and PPARγ expression in the proximal tibia. (A) Histological appearance. Undecalcified tibiae were obtained from young, adult and old control and rosiglitazone treated mice and embedded in methyl methacrylate, sectioned, and stained with Golden trichrome (2). Mineralized bone tissue is stained blue. The unstained areas in the bone marrow represent empty spaces previously occupied by adipocytes. Magnification 4×. e – epiphysis, gp – growth plate, m – methaphysis. (B) Marrow adipocyte number in the methaphysis of the proximal tibia. Adipocytes were recognized based on the distinct appearance of round empty spaces in the processed specimens. Cell numbers represent a mean of 5 fields per bone at a magnification 20×. Data were collected from the tibiae of 5 animals from each group. (C) Levels of PPARγ2 mRNA expression in whole tibia. (D) Levels of PPARγ1 mRNA expression in whole tibia. Gene expression was measured using real-time PCR. Gray bars – control; black bars – rosiglitazone; * p < 0.05 vs control; # p < 0.05 vs young animals. ND – mRNA expression below detection level.
The decrease in trabecular bone volume that occurs during aging, and as a result of rosiglitazone treatment, is accompanied by an increase in the number of marrow adipocytes (Figures 1, 7A and B). Rosiglitazone increased the number of marrow adipocytes regardless of the age of the animals. However the largest increase was observed in old animals which, even at the baseline, have higher numbers of marrow adipocytes. The increased number of adipocytes and the increased sensitivity of old marrow to the pro-adipocytic effect of rosiglitazone treatment can be attributed to the increased expression of the PPARγ2 isoform in MSC with aging (11).
The number of adipocytes in the tibia of adult and old animals correlated with the increased expression of the adipocyte-specific PPARγ2 mRNA isoform (Figure 7C). PPARγ2 was undetectable in the bones of young and adult control animals, but was detected in the bone of old control animals. Rosiglitazone significantly increased PPARγ2 mRNA expression in the bone of adult and old, but not young animals (Figure 7C). In contrast, the expression of the more abundant and less specific PPARγ1 mRNA isoform was increased with aging but was not affected by rosiglitazone treatment (Figure 7D). The differences in the pattern of expression of both PPARγ isoforms may reflect their different cellular localization and/or distinct functions in the maintenance of skeletal homeostasis.
Rosiglitazone affects the multipotential phenotype of osteoblast progenitors
Analysis of the differentiation potential of the MSC compartment revealed that, in accordance with earlier reports (18), in vivo administration of rosiglitazone did not affect the potential of MSC to form fibroblast-like colonies (CFU-F), mineralized colonies (CFU-OB), or colonies of fat-laden cells (CFU-AD) (data not shown). These data suggest that the innate potential of MSCs to acquire the osteoblastic or adipocytic phenotype is not affected by rosiglitazone. However, these measurements do not consider whether the multipotential character of bone marrow MSC, which change with aging (37, 38), are affected by rosiglitazone treatment.
In order to assess the multipotential phenotype of MSCs, experiments were designed based on the following rationale. We reasoned that the conversion of MSCs between lineages is, at least in part, permitted in these cells by the simultaneous expression of both, adipocytic (e.g. PPARγ2) and osteoblastic (e.g. Runx2) transcription factors. Previous evidence indicated that PPARγ activation converts multipotential MSCs to terminally differentiated adipocytes and irreversibly suppresses their osteoblast phenotype (10). Thus, rosiglitazone pretreatment of MSCs, that are capable of differentiation down both lineages, will result in a reduction in the number of cells capable of osteoblastic differentiation. However, if the MSCs have lost their bi-potential phenotype, such pretreatment will not affect the number of osteoblastic progenitors.
As shown in Figure 8A, the pretreatment of MSCs derived from adult control animals with rosiglitazone for 3 days, followed by stimulation towards osteoblastogenesis resulted in a significant decrease in the number of CFU-OB, compared to control. This suggests that the pool of adult MSC contains a significant number of rosiglitazone-sensitive osteoblast progenitors, presumably because they express PPARγ2. In contrast, the same rosiglitazone pretreatment of MSCs derived from adult rosiglitazone treated animals did not significantly reduce the number of CFU-OB (Figure 8A). Similarly, pretreatment of MSCs derived from old animals, either control or rosiglitazone-treated, did not affect the number of CFU-OB (Figure 8B). These data suggest that the osteoblastic progenitors derived from either rosiglitazone-treated adult or old animals are insensitive to rosiglitazone treatment in vitro and suggest that both, exposure to rosiglitazone in vivo and aging, produce a similar loss of rosiglitazone-responsiveness in the MSC compartment. Mechanistically, it is reasonable to presume that the in vivo exposure of multipotential MSCs, which express PPARγ2 to rosiglitazone results in the terminal differentiation toward adipocytes and a simultaneous suppression of the osteoblast phenotype.
Figure 8.
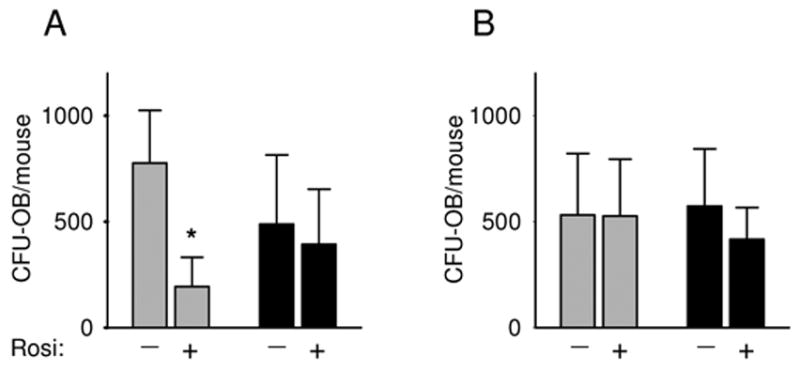
Effect of aging and rosiglitazone treatment on osteoblastic MSC differentiation. Bone marrow cells derived from adult (8 months old) (A) and old (26 months old) (B) animals were either pretreated (+) or not (−) with rosiglitazone (10−6 M) for 3 days. The cells were then cultured in pro-osteoblastic medium for the next 28 days followed by von Kossa staining to visualize mineralized colonies. The number of Von Kossa-stained CFU-OB was enumerated and calculated per total number of marrow cells isolated from two femora of individual mouse. Cultures were established separately from individual animals. The following number of animals in each group was analyzed: adult – 6 control and 4 rosiglitazone, old – 4 control and 6 rosiglitazone. Gray bars – control; black bars – rosiglitazone-treated animals. * p < 0.05 vs no treatment.
Discussion
We have previously postulated that an age-related increase in both, the expression of the adipocyte-specific PPARγ2 isoform and increased levels of natural PPARγ ligands, either locally produced in bone or delivered from the circulation, combined with a PPARγ2-mediated dominant negative effect on osteoblast phenotype, is a key mechanism in age-related bone loss (10, 11, 26). Here, we demonstrate that rosiglitazone induces skeletal changes, such as bone loss, closing of the epiphysis, marrow adiposity and altered marrow MSC phenotype, which are reminiscent of the bone changes that occur with aging. Moreover, aging appears to be a confounding factor for rosiglitazone-induced bone loss.
Rosiglitazone-induced structural, morphological and functional changes in the skeleton result in a decrease of both bone mass and bone strength, two important parameters of bone quality. At the cellular level, PPARγ activation leads to changes in marrow structure and function, which are similar to the observed age-related changes and include a decrease in the number of osteoblasts, an increase in the number of marrow fat cells, and an increase in the number of osteoclasts. These changes are reflected at the molecular level by the decreased expression of osteoblast- and increased expression of adipocyte-specific gene markers (2, 11), and the increased expression of RANKL; the latter leading to increased osteoclastogenesis. Finally, rosiglitazone changes the multipotential character of MSCs by decreasing their ability to interconvert between the osteoblastic and adipocytic lineages. In sum, rosiglitazone treatment in vivo modifies the phenotype of adult osteoblast progenitors to one which resembles the phenotype of osteoblast progenitors derived from old animals (11, 37, 38).
The prevalence of type 2 diabetes is growing with an estimated 20 million prescriptions written annually (39). In recent years, the age of patients diagnosed with type 2 diabetes has progressively decreased and the incidence of the disease amongst the very young has become even more common (40). In the animal model described here, rosiglitazone treatment induced significant bone loss in both adult and aged animals, but not in young growing animals, although bone formation rate was significantly decreased. When considered together with the observed changes in the morphology of the epiphysis in young animals following rosiglitazone treatment, we expect that a longer duration of treatment or higher doses would induce significant bone loss, primarily as a result of the sustained suppression of bone formation rate. This observation is of particular importance since TZD therapies are increasingly being considered for younger patients.
Rosiglitazone-induced bone loss in adult and old animals appears to occur via distinct cellular mechanisms. While bone loss in adult animals was associated with a decreased number of osteoblasts and decreased bone formation rate, the bone loss in old animals was a direct result of the increased osteoclast number. Based on the changes in the phenotype of bone marrow MSC, it is reasonable to conclude that in adult animals rosiglitazone targets osteoblast progenitors and drives them to differentiate toward the adipocyte lineage. In contrast, rosiglitazone treatment of old animals does not appear to affect the differentiation of osteoblastic progenitors, but instead alters MSC support for osteoclastogenesis. These possibilities are supported by data showing that the sensitivity of osteoblast progenitors to rosiglitazone decreases with aging. Consistent with this notion, in older animals the increased adipocyte number following rosiglitazone treatment does not occur at the expense of osteoblast differentiation. In addition, since rosiglitazone increased the RANKL/OPG ratio as well as osteoclast number, bone loss in old animals is likely a result of increased bone resorption. When considered in the context of the rosiglitazone-mediated increases in osteoclastogenesis observed in vivo, these results suggest that rosiglitazone, like aging, increases the ability of MSC to support osteoclastogenesis. Interestingly, this effect correlates with the age-dependent increase in PPARγ expression in the MSC compartment (11). In support of this idea, Sottile et al. have suggested that rosiglitazone-induced bone loss in ovariectomized rats is due to increased bone resorption, and not decreased bone formation (15). Based on the studies presented here, both age and bone formation rate are important factors in determining the mechanism of rosiglitazone-induced bone loss. If these data are confirmed in prospective clinical studies, it would argue strongly for the development of specific therapies, based on age and specific bone remodeling parameters, in order to prevent the bone loss associated with TZD therapy.
The role of PPARγ in the regulation of osteoclast development is complex. It is well documented that TZDs inhibit osteoclast differentiation and function through a direct action on cells of osteoclast lineage (34–36). Indeed, we have presented here that in in vitro conditions a presence of rosiglitazone directly affects a process of osteoclast recruitment from the pool of hematopoietic progenitors. Interestingly, in vivo rosiglitazone had no effect on the number of osteoclasts in young and adult animals, and increased osteoclast number in old animals. We and others suggest a role for PPARγ in driving the increased ability of mesenchymal marrow cells to support osteoclast development. Schwab et al. demonstrated previously that the PPARγ agonist ciglitazone increased mesenchymal cell support for osteoclast development (41). Similarly, we demonstrated that osteoclast development was augmented by rosiglitazone via a mechanism involving an apparent synergistic effect of PPARγ and vitamin D receptor (VDR) on RANKL expression. Recently, two groups simultaneously reported the identification of a new enhancer region for RANKL gene, which determines its transcriptional regulation in response to the pro-osteoclastogenic hormones, vitamin D3 and parathyroid hormone (42, 43). It would be of particular interest to examine, whether the cross talk between VDR and PPARγ2 in the regulation of RANKL gene expression also involves this region. More studies are warranted investigating the in vivo effects of TZDs on osteoclastogenesis and bone resorption.
During aging, the MSC compartment undergoes constant progressive changes, leading to the restricted differentiation potential of formerly multipotential cells (37, 38). These changes are considered a hallmark of the cellular senescence of marrow MSCs. We have observed that both rosiglitazone and aging change the phenotype of MSCs, from multipotential to monopotential lineage restricted cells. This alteration is manifested by a loss of the ability of osteoblastic cells to respond to rosiglitazone treatment, which may indicate the lack of or a decrease in PPARγ expression. By analogy to the lineage allocation of hematopoietic stem cells, osteoblast and adipocyte differentiation likely occurs by a stochastic process, which is determined and limited by the presence of phenotype-specific transcription factors (44). Thus, osteoblast and adipocyte development is determined by Runx2 and PPARγ2, respectively, which are simultaneously expressed in multipotential MSCs. A loss of one of these factors will render MSCs resistant to stimuli driving differentiation down the associated lineage. If so, osteoblast-committed MSCs from old animals represent a pool of cells that have lost their adipocytic potential, as determined by the absence of PPARγ2, and represent senescent osteoblast progenitors. This pool of cells is phenotypically distinct from the pool of osteoblastic progenitors resident in the adult marrow.
In support of the hypothesis of osteoblastic cellular senescence, it has been shown previously that the effect of rosiglitazone on osteoblast differentiation is dependent on the stage of their development (18). Thus, ex vivo treatment with rosiglitazone of “early” bone marrow cultures resulted in a decrease in osteoblast number and a suppression of osteoblast-specific gene markers, whereas treatment of “late” cultures did not affect osteoblast differentiation (18). By analogy, we consider adult MSCs to represent the “early” cultures, which possess a fraction of the multipotential cells, and old MSCs to represent “late” cultures, which primarily consist of lineage committed cells. Thus, the loss of the multipotential properties of adult MSC exposed to rosiglitazone in vivo, is reminiscent of the effect of aging on these cells.
Changes in the status of MSCs with aging result from both changes in the intrinsic differentiation potential and changes in the production of signaling molecules that contribute to the formation of a specific marrow micro-environment. Increases in the expression of PPARγ and in the production of its natural activators (e.g. oxidized fatty acids) during aging suggest the increased activity of the receptor. Increased activity of PPARγ (similar to aging) down-regulates the expression and activity of many regulatory pathways. We have demonstrated previously that aging and rosiglitazone down-regulate the activity of the TGF-β/BMP signaling pathway (11, 45). Interestingly, this is not the only osteogenic pathway impacted. Insulin-like growth factor 1 (IGF-1) signaling, a know regulator of skeletal homeostasis whose function decreases with aging, is also regulated by activation of PPARγ (46). Indeed, rosiglitazone decreases both the expression of IGF-1 and IGF-1 receptor in marrow MSC and decreases the level of circulating IGF-1 (46). These findings support the idea that rosiglitazone impacts skeletal metabolism via multiple mechanisms, which include a direct effect on MSC differentiation as well as endocrine and paracrine alterations of the marrow microenvironment.
In summary, rosiglitazone induces bone loss through its action on marrow mesenchymal cells and marrow microenvironment. The bone loss induced by rosiglitazone occurs via distinct mechanisms in both adult and aged mice. Our data suggest that these differences can be attributed to rosiglitazone effects on distinct cellular compartments. Aging and the level of PPARγ expression are confounding factors for mediating rosiglitazone-induced bone loss. Further investigation of the link between bone and fat at the molecular and cellular level is warranted and may provide new insight into the understanding of diseases such as diabetes and osteoporosis, and possibly enable the development of therapies effective for both.
Acknowledgments
The authors wish to thank Nisreen S. Akel for DEXA scans and analysis. This work was supported by National Institute on Aging Grant R01 AG1782 and American Diabetes Association Research Grant 1-03-RA-46 to BL-C and the Carl L. Nelson Chair of Orthoapedic Surgery to LJS.
Footnotes
Disclosure summary: The authors have nothing to disclose
Publisher's Disclaimer: NIH statement: “This is an un-copyedited author manuscript copyrighted by The Endocrine Society. This may not be duplicated or reproduced, other than for personal use or within the rule of “Fair Use of Copyrighted Materials” (section 107, Title 17, U.S. Code) without permission of the copyright owner, The Endocrine Society. From the time of acceptance following peer review, the full text of this manuscript is made freely available by The Endocrine Society at http://www.endojournals.org/. The final copy edited article can be found at http://www.endojournals.org/. The Endocrine Society disclaims any responsibility or liability for errors or omissions in this version of the manuscript or in any version derived from it by the National Institutes of Health or other parties. The citation of this article must include the following information: author(s), article title, journal title, year of publication and DOI.”
References
- 1.Bone Health and Osteoporosis: A report of the Surgeon General. US Department of Health and Human Services, Office of the Surgeon General; Rockville, MD: [PubMed] [Google Scholar]
- 2.Rzonca SO, Suva LJ, Gaddy D, Montague DC, Lecka-Czernik B. Bone is a target for the antidiabetic compound rosiglitazone. Endocrinology. 2004;145:401–6. doi: 10.1210/en.2003-0746. [DOI] [PMC free article] [PubMed] [Google Scholar]
- 3.Akune T, Ohba S, Kamekura S, Yamaguchi M, Chung UI, Kubota N, Terauchi Y, Harada Y, Azuma Y, Nakamura K, Kadowaki T, Kawaguchi H. PPARgamma insufficiency enhances osteogenesis through osteoblast formation from bone marrow progenitors. J Clin Invest. 2004;113:846–55. doi: 10.1172/JCI19900. [DOI] [PMC free article] [PubMed] [Google Scholar]
- 4.Lehrke M, Lazar MA. The many faces of PPARgamma. Cell. 2005;123:993–9. doi: 10.1016/j.cell.2005.11.026. [DOI] [PubMed] [Google Scholar]
- 5.Rosen CJ, Bouxsein ML. Mechanism of disease: is osteoporosis the obesity of bone? Nature Clinical Practice Rheumatology. 2006;2:35–43. doi: 10.1038/ncprheum0070. [DOI] [PubMed] [Google Scholar]
- 6.Manolagas SC. Cellular and molecular mechanisms of osteoporosis. Aging. 1998;10:182–90. doi: 10.1007/BF03339652. [DOI] [PubMed] [Google Scholar]
- 7.Moore SG, Dawson KL. Red and yellow marrow in the femur: age-related changes in appearance at MR imaging. Radiology. 1990;175:219–23. doi: 10.1148/radiology.175.1.2315484. [DOI] [PubMed] [Google Scholar]
- 8.Jiang Y, Jahagirdar BN, Reinhardt RL, Schwartz RE, Keene CD, Ortiz-Gonzalez XR, Reyes M, Lenvik T, Lund T, Blackstad M, Du J, Aldrich S, Lisberg A, Low WC, Largaespada DA, Verfaillie CM. Pluripotency of mesenchymal stem cells derived from adult marrow. Nature. 2002;418:41–9. doi: 10.1038/nature00870. [DOI] [PubMed] [Google Scholar]
- 9.Aubin JE. Regulation of osteoblast formation and function. Rev Endocr Metab Disord. 2001;2:81–94. doi: 10.1023/a:1010011209064. [DOI] [PubMed] [Google Scholar]
- 10.Lecka-Czernik B, Gubrij I, Moerman EA, Kajkenova O, Lipschitz DA, Manolagas SC, Jilka RL. Inhibition of Osf2/Cbfa1 expression and terminal osteoblast differentiation by PPAR-gamma 2. J Cell Biochem. 1999;74:357–371. [PubMed] [Google Scholar]
- 11.Moerman EJ, Teng K, Lipschitz DA, Lecka-Czernik B. Aging activates adipogenic and suppresses osteogenic programs in mesenchymal marrow stroma/stem cells: the role of PPAR-gamma2 transcription factor and TGF-beta/BMP signaling pathways. Aging Cell. 2004;3:379–89. doi: 10.1111/j.1474-9728.2004.00127.x. [DOI] [PMC free article] [PubMed] [Google Scholar]
- 12.Cao JJ, Wronski TJ, Iwaniec U, Phleger L, Kurimoto P, Boudignon B, Halloran BP. Aging increases stromal/osteoblastic cell-induced osteoclastogenesis and alters the osteoclast precursor pool in the mouse. J Bone Miner Res. 2005;20:1659–68. doi: 10.1359/JBMR.050503. [DOI] [PubMed] [Google Scholar]
- 13.Ren D, Collingwood TN, Rebar EJ, Wolffe AP, Camp HS. PPARgamma knockdown by engineered transcription factors: exogenous PPARgamma2 but not PPARgamma1 reactivates adipogenesis. Genes Dev. 2002;16:27–32. doi: 10.1101/gad.953802. [DOI] [PMC free article] [PubMed] [Google Scholar]
- 14.Willson TM, Lambert MH, Kliewer SA. Peroxisome proliferator-activated receptor gamma and metabolic disease. Annu Rev Biochem. 2001;70:341–67. doi: 10.1146/annurev.biochem.70.1.341. [DOI] [PubMed] [Google Scholar]
- 15.Sottile V, Seuwen K, Kneissel M. Enhanced marrow adipogenesis and bone resorption in estrogen-deprived rats treated with the PPARgamma agonist BRL49653 (rosiglitazone) Calcif Tissue Int. 2004;75:329–37. doi: 10.1007/s00223-004-0224-8. [DOI] [PubMed] [Google Scholar]
- 16.Soroceanu MA, Miao D, Bai XY, Su H, Goltzman D, Karaplis AC. Rosiglitazone impacts negatively on bone by promoting osteoblast/osteocyte apoptosis. J Endocrinol. 2004;183:203–16. doi: 10.1677/joe.1.05723. [DOI] [PubMed] [Google Scholar]
- 17.Cock TA, Back J, Elefteriou F, Karsenty G, Kastner P, Chan S, Auwerx J. Enhanced bone formation in lipodystrophic PPARgamma(hyp/hyp) mice relocates haematopoiesis to the spleen. EMBO Rep. 2004;5:1007–12. doi: 10.1038/sj.embor.7400254. [DOI] [PMC free article] [PubMed] [Google Scholar]
- 18.Ali AA, Weinstein RS, Stewart SA, Parfitt AM, Manolagas SC, Jilka RL. Rosiglitazone causes bone loss in mice by suppressing osteoblast differentiation and bone formation. Endocrinology. 2005;146:1226–1235. doi: 10.1210/en.2004-0735. [DOI] [PubMed] [Google Scholar]
- 19.Schwartz AV, Sellmeyer DE, Vittinghoff E, Palermo L, Lecka-Czernik B, Feingold KR, Strotmeyer ES, Resnick HE, Carbone L, Beamer BA, Won Park S, Lane NE, Harris TB, Cummings SR. Thiazolidinedione (TZD) Use and Bone Loss in Older Diabetic Adults. J Clin Endocrinol Metab. 2006;91:3349–3354. doi: 10.1210/jc.2005-2226. [DOI] [PMC free article] [PubMed] [Google Scholar]
- 20.Ogawa S, Urano T, Hosoi T, Miyao M, Hoshino S, Fujita M, Shiraki M, Orimo H, Ouchi Y, Inoue S. Association of bone mineral density with a polymorphism of the peroxisome proliferator-activated receptor gamma gene: PPARgamma expression in osteoblasts. Biochem Biophys Res Commun. 1999;260:122–6. doi: 10.1006/bbrc.1999.0896. [DOI] [PubMed] [Google Scholar]
- 21.Kiel DP, Ferrari S, Cupples LA, Karasik D, Dupuis J, Rosen CJ, Imamovic A, Demissie S. Polymorphism in the PPARg influence bone density in humans. J Bone Miner Res. 2005;20:S234. [Google Scholar]
- 22.Lazarenko OP, Rzonca SO, Suva LJ, Lecka-Czernik B. Netoglitazone is a PPAR-gamma ligand with selective effects on bone and fat. Bone. 2006;38:74–85. doi: 10.1016/j.bone.2005.07.008. [DOI] [PMC free article] [PubMed] [Google Scholar]
- 23.Aronson J, Hogue WR, Flahiff CM, Gao GG, Shen XC, Skinner RA, Badger TM, Lumpkin CK., Jr Development of tensile strength during distraction osteogenesis in a rat model. J Orthop Res. 2001;19:64–9. doi: 10.1016/S0736-0266(00)00002-4. [DOI] [PubMed] [Google Scholar]
- 24.Suva LJ, Seedor JG, Endo N, Quartuccio HA, Thompson DD, Bab I, Rodan GA. Pattern of gene expression following rat tibial marrow ablation. J Bone Miner Res. 1993;8:379–88. doi: 10.1002/jbmr.5650080315. [DOI] [PubMed] [Google Scholar]
- 25.Parfitt AM, Drezner MK, Glorieux FH, Kanis JA, Malluche H, Meunier PJ, Ott SM, Recker RR. Bone histomorphometry: standardization of nomenclature, symbols, and units. Report of the ASBMR Histomorphometry Nomenclature Committee. J Bone Miner Res. 1987;2:595–610. doi: 10.1002/jbmr.5650020617. [DOI] [PubMed] [Google Scholar]
- 26.Lecka-Czernik B, Moerman EJ, Grant DF, Lehmann JM, Manolagas SC, Jilka RL. Divergent effects of selective peroxisome proliferator-activated receptor-gamma 2 ligands on adipocyte versus osteoblast differentiation. Endocrinology. 2002;143:2376–84. doi: 10.1210/endo.143.6.8834. [DOI] [PubMed] [Google Scholar]
- 27.Halloran BP, Ferguson VL, Simske SJ, Burghardt A, Venton LL, Majumdar S. Changes in bone structure and mass with advancing age in the male C57BL/6J mouse. J Bone Miner Res. 2002;17:1044–50. doi: 10.1359/jbmr.2002.17.6.1044. [DOI] [PubMed] [Google Scholar]
- 28.Parfitt AM. Age-related structural changes in trabecular and cortical bone: cellular mechanisms and biomechanical consequences. Calcif Tissue Int. 1984;36:S123–8. doi: 10.1007/BF02406145. [DOI] [PubMed] [Google Scholar]
- 29.Werner AL, Travaglini MT. A review of rosiglitazone in type 2 diabetes mellitus. Pharmacotherapy. 2001;21:1082–99. doi: 10.1592/phco.21.13.1082.34615. [DOI] [PubMed] [Google Scholar]
- 30.Theoleyre S, Wittrant Y, Tat SK, Fortun Y, Redini F, Heymann D. The molecular triad OPG/RANK/RANKL: involvement in the orchestration of pathophysiological bone remodeling. Cytokine Growth Factor Rev. 2004;15:457–75. doi: 10.1016/j.cytogfr.2004.06.004. [DOI] [PubMed] [Google Scholar]
- 31.Teitelbaum SL, Ross FP. Genetic regulation of osteoclast development and function. Nat Rev Genet. 2003;4:638–49. doi: 10.1038/nrg1122. [DOI] [PubMed] [Google Scholar]
- 32.Asagiri M, Takayanagi H. The molecular understanding of osteoclast differentiation. Bone. 2007;40:251–264. doi: 10.1016/j.bone.2006.09.023. [DOI] [PubMed] [Google Scholar]
- 33.Teitelbaum SL, Tondravi MM, Ross FP. Osteoclasts, macrophages, and the molecular mechanisms of bone resorption. J Leukoc Biol. 1997;61:381–8. doi: 10.1002/jlb.61.4.381. [DOI] [PubMed] [Google Scholar]
- 34.Bendixen AC, Shevde NK, Dienger KM, Willson TM, Funk CD, Pike JW. IL-4 inhibits osteoclast formation through a direct action on osteoclast precursors via peroxisome proliferator-activated receptor gamma 1. Proc Natl Acad Sci U S A. 2001;98:2443–8. doi: 10.1073/pnas.041493198. [DOI] [PMC free article] [PubMed] [Google Scholar]
- 35.Okazaki R, Toriumi M, Fukumoto S, Miyamoto M, Fujita T, Tanaka K, Takeuchi Y. Thiazolidinediones inhibit osteoclast-like cell formation and bone resorption in vitro. Endocrinology. 1999;140:5060–5. doi: 10.1210/endo.140.11.7116. [DOI] [PubMed] [Google Scholar]
- 36.Chan BY, Gartland A, Wilson PJ, Buckley KA, Dillon JP, Fraser WD, Gallagher JA. PPAR agonists modulate human osteoclast formation and activity in vitro. Bone. 2007;40:149–159. doi: 10.1016/j.bone.2006.07.029. [DOI] [PubMed] [Google Scholar]
- 37.Muraglia A, Cancedda R, Quarto R. Clonal mesenchymal progenitors from human bone marrow differentiate in vitro according to a hierarchical model. J Cell Sci. 2000;113:1161–6. doi: 10.1242/jcs.113.7.1161. [DOI] [PubMed] [Google Scholar]
- 38.Fehrer C, Lepperdinger G. Mesenchymal stem cell aging. Exp Gerontol. 2005;40:926–30. doi: 10.1016/j.exger.2005.07.006. [DOI] [PubMed] [Google Scholar]
- 39.Watts NB, D’Alessio DA. Type 2 diabetes, thiazolidinediones: bad to the bone? J Clin Endocrinol Metab. 2006;91:3276–8. doi: 10.1210/jc.2006-1235. [DOI] [PubMed] [Google Scholar]
- 40.Silverstein JH, Rosenbloom AL. Type 2 diabetes in children. Curr Diab Rep. 2001;1:19–27. doi: 10.1007/s11892-001-0006-x. [DOI] [PubMed] [Google Scholar]
- 41.Schwab AM, Granholm S, Persson E, Wilkes B, Lerner UH, Conaway HH. Stimulation of resorption in cultured mouse calvarial bones by thiazolidinediones. Endocrinology. 2005;146:4349–61. doi: 10.1210/en.2005-0601. [DOI] [PubMed] [Google Scholar]
- 42.Kim S, Yamazaki M, Zella LA, Shevde NK, Pike JW. Activation of receptor activator of NF-kappaB ligand gene expression by 1,25-dihydroxyvitamin D3 is mediated through multiple long-range enhancers. Mol Cell Biol. 2006;26:6469–86. doi: 10.1128/MCB.00353-06. [DOI] [PMC free article] [PubMed] [Google Scholar]
- 43.Fu Q, Manolagas SC, O’Brien CA. Parathyroid hormone controls receptor activator of NF-kappaB ligand gene expression via a distant transcriptional enhancer. Mol Cell Biol. 2006;26:6453–68. doi: 10.1128/MCB.00356-06. [DOI] [PMC free article] [PubMed] [Google Scholar]
- 44.Laslo P, Spooner CJ, Warmflash A, Lancki DW, Lee HJ, Sciammas R, Gantner BN, Dinner AR, Singh H. Multilineage transcriptional priming and determination of alternate hematopoietic cell fates. Cell. 2006;126:755–66. doi: 10.1016/j.cell.2006.06.052. [DOI] [PubMed] [Google Scholar]
- 45.Lecka-Czernik B, Teng K, Lazarenko OP. Glitazones, the anti-diabetic PPAR-g agonists, suppress osteoblast differentiation and the activity of TGF-β/BMP signaling pathways. J Bone Miner Res. 2004;19:SA171. [Google Scholar]
- 46.Lecka-Czernik B, Ackert-Bicknell C, Adamo ML, Marmolejos V, Churchill GA, Shockley KR, Reid IR, Grey A, Rosen CJ. Activation of peroxisome proliferator-activated receptor gamma (PPARgamma) by rosiglitazone suppresses components of the insulin-like growth factor regulatory system in vitro and in vivo. Endocrinology. 2007;148:903–11. doi: 10.1210/en.2006-1121. [DOI] [PMC free article] [PubMed] [Google Scholar]