

Abstract
MT1-MMP is a key integral membrane protease which regulates tumor growth by cleaving extracellular matrix components, activating growth factors and receptors, and consequently, triggering downstream signals. To study what genes or pathways are mediated by endogenous MT1-MMP during tumor growth in vivo, we stably suppressed endogenous MT1-MMP in human tumor cells using RNA interference. Tumor growth was significantly reduced in tumors derived from MT1-MMP suppressed cells relative to control cells; the effect was rescued in cells engineered to re-express MT1-MMP expression. Gene expression profiling of cultured and tumor derived cells by DNA microarray and real-time RT-PCR revealed that Smad1 expression was upregulated in MT1-MMP expressing cells and rapidly growing tumors; this was confirmed in four additional tumor cell lines. Furthermore, tumor growth of MT1-MMP expressing cells was reduced when Smad1 was suppressed by RNA interference. We also found that the active form, but not the latent form, of TGF-β was capable in promoting Smad1 expression and 3D cell proliferation in MT1-MMP suppressed cells. In addition, a dominant-negative form of the TGF-β type II receptor reduced Smad1 expression in MT1-MMP expressing cells. Thus, we propose that MT1-MMP functions, in part, to promote tumor growth by inducing the expression of Smad1 via TGF-β signaling.
Keywords: MT1-MMP, Smad1, TGF-β, tumor growth, RNA interference
Introduction
The cell surface-bound protease membrane type 1 matrix metalloproteinase (MT1-MMP) is a potent modulator of the pericellular environment. Studies have found that over-expression or conditional expression of MT1-MMP enhances tumor growth of many different types of tumor cells.1–3 Dominant-negative mutants in several cell lines demonstrated that the catalytic domain of membrane-bound MT1-MMP is responsible for tumor activity.1 The catalytic domain is necessary for the activation of many other proteases such as proMMP-2 and the processing of extracellular matrix (ECM) components, which have been thought to be important for its tumor-promoting ability. Hotary and colleagues4 have shown that MT1-MMP regulates cellular proliferation in both three-dimensional (3D) collagen and within the tumor microenvironment by controlling cell geometry within the confines of the 3D ECM, a function that requires pericellular proteolysis of the ECM.
MT1-MMP may also play a role in tumor growth by activating growth factors and receptors. Although a potential signaling pathway controlling MT1-MMP dependent tumor growth is not available, many signaling pathways are associated with tumor growth. For instance, bone morphogenetic protein-2 (BMP-2) and transforming growth factor-β (TGF-β) and their associated signaling pathways can promote growth.5–8 Smad1 is an important transducer of both BMP-2 and TGF-β signals and has been shown to enhance tumor progression.9–14 Smad1 is also involved in the crosstalk between BMP/TGF-β and Ras/MEK pathways and regulation of these pathways is critical for tumor progression.15,16 Although it is known that Smad1 directly regulates transcription of a variety of genes implicated in tumor growth such as collagen IV17, myc18, and p21WAF1/Cip119, it is not yet clear what mediates Smad1 expression.
The purpose of this study was to determine a functional linkage between MT1-MMP and a signaling pathway that regulates tumor growth. We stably suppressed endogenous MT1-MMP expression in human tumor cells using a novel RNA interference (RNAi) vector to study MT1-MMP-dependent tumor growth in vivo. This approach enabled us to use gene expression profiling to determine potential gene candidates that may contribute to the significant reduction of tumor growth when MT1-MMP was suppressed. We found through microarray analysis and confirmed by real-time RT-PCR that Smad1 was a gene product whose expression positively correlated with MT1-MMP in five tumor cell lines (HT1080, PC3, SW620, SKOV3, and MDA231) and was suppressed when MT1-MMP was knocked down in three different cell lines. In addition, RNAi knockdown of Smad1 in MT1-MMP expressing HT1080 cells impaired tumor growth. Furthermore, we discovered that active TGF-β, but not many other growth factors nor latent TGF-β, was able to induce Smad1 expression and 3D cell proliferation in MT1-MMP suppressed cells. Lastly, a dominant-negative form of the TGF-β type II receptor reduced Smad1 expression in MT1-MMP expressing cells. Together, these results link the signaling molecule Smad1 to MT1-MMP-mediated tumor growth. A model for the proposed signaling pathway involving the promotion of tumor growth by MT1-MMP is discussed.
Materials and Methods
RNA interference and rescue plasmid constructs
The RNAi vector was constructed by inserting the U6 promoter into pEGFPC1 (Clontech, Mountain View, CA) and named pGUS. To design the DNA oligonucleotides for expression of MT1-MMP and Smad1 specific short hairpin RNAs (shRNAs), sense strand sequences were identified by scanning the length of the target mRNAs for the AAG sequence. The sequences beginning with G and including an additional 26 downstream nucleotides were analyzed by a BLAST search to ensure that both the sense sequences and their corresponding antisense sequences did not have significant homology to other genes. The 27-nt sense sequences were inserted into pGUS immediately downstream of the U6 promoter between the Bpu AI and BspLU11I sites, followed by a 7-nt spacer bearing a Hind III site, the 27-nt antisense strand sequence, and the U6 terminator sequence consisting of 6 thymidines. The DNA oligonucleotides that were synthesized to create the RNAi vectors in this study corresponded to nucleotides 98–124, 122–148, 2475–2501 of the MT1-MMP cDNA (gi:13027797) and 394–420, 1868–1894, 2651–2677 of the Smad1 cDNA (gi:1332713). An additional DNA oligonucleotide was created based on the random sense strand sequence 5’-AGCACTGACGAAGCGCGGA-3’.
To generate the MT1-MMP rescue vector, the open reading frame of MT1-MMP was inserted into the pcDNA3.1/Zeo vector (Invitrogen, Carlsbad, CA) and was driven by the full-length, endogenous MT1-MMP promoter rather than the CMV promoter. The MT1-MMP promoter was amplified from human genomic DNA using the following primers: 5’-CTGACGATCTCGAGTGGAACTAAACCCCAGAGTCC-3’ and 5’-CTGAAGCTAAGCTTG GTCCGAGACCACCGGGTCAG-3’.
Cell culture and transfection
HT1080, PC3, SW620, SKOV3, and MDA231 cell lines were obtained from American Type Culture Collection (Manassas, VA). The cells were grown in DMEM (Gibco, Grand Island, NY) supplemented with 10% Fetal Calf Serum (Gibco), 10% Nu-Serum (BD Biosciences, Bedford, MA), 1% L-Glutamine (Gibco), and 1% Penicillin-Streptomycin (Gibco). Cells were maintained in a humidified 37°C incubator with 5% CO2. Cells were transfected using Lipofectamine™ 2000 (Invitrogen) according to manufacturer’s specifications. RNAi clones were selected based on Geneticin® (G418, Roche Applied Science, Indianapolis, IN) resistance and green fluorescent protein (GFP) expression. The MT1-MMP rescue clone were selected using Zeocin™ (Invitrogen). The concentrations of platelet-derived growth factor (PDGF) and fibroblast growth factor (FGF) (StemCell Technologies Inc, Vancouver, BC), epidermal growth factor (EGF), BMP-2, active and latent TGF-β, and the TGF-B inhibitor (R&D Systems, Minneapolis, MN) used were based on manufacturer’s recommendations.
Quantitative real-time RT-PCR
Total RNAs were purified from cells and tumors by RNeasy® Mini Kit (Qiagen, Valencia, CA). RNAs were reverse transcribed by 1st Strand cDNA Synthesis Kit for RT-PCR (AMV, Roche Applied Science) with random primers supplied by the kit. The following primers were used for real-time RT-PCR: MT1ORF-RT-left, 5’-GGAATAACCAAGTGATGGATGG-3’; MT1ORF-RT-right, 5’-TTGTTTCCACGGAAGAAGTAGG-3’; SMAD1-RT-left, 5’-ACTG CCTCATGTCATTTACTGC-3’; SMAD1-RT-right, 5’-CTATTGGGAGAGTGAGGAAACG-3’; ACT-RT-left, 5’-AGATGACCCAGATCATGTTTGA-3’; and ACT-RT-right, 5’-GCACAG CTTCTCCTT AATGTCA-3’. All primers were specific for their respective genes as confirmed by BLAST. Quantitect™ SYBR Green PCR Kit (Qiagen) was used to prepare PCR reactions according to manufacturer specifications. Real-time RT-PCR was performed by Opticon machine (MJ Research, Watertown, MA) and analyzed with OpticonMONITOR™ Analysis Software Version 2.02 (MJ Research). PCR conditions were: 95°C for 10 min, 40 cycles of 94°C for 30 s, 60°C for 30 s, and 72°C for 90 s. To generate standard curves, the cDNA derived from GUS-2 cells was serially diluted and used in the same PCR reaction. All MT1-MMP and Smad1 expression levels were normalized to β-actin.
Western immunoblotting
Cells and tumor samples were lysed in RLN buffer (50 mM TrisCl pH 8.0, 140 mM NaCl, 1.5 mM MgCl, 0.5% Nonidet P-40) and centrifuged at 10,000 x g. Supernatants were boiled and run on a 10% SDS-PAGE gel. Samples were transferred to nitrocellulose membrane (Schleicher & Schuell, Keene, NH) and probed with an antibody against MT1-MMP (1:1000, Triple Point Biologics, Forest Grove, OR) or Smad1 (1:125, Zymed Laboratories, South San Francisco, CA). The membrane was stripped and reprobed with an actin antibody (1:1000, Sigma, Saint Louis, MO). Signal was detected using secondary antibodies (Sigma) labeled with horse radish peroxidase and the Western Lightning™ Chemiluminescence Reagent Plus (PerkinElmer, Boston, MA).
Gelatin zymography
Serum-free media conditioned by different cultured tumor cells were collected and centrifuged at 300 x g and tumor samples were lysed in RLN buffer (50 mM TrisCl pH 8.0, 140 mM NaCl, 1.5 mM MgCl, 0.5% Nonidet P-40) and centrifuged at 10,000 x g. Supernatants from the cells and tumors were separated on a 10% SDS-PAGE gel containing 0.1% gelatin. The gel was washed with 0.1% Triton-X-100 in TBS and incubated in 20 mM CaCl2 in TBS for two days at 37°C. The gels were then stained with Coomassie® Brillant Blue (Bio-Rad, Hercules, CA) to detect gelatinase activity.
Microarray data analysis
Total RNAs from cultured and tumor derived HT1080 clones were purified by RNeasy® Mini Kit (Qiagen) and then subjected to DNA microarraying. Generation of cRNA, labeling, hybridization, and scanning of the Affymetrix high-density oligonucleotide microarray chip (Hu133A, 22,283 probe sets) were performed according to the manufacturer’s specifications (Affymetrix, Santa Clara, CA). Analysis of each chip was performed using the Affymetrix Microarray Suite 5.1 Software to generate raw expression data. GeneSpring 7.2 software (Silicon Genetics, Redwood City, CA) was used to perform statistical analysis and investigate the variation in gene expression. The expression data analysis of normal and tumor tissue samples was derived from NCBI’s Gene Expression Omnibus (GEO) Profiles Database found at http://www.ncbi.nlm.nih.gov/geo/.
Two- and three-dimensional proliferation assays
For the two-dimensional (2D) proliferation assay, cells were seeded (1 x 10⁴ cells/well) on 6-well plates on day 0. On days 2, 4 and 6, cells were trypsinized, stained with 0.4% trypan blue stain (Gibco) for cell viability, and counted using a hemocytometer.20 Each data point represents the average of four separate quantifications. For the 3D proliferation assay, 100 nl of thawed Growth Factor Reduced BD Matrigel™ Matrix (BD Biosciences, Bedford, MA) was added to each well of a cold 24-well plate. The plate was rocked back and forth to coat the bottom of the well evenly and then incubated at 37ºC for 30 min. The plate was then cooled to 15–20ºC. Cells (5 x 10³) suspended in 20 nl of serum containing media were added to 80 nl of matrigel. The mixture was quickly added to the plate and rocked back and forth. The plates were incubated at 37ºC. Serum containing media (100 nl) was added to each well as needed to keep the matrigel moist. Growth was monitored daily. On day 10, the matrigel was digested using collagenase/dispase (Roche Applied Science) and trypsin (Gibco), cells were stained with 0.4% trypan blue stain (Gibco) and counted using a hemocytometer.20 Each data point represents the average of four separate counts.
Tumorigenesis model
The Stony Brook University Institutional Animal Care and Use Committee has approved this protocol. Rapidly growing cells (1 x 10⁶ cells/site) were suspended in serum free medium and injected s.c. (100 μl/site) into both flanks of 4- to 6-week old female Ncr nude mice (Taconic, Hudson, NY). Tumors were measured every two days in three dimensions to calculate tumor growth over a 24 day period. Equal sized tumors (approximately 0.144 cm3) derived from both MT1-MMP expressing and suppressed cells were harvested and fixed in 4% paraformaldehyde for histological analysis or placed in RNAlater (Qiagen) for subsequent RNA extraction.
Immunohistochemistry of tumors
Approximately equal sized tumor samples, days 11–14 post injection, were immediately fixed in 4% paraformaldehyde and paraffin embedded by standard methods. Antigens were unmasked using Antigen Unmasking Solution (Vector Labs, Burlingame, CA), endogenous peroxidase activities were blocked with hydrogen peroxide, and sections were stained by standard immunohistochemical techniques using antibodies against Ki67 (1:100, Novocastra, United Kingdom) or cleaved caspase-3 (1:50, Cell Signaling Technology, Danvers, MA) for 1.5 h at 25°C. Detection was performed by incubation with a diluted biotinylated anti-mouse or rabbit antibody (Vector Labs, Burlingame, CA) at 1:200 for 40 min at 25°C and visualized using avidin-biotin complex method and 3,3’-diaminobenzidine (Vector Labs) according to manufacturer’s suggestion. Sections were counterstained with Gill’s hematoxylin (Fisher Scientific, Fair Lawn, NJ). Negative controls (mouse or rabbit serum) did not produce a stain (data not shown). Counting was performed on three randomly chosen sections of each tumor.
Statistical analysis
Statistical analyses were performed using GraphPad Prism® Software (GraphPad Software, Inc, San Diego, CA). One-way ANOVA and unpaired t test were used to compare specific groups. Values shown are the means ± SE. Statistical significance was defined as P < 0.05.
Results
Establishment and analysis of MT1-MMP RNAi and rescue clones
To examine the function of endogenous MT1-MMP in tumor growth, we used gene transfer methods to stably suppress MT1-MMP in HT1080 human fibrosarcoma cells, which have high endogenous levels of MT1-MMP and proMMP-2. Because short hairpin RNAs (shRNAs) can induce sequence-specific silencing in mammalian cells,21 we generated a new RNAi vector system, pGUS, that simultaneously directs synthesis of GFP protein and shRNAs. Fig. 1a illustrates pGUS, its gene target inserts, and the MT1-MMP rescue vector. The pGUS vector without a DNA oligonucleotide insert or with a random sequence, with no homology to either a human or a mouse gene, were used as negative controls. The random shRNA had no mRNA target and its presence did not cause any noticeable or measurable difference in the cells compared to HT1080 parental or pGUS transfected cells. Three different MT1-MMP specific shRNAs, MT1-98, MT1-122, and MT1-2475, were designed to target the MT1-MMP mRNA at different locations within 5’ and 3’ untranslated regions of the mRNA (Fig. 1b).
FIGURE 1.
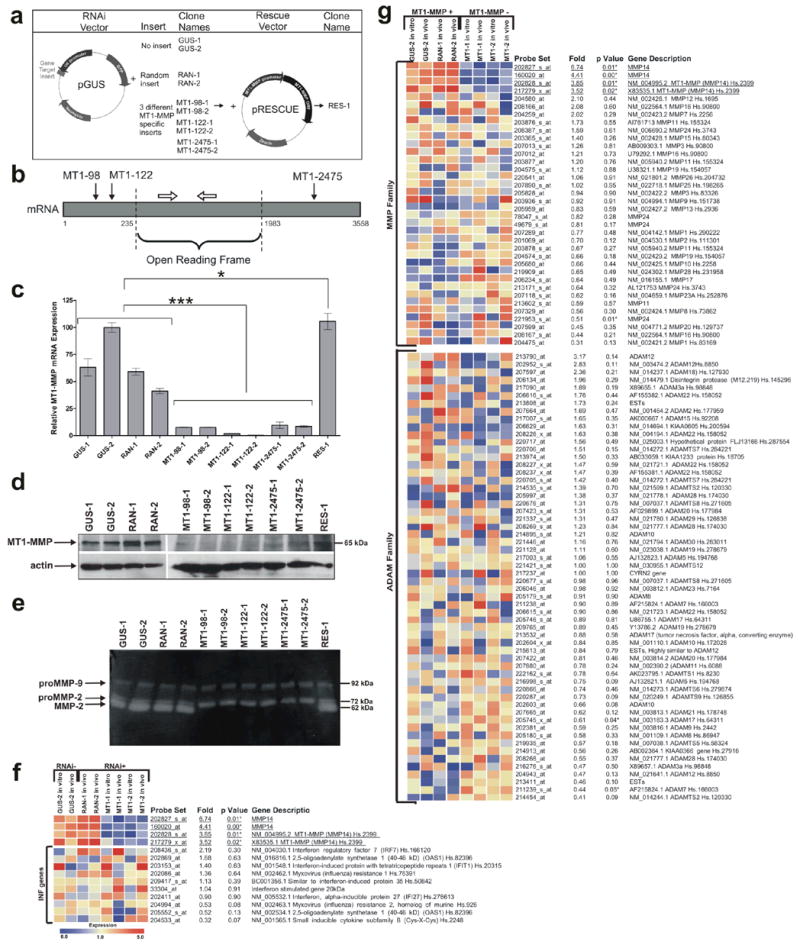
Specific RNAi suppression of MT1-MMP expression and activity in HT1080 cells. (a) An overview of the RNAi knockdown and rescue of MT1-MMP. Gene target inserts coding for the shRNAs were cloned into the RNAi vector pGUS. For each DNA insert, the two best clones were selected. MT1-MMP suppressed cells were transfected with the pRESCUE vector containing the MT1-MMP open reading frame and the selected clone was named RES-1. (b) A schematic diagram illustrating the RNAi target sites in the mRNA. The solid arrows indicate the relative target locations within the MT1-MMP mRNA (grey box) of the three MT1-MMP specific shRNAs. The open arrows represent real-time primers used to amplify a region of the MT1-MMP mRNA within the open reading frame. Diagram is not to scale. (c) Real-time RT-PCR quantifying the relative MT1-MMP mRNA expression level of all the clones. MT1-MMP mRNA was suppressed in HT1080 clones expressing MT1-MMP specific shRNAs (***, P < 0.0001, n=3). The RES-1 clone showed successful rescue of MT1-MMP expression (*, P < 0.05, n=3). (d) Western analysis using an anti-MT1-MMP antibody. MT1-MMP suppression occurred at the protein level in cells with RNAi knockdown and MT1-MMP was re-expressed in the rescue clone. Actin was used as a quantitative control. (e) Evaluation of proMMP-2 activation in HT1080 clones using gelatin zymography. Similar amounts of conditioned media from all the clones were run on a polyacrylamide gel containing 0.1% gelatin, incubated to allow gelatinase activity to occur, and stained to examine changes in proMMP-2 activation. proMMP-2 was not activated in the MT1-MMP shRNA expressing clones. (f) Expression profile of several interferon response genes. Comparison of clones without shRNAs (RNAi −) to those expressing shRNAs (RNAi +) showed there was no significant change (note all P > 0.05) in the expression of the genes examined. (g) Expression profiles of all the MMP and ADAM family genes found on the Affymetrix Hu133A microarray chip. The four probe sets for MT1-MMP (underlined), also known as MMP-14, showed a significant change in MT1-MMP expression when the MT1-MMP expressing (MT1-MMP +) and suppressed clones (MT1-MMP −) were compared.
Neomycin resistant, GFP-labeled clones were selected by quantitative real-time RT-PCR analysis to confirm MT1-MMP suppression (Fig. 1c). GUS-1, GUS-2, RAN-1, and RAN-2 had high levels of endogenous MT1-MMP expression. For each of the three MT1-MMP targeting vectors, MT1-98, MT1-122, and MT1-2475, two clones with the greatest suppression, approximately 90–99%, of MT1-MMP were selected (P < 0.0001, n=3). Several of the MT1-MMP suppressed clones were transfected with the pRESCUE vector containing the MT1-MMP open reading frame (Fig. 1a), and after zeocin drug selection, the clone expressing the highest level of MT1-MMP, RES-1, was selected by real-time RT-PCR (Fig. 1c). Because the MT1-MMP specific shRNAs did not target the open reading frame, the ectopic MT1-MMP successfully rescued MT1-MMP expression (P < 0.05, n=3) to a level approximately equal to that of the highest expressing MT1-MMP clone, GUS-2. Consistently, suppression and rescue of MT1-MMP protein expression were demonstrated by Western immunoblotting (Fig. 1d).
We also wanted to confirm that MT1-MMP activity, i.e. proMMP-2 activation, was also reduced in the RNAi clones and reestablished in the MT1-MMP rescue clone. To examine proMMP-2 activation, similar amounts of serum free conditioned media from MT1-MMP expressing and suppressed clones were loaded on a gelatin zymogram. All MT1-MMP expressing clones including the rescue clone were able to activate proMMP-2 to its smaller MMP-2 form as indicated in the gel (Fig. 1e). None of the MT1-MMP suppressed clones showed activation of proMMP-2. There was no change in proMMP-9 expression level or activity.
We used microarray analysis to verify that the RNAi vectors and their resultant shRNAs did not stimulate non-specific effects such as the induction of interferon target genes, previously shown to be non-specifically induced by shRNAs in some mammalian cells22. When the mean RNA expression levels of the top nine interferon response genes (10 probe sets) as described by Bridge et al.22 were compared between non-shRNA expressing cells (RNAi −) and the shRNA expressing cells (RNAi +), none of interferon response genes were significantly induced in the shRNA expressing samples (note all P > 0.05) (Fig. 1f).
MT1-MMP suppression specificity, particularly the shRNA targeting specificity and the effect of MT1-MMP suppression on other proteases, was also demonstrated by comparing the mean RNA expression levels of MMP and ADAM family members from MT1-MMP expressed (+) and suppressed (−) cells (Fig. 1g). The Affymetrix Hu133A chips contained four probe sets representing MT1-MMP (Fig. 1f and g underlined). Aside from MT1-MMP, the only other members of the MMP and ADAM families that had significantly (P < 0.05) altered gene expression among all eight samples were MMP-24, ADAM-17, and ADAM-7. However, when real-time RT-PCR was used to confirm these changes in RNA expression, none of them could be confirmed (data not shown).
We have also examined close hit genes with sequence homology to the selected target sequences. Microarray was performed using cells transfected with the MT1-2475 shRNA containing a 27 nucleotide target. Using this 27 nucleotide sequence, the NCBI Reference Sequence (RefSeq) Transcript (RNA) Database identified four other potential human targets including IL12RB2, ZNF204, IFIT1, and LDHAL6B. When we examined these four genes by microarray, there was no significant difference in their expression when MT1-MMP expressing and suppressed samples were compared (data not shown). Together, these data demonstrate specific suppression of MT1-MMP expression and activity in HT1080 cells using RNAi and subsequent rescue using expression vectors.
The effect of endogenous MT1-MMP on cellular proliferation in two- and three-dimensional culture and tumor growth
Since cells proliferate at different rates depending on their microenvironment,4,23–25 we examined the effect of MT1-MMP expression on growth in conventional 2D culture, within 3D matrigel, and in vivo. When cells were grown in 2D on plastic plates (Fig. 2a) or on top of matrigel (data not shown) and counted on days 2, 4, and 6, there was no difference in cell number at any time point regardless of MT1-MMP expression (P > 0.05, n=4). When cells were grown within Growth Factor Reduced BD Matrigel™ Matrix, there was a two-fold reduction in cell number (P < 0.0001, n=4) when MT1-MMP was suppressed, compared to controls, when the cells were counted on day 10 (Fig. 2b). When cells were injected s.c. into nude mice, there was approximately a five-fold reduction of growth (P < 0.05, n=5) in the tumors derived from MT1-MMP suppressed cells relative to MT1-MMP expressing cells by day 24 (Fig. 2c).
FIGURE 2.
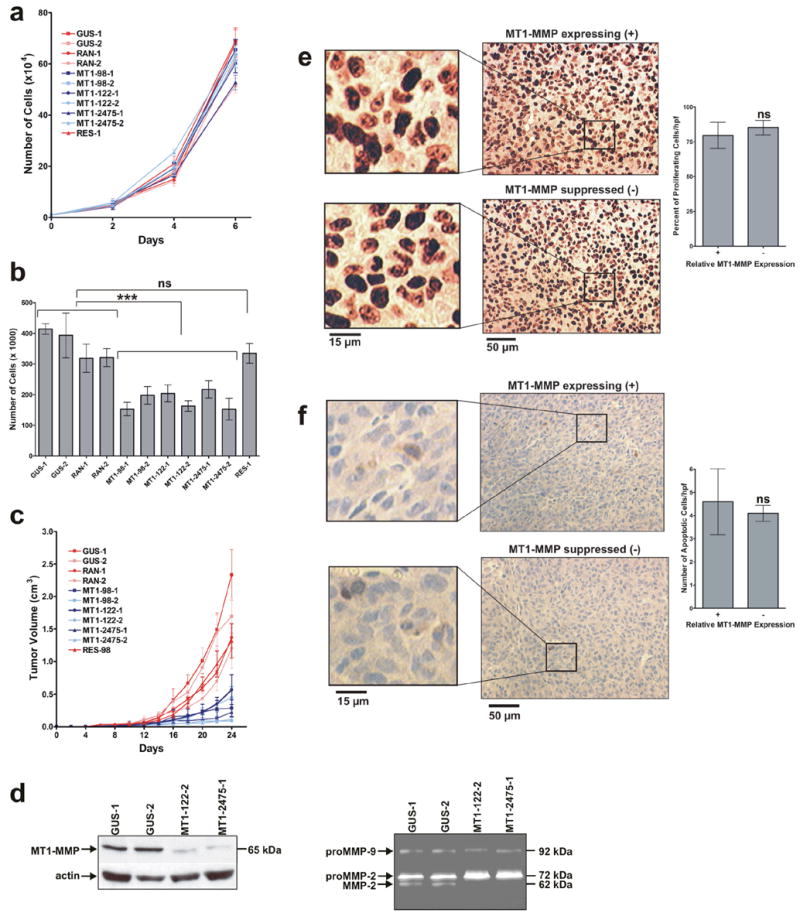
MT1-MMP enhanced 3D cellular proliferation in matrigel and tumor growth while not affecting cellular proliferation in 2D culture. (a) Proliferation of the HT1080 clones in conventional 2D culture. Equal number of cells for each HT1080 clone (1 x 10⁴) were seeded onto plates on day 0 and counted on days 2, 4, and 6. There was no significant difference in the number of cells at any time point (P > 0.05, n=4). (b) Proliferation of the HT1080 clones within 3D matrigel. Equal number of cells for each HT1080 clone (5 x 10⁴) were seeded within Growth Factor Reduced BD Matrigel™ Matrix on day 0 and and counted on day 10. There was an approximate two-fold reduction in cell number of MT1-MMP suppressed clones relative to MT1-MMP expressing clones (***, P < 0.0001, n=4). There was no significant difference between the number of RES-1 cells and the control MT1-MMP expressing cells (ns, P > 0.05, n=4). (c) Growth of tumors derived from HT1080 clones. HT1080 clones were injected s.c. into the flanks of Ncr nude mice and the primary tumor volume was measured every two days. There was approximately a five-fold reduction in the volume of tumors derived from MT1-MMP suppressed clones relative to MT1-MMP expressing clones (P < 0.05, n=5). (d) Protease protein expression and activity in tumor tissue. Western analysis of tumor lysates (left panel) indicate MT1-MMP remained suppressed in the tumor tissues derived from the selected RNAi clones. Gelatin zymography (right panel) indicated proMMP-2 was not activated to its active MMP-2 form in the tumor tissues derived from MT1-MMP suppressed clones. (e–f) Immunohistological staining of proliferation and apoptosis markers within MT1-MMP expressing (+) and suppressed (−) tumor sections. There was no significant difference in the percent of proliferating cells per field (200 x 300 μm) as indicated by nuclear staining of Ki67 (d) nor in the number of apoptotic cells per field as shown by activated caspase-3 staining (e) when approximately equivalent sized MT1-MMP expressing and suppressed tumors were compared (P > 0.05, n=3).
Even when tumors derived from MT1-MMP suppressed cells were left to grow for 50 days, there was no further growth beyond day 24 (data not shown). Tumor samples were also examined to confirm that MT1-MMP expression (Fig. 2d, left panel) and activity (Fig. 2d, right panel), in particular the activation of MMP-2, remained suppressed in vivo in the RNAi clones. MT1-MMP expression did not affect the percent of proliferating cells per field (Fig. 2e) when sections of approximately equal sized tumors (from days 11–14) were stained for the nuclear-localized proliferation marker Ki67 (P > 0.05, n=3). The tumor sections were also stained with antibodies against activated caspase-3 to examine apoptosis; however, there was no detectable apoptotic difference in the tumors (P > 0.05, n=3) derived from cells with contrasting levels of MT1-MMP expression (Fig. 2f). Collectively, these data show that MT1-MMP enhanced 3D cellular proliferation and tumor growth, however, did not affect proliferation in 2D culture.
Identification and confirmation that Smad1 expression coincides with MT1-MMP during tumor growth
To determine the genes that may be involved in MT1-MMP dependent tumor growth, gene expression profiling was performed. The eight microarray samples were divided into two groups, four MT1-MMP expressing clones and four MT1-MMP suppressed clones, and Gene Spring Software was used to generate a list of genes that met the following criteria: fold change ≥ 2, P ≤ 0.05, and Presence Call ≥ 2. In addition, the five samples derived from in vivo tumors were divided into two groups: the three largest tumors compared to the two smallest tumors; and the above mentioned criteria were used. Genes that met the criteria for both parameters were used to generate a list of 46 genes (Fig. 3a) whose expression may be influenced by MT1-MMP expression and tumor growth. Nine genes plus two MT1-MMP probe sets (underlined) had significantly higher expression and 35 genes had lower expression in the MT1-MMP expressing clones compared to the suppressed clones.
FIGURE 3.
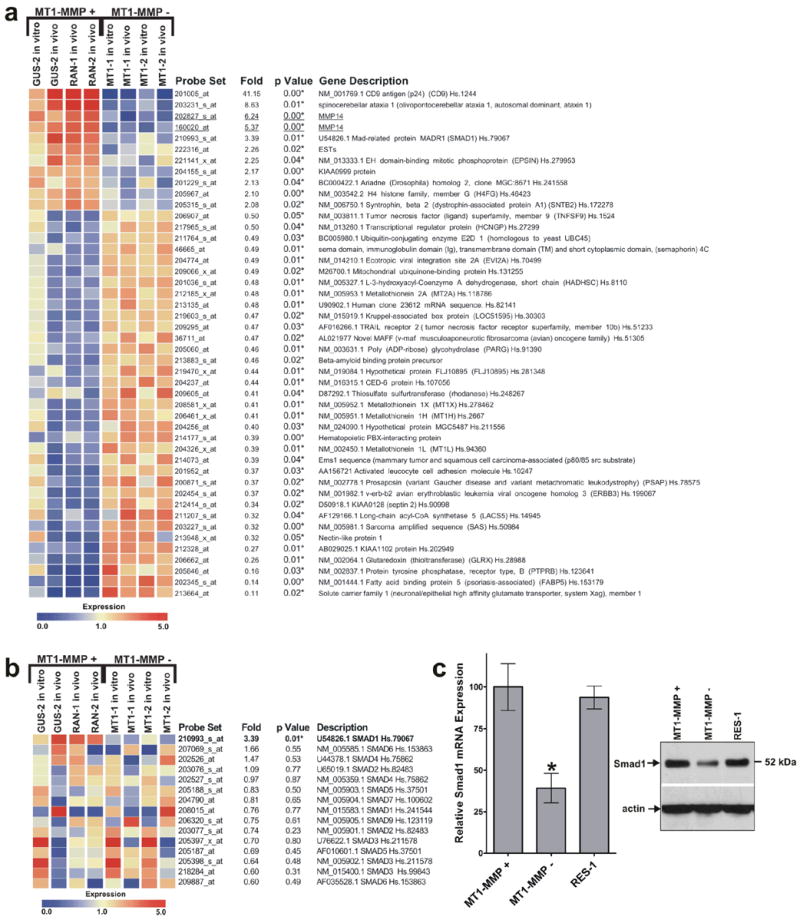
Smad1 expression is reduced in MT1-MMP suppressed cells. (a) Microarray analysis of genes that may be regulated by MT1-MMP expression and tumor growth. Nine genes were upregulated and 35 genes were downregulated in MT1-MMP expressing cells. One of the nine upregulated genes was Smad1 which indicated a 3.39 fold difference in expression when MT1-MMP expressing and suppressed cells were compared (P = 0.01). (b) Expression profile of all Smad family members found on the Affymetrix Hu133A microarray chip. Smad1 was the only Smad family member that was significantly (P < 0.05, indicated by *) altered by MT1-MMP expression and tumor growth. (c) Real-time RT-PCR and western blot analysis quantifying the relative Smad1 mRNA and protein expression of MT1-MMP expressing (+) and suppressed (−) clones. There was an approximate three-fold reduction in Smad1 expression in the MT1-MMP suppressed cells (*, P < 0.05, n=4).
One of the genes, Smad1, was further examined for its role in MT1-MMP dependent tumor growth because previous evidence implicated its role in enhancing tumor growth.14,26 Microarray was used to confirm that only Smad1 expression, which showed a 3.39 fold change (P = 0.01) and not the expression of other Smad family members (P > 0.05), was significantly altered (Fig. 3b). This approximate three-fold change in expression was further confirmed by real-time RT-PCR of the HT1080 clones (Fig. 3c, left panel, P < 0.05, n=4) and western blot (Fig. 3c, right panel). To verify that Smad1 expression coincides with MT1-MMP in other tumor cell lines, the mRNA of HT1080 fibrosarcoma, PC3 prostate, SW620 colorectal, SKOV3 ovarian, and MDA231 breast tumor cell lines were examined and Smad1 was found to be highly expressed in all five MT1-MMP expressing cell lines (Fig. 4a). When MT1-MMP was suppressed by RNAi in two of these cell lines, PC3 and MDA231 cells, Smad1 was also reduced (Fig. 4b); Smad1 expression was re-established in cells engineered to re-express MT1-MMP (RES). Finally, the expression of MT1-MMP and Smad1 was greater in many tumors from distinct origins relative to their respective normal tissues according to gene expression data derived from NCBI’s Gene Expression Omnibus (GEO) Profiles Database (data not shown). These data suggest the linkage between MT1-MMP and Smad1 in many types of tumor cells and its clinical relevance.
FIGURE 4.
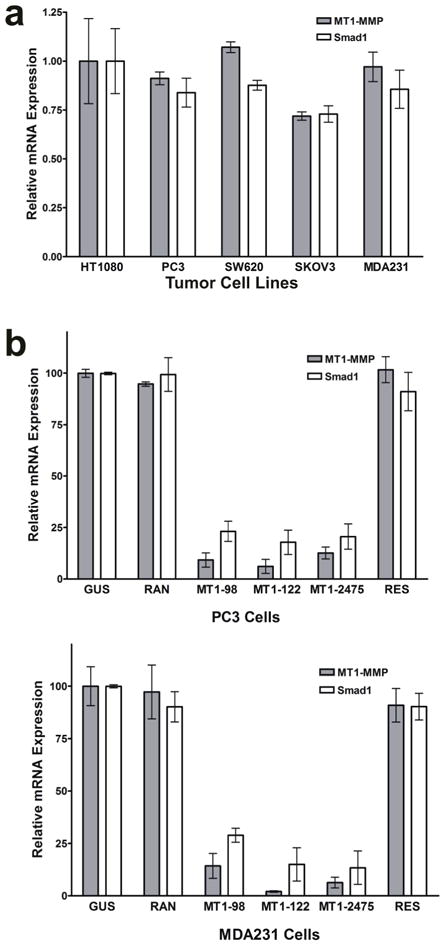
Expression of MT1-MMP and Smad1 in other tumor cell lines. Real-time RT-PCR quantifying the relative MT1-MMP and Smad1 mRNA expression levels in several tumor cell lines (a) and in MT1-MMP-suppressed and -rescued PC3 and MDA231 cells (b).
The effect of Smad1 expression on tumor growth
To determine whether RNAi suppression of Smad1 had an effect on tumor growth, three DNA oligonucleotides encoding different shRNAs targeting three separate areas of the Smad1 mRNA were designed (Fig. 5a). There were two mRNA variants of Smad1 found in GenBank (gi:51173725 and gi:51173726) differing only at the 5’-end of the mRNAs (indicated by horizontal lines in Fig. 5a). The rest of the mRNA (grey boxes) had 100% homology; therefore, the shRNAs designed to target the indicated regions targeted both variants. These DNA oligonucleotides were inserted downstream of the U6 promoter in pGUS, transfected in HT1080 cells, and two clones were selected for each shRNA that showed the best suppression, approximately 75%, of Smad1 mRNA (Fig. 5b) according to real-time RT-PCR data (*, P < 0.05; **, P < 0.01, n=3). The clones were also examined by western blot analysis to confirm that Smad1 protein was suppressed as well (Fig. 5c). The clones were injected s.c. into nude mice and the resulting tumors were measured every two days for 24 days. Fig. 5d depicts the average tumor volumes of Smad1 expressing clones (GUS-1, GUS-2, RAN-1, and RAN-2) compared to Smad1 suppressed clones (SMAD-394-1, SMAD-394-2, SMAD-1868-1, SMAD-1868-2, SMAD-2651-1 and SMAD-2651-2) on day 24 post injection. There was a two-fold reduction in tumor volume when these two groups were compared (P < 0.01, n=20). Our data suggests that Smad1 promotes tumor growth.
FIGURE 5.
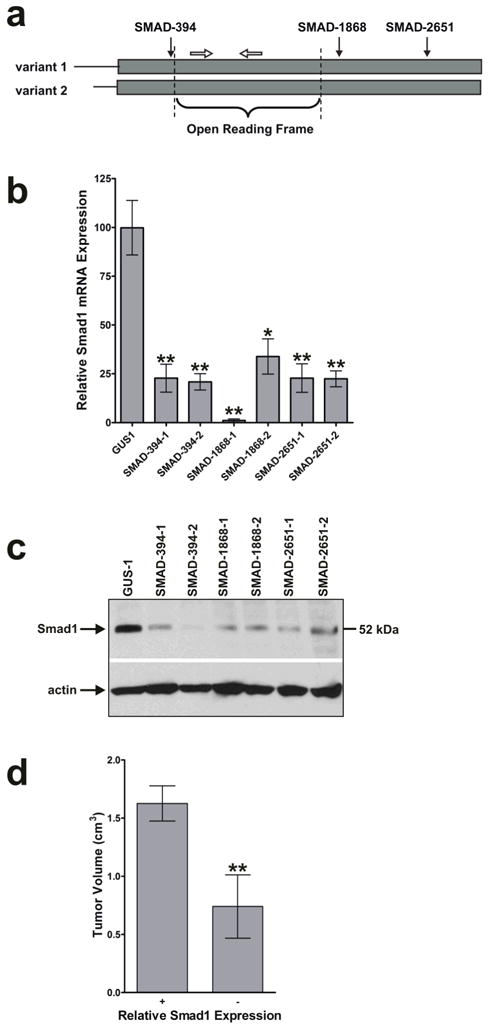
Smad1 enhances tumor growth. (a) Schematic representation of the RNAi target sites in the Smad1 mRNA. There is 100% homology between the two Smad1 variants in the boxed region representing the Smad1 mRNA. The solid arrows indicate the relative target locations of the Smad1 specific shRNAs encoded by pGUS. The open arrows represent real-time PCR primers used to amplify a region of the Smad1 mRNA within the open reading frame. Diagram is not to scale. (b) Quantification of Smad1 mRNA expression of HT1080 cells transfected with Smad1 RNAi vectors. Six clones representing three different shRNAs as mentioned in (a) were selected that had a 75–99% reduction in the amount of Smad1 mRNA as measured by real-time RT-PCR (*, P < 0.05; **, P < 0.01, n=3). (c) Western analysis using an anti-Smad1 antibody. Smad1 suppression occurred at the protein level in HT1080 cells with RNAi knockdown. (d) Growth of tumors derived from Smad1 RNAi clones. Smad1 suppressed clones were injected s.c. into nude mice and the resulting tumors were measured. The values shown were the average tumor volumes 24 days post injection. There was a two-fold reduction in growth of tumors derived from Smad1 suppressed cells relative to those derived from Smad1 expressing cells (**, P < 0.01, n=20).
Identification that TGF-β can induce Smad1 mRNA expression
To determine if the MT1-MMP-mediated induction of Smad1 expression involved an MT1-MMP-generated extracellular signal, a clone with a low expression level of both MT1-MMP and Smad1, MT1-2475-2, was cultured in media conditioned by a highly expressing MT1-MMP clone, GUS-2, for 0, 24, and 72 hours. Smad1 mRNA and protein levels (Fig. 6a) revealed that the media conditioned by a MT1-MMP expressing clone was sufficient to induce Smad1 expression in MT1-MMP suppressed cells (P < 0.001, n=3). To identify the extracellular factor responsible for this induction, we tested several serum-derived growth factors for their ability to induce Smad1 expression. MT1-MMP expressing GUS-2 cells were incubated with DMEM alone or with individual growth factors for 24 hours. These media were then used to culture MT1-2475-2 cells for 24 hours and cellular levels of Smad1 mRNA and protein were determined. Figure 6b indicates that TGF-β was able to induce Smad1 (*, P < 0.05, n=3), yet PDGF, FGF, EGF, and BMP-2 were not (ns, P > 0.05, n=3).
FIGURE 6.
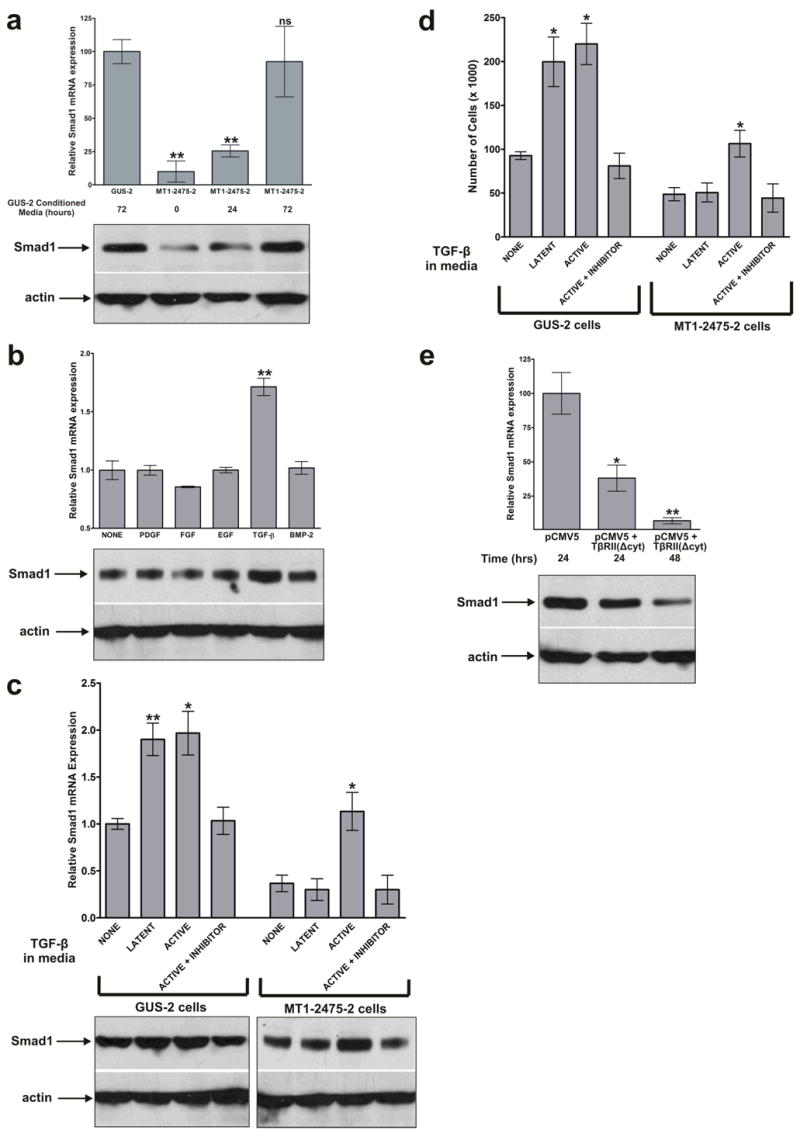
TGF-β signaling induces Smad1 expression. (a) Real-time RT-PCR and western blot analysis indicating the relative Smad1 mRNA and protein expression of cells cultured in media conditioned by MT1-MMP expressing cells. The MT1-2475-2 clone, which has a low level of MT1-MMP and Smad1 expression (**, P < 0.01, n=3), was cultured with media conditioned by MT1-MMP expressing GUS-2 cells for 0, 24, and 72 hours. By 72 hours, Smad1 mRNA expression was induced to the level found in MT1-MMP expressing cells (ns, P > 0.05, n=3). (b) The relative Smad1 mRNA and protein expression of cells cultured with various growth factors. DMEM alone or with the indicated growth factor was cultured with MT1-MMP expressing GUS-2 cells for 24 hours. Subsequently, the media was used to culture the MT1-2475-2 cells for 24 hours and RNA was isolated for real-time RT-PCR and cell lysates for western blot analysis. TGF-β was the only growth factor that significantly induced Smad1 (**, P < 0.01, n=3). (c) The relative Smad1 mRNA and protein expression in MT1-MMP expressing and suppressed cells following incubation with latent and activated forms of TGF-β. GUS-2 and MT1-2475-2 cells were cultured with DMEM alone, latent TGF-β, and active TGF-β for 24 hours. RNA and cell lysates were collected from each of the clones to examine the Smad1 expression via real-time RT-PCR and western blot analysis, respectively. Both latent and active forms of TGF-β were able to induce Smad1 in MT1-MMP expressing GUS-2 cells; however, only active TGF-β was able to induce Smad1 in MT1-MMP suppressed MT1-2475-2 cells (*, P < 0.05, n=3). Smad1 was not induced in the presence of a TGF-β inhibitor. (d) Proliferation of GUS-2 and MT1-2475-2 clones within 3D matrigel in the presence of latent and active forms of TGF-β. Equal number of cells for each condition (5 x 10⁴) were seeded within Growth Factor Reduced BD Matrigel™ Matrix on day 0 and and counted on day 10. There was an approximate two-fold induction in cell number when GUS-2 cells were incubated with either latent or active TGF-β and when MT1-2475 cells were incubated with active TGF-β (*, P < 0.05, n=4). (e) The relative Smad1 mRNA and protein expression of cells transfected with a dominant-negative form of TGF-β type II receptor. MT1-MMP expressing GUS-2 cells were transfected with the dominant-negative receptor or an empty vector control, RNA for real-time RT-PCR and cell lysates for western blot analysis were collected 24 and 48 hours later. Cells transfected with the dominant-negative receptor had a significant reduction in the quantity of Smad1 expressed (*, P < 0.05; **, P < 0.01, n=3). (e)
Next, we examined whether latent or active TGF-β could induce Smad1 expression. When MT1-MMP expressing cells were grown in media supplemented with latent or active TGF-β, Smad1 was induced relative to cells grown in DMEM alone or in the presence of a TGF-β inhibitor (Fig 6c; *, P < 0.05; **, P < 0.01, n=3). Active TGF-β was able to induce Smad1 in MT1-MMP suppressed MT1-2475-2 cells, but the latent form was not, suggesting MT1-MMP-dependent activation of TGF-β was required for Smad1 induction (Fig 6c, *, P < 0.05, n=3). A 3D cell proliferation assay was performed to determine whether TGF-β had an effect on HT1080 cell proliferation. On day 10 the number of MT1-MMP expressing GUS-2 cells grown in the presence of latent and active TGF-β were two-fold higher than those grown with in the presence of minimal TGF-β or an inhibitor (Fig. 6d, P < 0.05, n=4). MT1-MMP suppressed MT1-2475-2 cells grew more slowly within 3D Growth Factor Reduced BD Matrigel™ Matrix than the MT1-MMP expressing cells as expected, and the latent form of TGF-β did not affect proliferation whereas the active form increased it (Fig. 6d, P < 0.05, n=4).
Lastly, MT1-MMP expressing GUS-2 cells were transfected with a vector containing a dominant-negative form of the TGF-β type II receptor lacking a cytoplasmic domain or an empty vector control. Real-time RT-PCR of RNA isolated 24 and 48 hours post-transfection revealed that expression of this dominant-negative receptor reduced Smad1 expression in MT1-MMP expressing cells (Fig. 6e), providing further evidence that Smad1 expression is regulated by TGF-β (*, P < 0.05; **, P < 0.01).
Discussion
A number of studies have shown that MT1-MMP expression promotes tumor growth. In this report, we further characterized this concept by using RNAi to stably suppress endogenous MT1-MMP expression and activity in human tumor cells to identify a functional linkage between MT1-MMP and a signaling pathway that regulates tumor growth. This approach enabled us to discover that endogenous tumor cell-derived MT1-MMP may promote tumor growth by inducing Smad1 via TGF-β signaling.
Previous studies have shown that proliferation of cells with endogenously expressed MT1-MMP can be reduced in the presence of a natural inhibitor of MT1-MMP, TIMP-2, within 3D collagen type I and 3D fibrin, with no difference in proliferation in 2D culture.4 Likewise, we found impaired proliferation of cells within Growth Factor Reduced BD Matrigel™ Matrix in 3D culture, but not in 2D culture. This is also in agreement with a previous study that showed when melanoma cells are engineered to over-express MT1-MMP there is enhanced 3D growth in agarose and in long-term cultures within matrigel.27 Hotary KB and Weiss SJ,4 describe MT1-MMP as a novel tumor-derived growth factor that promotes proliferation within the confines of the 3D microenvironment. Our work advanced the understanding of the molecular mechanism regarding how endogenous MT1-MMP functions to enhance tumor growth by identifying two direct downstream effectors of tumor growth, namely TGF-β and Smad1.
We have presented several lines of evidence that MT1-MMP induces Smad1 expression to enhance tumor growth. Notably, it was only the expression of Smad1, and not the other members of the Smad family, that was altered. In addition, Smad1 was highly expressed in all of the MT1-MMP expressing tumor cell lines and clinical tumor samples examined. Moreover, when MT1-MMP was suppressed by RNAi in three different cell lines, Smad1 was significantly reduced. In our study, suppression of Smad1 by RNAi had a two-fold reduction in tumor growth, partially recapitulating the effect of MT1-MMP suppression. There are several explanations why this is less than the approximate five-fold effect MT1-MMP had on tumor growth. First, the Smad1 shRNAs suppressed Smad1 expression by 75%, whereas the MT1-MMP shRNAs suppressed MT1-MMP over 90%. Additionally, MT1-MMP has a variety of functions including, but not limited to: degradation of the ECM, cleavage of adhesion molecules, release of sequestered growth factors and cytokines, induction of intracellular signaling pathways, and through these activities, regulates the expression of many genes besides Smad1. Our microarray analysis identified several genes that may collectively regulate tumor growth including: CD928, ErbB329, activated leucocyte cell adhesion molecule (ALCAM)30–32, and metallothionein 2A, 1H, 1L, 1X33. Although the expression of many genes were altered by MT1-MMP suppression, we have shown that Smad1, by itself, has a substantial effect on tumor growth, but less than the collective effect of suppressing all the genes simultaneously. Overall, our data supports that MT1-MMP functions, in part, to enhance tumor growth by inducing Smad1.
We also showed that active TGF-β was sufficient to induce Smad1 expression. TGF-β, which exists mainly in a latent state, binds to avβ8 integrin in vitro and in vivo through its integrin binding motif (RGD) and is subsequently activated and released by MT1-MMP, thus resulting in autocrine and paracrine effects on cell growth and matrix production34,35. In our study, neither serum-containing media, which likely contains latent TGF-β, nor commercially available latent TGF-β were able to induce Smad1 expression or 3D cell proliferation of MT1-MMP suppressed cells; however, media containing active TGF-β or latent TGF-β exposed to MT1-MMP did induce Smad1 and 3D cell proliferation. In addition, other growth factors such as PDGF, FGF, EGF, and BMP-2 were not able to significantly enhance Smad1 expression. Furthermore, expression of a dominant-negative form of TGF-β type II receptor significantly reduced Smad1 in MT1-MMP expressing cells. Our data suggest that it was the extracellular proteolytic function of MT1-MMP that created a biologically active TGF-β molecule that activated a downstream signaling pathway, and, thus, upregulated Smad1. Although Smad1 activity is classically mediated by BMPs, it is also regulated by TGF-β in tumors.11 To our knowledge the Smad1 promoter has not yet been studied extensively and it is not known what activators and repressors regulate its transcription nor what pathway induces its expression. This paper establishes that MT1-MMP-activated TGF-β can induce transcription and expression of Smad1. This induction of Smad1 expression by MT1-MMP and TGF-β is a novel finding.
The relationship among MT1-MMP, TGF-β, Smad1, and tumor growth is not clearly understood. Most likely the cell surface receptor β8 integrin docks or binds latent TGF-β while a nearby cell surface bound MT1-MMP cleaves it into its activated form.35 Alternatively, the activation of latent TGF-β may not require docking at the cell surface. Activated TGF-β is then released and available to activate autocrine and/or paracrine TGF-β receptors. Activated TGF-β type I and II receptors most likely induce signaling involving members of the Smad family, although the specific Smads involved have not yet been confirmed. Once Smad1 protein is expressed in the cytoplasm, it can be activated via phosphorylation by a number of upstream pathways involving BMP-2, TGF-β, and/or Ras/MEK.10,15,16,36,37 Phosphorylated Smad1 can then associate with Smad4 and possibly additional Smad family members and translocate into the nucleus. It is here where the Smad protein complex can act as a co-activator for many tumor growth promoting genes such as collagen IV 17, myc 18, p21WAF1/Cip1 19, or potentially MMPs 38. Smad1 may be expected to inhibit tumor growth as in the case with the cell cycle inhibitor p21; however, Smad1 induces p21 mRNA and protein levels, but fails to induce epithelial growth inhibition.39 The ability of Smad1 to induce cell proliferation or cell growth arrest depends on the regulation of additional gene targets. Our data suggests that MT1-MMP (as indicated in Figure 2b and c), TGF-β (Figure 6d), and Smad1 (Figure 5d) all promote cell proliferation in 3D and/or tumor growth.
Identification of the underlying mechanism by which MT1-MMP, TGF-β, and Smad1 influence signaling and tumor growth may provide a better understanding of their biological role in malignant tissues. Because MT1-MMP is induced on tumor and tumor-derived stromal cells, but sparsely expressed in normal adult tissue, it is conceivable that MT1-MMP and its signaling pathway may serve as effective therapeutic targets.40 Clinical trials of MMP inhibitors in the past may have failed for several reasons, i.e. they targeted the general class of MMPs and they were given to patients with late stage malignancies; therefore, no clinical efficacy was demonstrated.41–44 However, MT1-MMP is such a potent protease with myriad downstream targets that are critical during tumor progression; hence, inhibiting MT1-MMP or its downstream tumor-promoting pathways may provide specificity for cancer. It is evident that further investigation of MT1-MMP and its tumor-promoting pathways should be pursued.
Acknowledgments
Grant support: National Institutes of Health grants R01CA0039077 and R01EB002065 (to WTC).
We thank Howard Crawford and Alanna Kennedy for critical reading of the manuscript. We would also like to thank Wei Zeng for demonstrating how to use the Gene Spring software and mouse handling methods, Donghai Chen for his advice regarding molecular biology techniques, Carlo Bergamini for assisting to construct the RNAi vector, and Shaun Tulley for helpful discussions. We are grateful to Jian Cao (Stony Brook University, Stony Brook, NY) for providing us the MT1-MMP cDNA, Gregory Hannon (Cold Spring Harbor Laboratory, Cold Spring Harbor, NY) for his pGEM/U6 vector which supplied us the U6 promoter we used in our RNAi vector, and Joan Massague (Memorial Sloan-Kettering Cancer Center, New York, NY) for his pCMV5 and pCMV5+TβRII (cyt) constructs.
The abbreviations used are
- MT1-MMP
membrane type 1 matrix metalloproteinase
- ECM
extracellular matrix
- BMP
bone morphogenetic protein
- TGF
transforming growth factor
- RNAi
RNA interference
- shRNA
short hairpin RNA
- GFP
green fluorescent protein
- MMP
matrix metalloproteinase
- ADAM
a disintegrin and metalloproteinase
- 2D
two-dimensional
- 3D
three-dimensional
- PDGF
platelet-derived growth factor
- FGF
fibroblast growth factor
- EGF
epidermal growth factor
Footnotes
Statement of novelty and impact – Our work advanced the understanding of the molecular mechanism regarding how the endogenous cell surface protease MT1-MMP functions to enhance tumor growth. Specifically, we showed that MT1-MMP promoted tumor growth by enhancing the expression of Smad1 via TGF-β signaling.
References
- 1.Nonaka T, Nishibashi K, Itoh Y, Yana I, Seiki M. Competitive disruption of the tumor-promoting function of membrane type 1 matrix metalloproteinase/matrix metalloproteinase-14 in vivo. Mol Cancer Ther. 2005;4:1157–66. doi: 10.1158/1535-7163.MCT-05-0127. [DOI] [PubMed] [Google Scholar]
- 2.Sounni NE, Baramova EN, Munaut C, Maquoi E, Frankenne F, Foidart JM, Noel A. Expression of membrane type 1 matrix metalloproteinase (MT1-MMP) in A2058 melanoma cells is associated with MMP-2 activation and increased tumor growth and vascularization. Int J Cancer. 2002;98:23–8. doi: 10.1002/ijc.10134. [DOI] [PubMed] [Google Scholar]
- 3.Soulie P, Carrozzino F, Pepper MS, Strongin AY, Poupon MF, Montesano R. Membrane-type-1 matrix metalloproteinase confers tumorigenicity on nonmalignant epithelial cells. Oncogene. 2005;24:1689–97. doi: 10.1038/sj.onc.1208360. [DOI] [PubMed] [Google Scholar]
- 4.Hotary KB, Allen ED, Brooks PC, Datta NS, Long MW, Weiss SJ. Membrane type I matrix metalloproteinase usurps tumor growth control imposed by the three-dimensional extracellular matrix. Cell. 2003;114:33–45. doi: 10.1016/s0092-8674(03)00513-0. [DOI] [PubMed] [Google Scholar]
- 5.Chang HL, Gillett N, Figari I, Lopez AR, Palladino MA, Derynck R. Increased transforming growth factor beta expression inhibits cell proliferation in vitro, yet increases tumorigenicity and tumor growth of Meth A sarcoma cells. Cancer Res. 1993;53:4391–8. [PubMed] [Google Scholar]
- 6.Popik W, Inglot AD. Interactions of interferons and transforming growth factors during clonal growth of mouse or human cells in soft agar and in mice. Int J Cancer. 1987;40:108–13. doi: 10.1002/ijc.2910400120. [DOI] [PubMed] [Google Scholar]
- 7.Tobin SW, Douville K, Benbow U, Brinckerhoff CE, Memoli VA, Arrick BA. Consequences of altered TGF-beta expression and responsiveness in breast cancer: evidence for autocrine and paracrine effects. Oncogene. 2002;21:108–18. doi: 10.1038/sj.onc.1205026. [DOI] [PubMed] [Google Scholar]
- 8.Langenfeld EM, Calvano SE, bou-Nukta F, Lowry SF, Amenta P, Langenfeld J. The mature bone morphogenetic protein-2 is aberrantly expressed in non-small cell lung carcinomas and stimulates tumor growth of A549 cells. Carcinogenesis. 2003;24:1445–54. doi: 10.1093/carcin/bgg100. [DOI] [PubMed] [Google Scholar]
- 9.Helms MW, Packeisen J, August C, Schittek B, Boecker W, Brandt BH, Buerger H. First evidence supporting a potential role for the BMP/SMAD pathway in the progression of oestrogen receptor-positive breast cancer. J Pathol. 2005;206:366–76. doi: 10.1002/path.1785. [DOI] [PubMed] [Google Scholar]
- 10.Liu X, Yue J, Frey RS, Zhu Q, Mulder KM. Transforming growth factor beta signaling through Smad1 in human breast cancer cells. Cancer Res. 1998;58:4752–7. [PubMed] [Google Scholar]
- 11.Munoz O, Fend F, de BR, Husson H, Astier A, Freedman AS. TGFbeta-mediated activation of Smad1 in B-cell non-Hodgkin’s lymphoma and effect on cell proliferation. Leukemia. 2004;18:2015–25. doi: 10.1038/sj.leu.2403485. [DOI] [PubMed] [Google Scholar]
- 12.Pouliot F, Blais A, Labrie C. Overexpression of a dominant negative type II bone morphogenetic protein receptor inhibits the growth of human breast cancer cells. Cancer Res. 2003;63:277–81. [PubMed] [Google Scholar]
- 13.Korchynskyi O, Landstrom M, Stoika R, Funa K, Heldin CH, Ten DP, Souchelnytskyi S. Expression of Smad proteins in human colorectal cancer. Int J Cancer. 1999;82:197–202. doi: 10.1002/(sici)1097-0215(19990719)82:2<197::aid-ijc8>3.0.co;2-v. [DOI] [PubMed] [Google Scholar]
- 14.Langenfeld EM, Kong Y, Langenfeld J. Bone morphogenetic protein 2 stimulation of tumor growth involves the activation of Smad-1/5. Oncogene. 2006;25:685–92. doi: 10.1038/sj.onc.1209110. [DOI] [PubMed] [Google Scholar]
- 15.Kretzschmar M, Doody J, Massague J. Opposing BMP and EGF signalling pathways converge on the TGF-beta family mediator Smad1. Nature. 1997;389:618–22. doi: 10.1038/39348. [DOI] [PubMed] [Google Scholar]
- 16.Yue J, Frey RS, Mulder KM. Cross-talk between the Smad1 and Ras/MEK signaling pathways for TGFbeta. Oncogene. 1999;18:2033–7. doi: 10.1038/sj.onc.1202521. [DOI] [PubMed] [Google Scholar]
- 17.Abe H, Matsubara T, Iehara N, Nagai K, Takahashi T, Arai H, Kita T, Doi T. Type IV Collagen Is Transcriptionally Regulated by Smad1 under Advanced Glycation End Product (AGE) Stimulation. J Biol Chem. 2004;279:14201–6. doi: 10.1074/jbc.M310427200. [DOI] [PubMed] [Google Scholar]
- 18.Hu MC, Rosenblum ND. Smad1, {beta}-catenin and Tcf4 associate in a molecular complex with the Myc promoter in dysplastic renal tissue and cooperate to control Myc transcription. Development. 2005;132:215–25. doi: 10.1242/dev.01573. [DOI] [PubMed] [Google Scholar]
- 19.Pouliot F, Labrie C. Role of Smad1 and Smad4 proteins in the induction of p21WAF1,Cip1 during bone morphogenetic protein-induced growth arrest in human breast cancer cells. J Endocrinol. 2002;172:187–98. doi: 10.1677/joe.0.1720187. [DOI] [PubMed] [Google Scholar]
- 20.Ng KW, Leong DT, Hutmacher DW. The challenge to measure cell proliferation in two and three dimensions. Tissue Eng. 2005;11:182–91. doi: 10.1089/ten.2005.11.182. [DOI] [PubMed] [Google Scholar]
- 21.Paddison PJ, Caudy AA, Bernstein E, Hannon GJ, Conklin DS. Short hairpin RNAs (shRNAs) induce sequence-specific silencing in mammalian cells. Genes Dev. 2002;16:948–58. doi: 10.1101/gad.981002. [DOI] [PMC free article] [PubMed] [Google Scholar]
- 22.Bridge AJ, Pebernard S, Ducraux A, Nicoulaz AL, Iggo R. Induction of an interferon response by RNAi vectors in mammalian cells. Nat Genet. 2003;34:263–4. doi: 10.1038/ng1173. [DOI] [PubMed] [Google Scholar]
- 23.LeBedis C, Chen K, Fallavollita L, Boutros T, Brodt P. Peripheral lymph node stromal cells can promote growth and tumorigenicity of breast carcinoma cells through the release of IGF-I and EGF. Int J Cancer. 2002;100:2–8. doi: 10.1002/ijc.10481. [DOI] [PubMed] [Google Scholar]
- 24.Rutka JT, Giblin JR, Apodaca G, DeArmond SJ, Stern R, Rosenblum ML. Inhibition of growth and induction of differentiation in a malignant human glioma cell line by normal leptomeningeal extracellular matrix proteins. Cancer Res. 1987;47:3515–22. [PubMed] [Google Scholar]
- 25.Meck RA, Ingram M, Meck JM, McCullough JL, Wu MC, Yunis AA. Establishment and cell cycle kinetics of a human squamous cell carcinoma in nude mice and in vitro. Cancer Res. 1981;41:1076–85. [PubMed] [Google Scholar]
- 26.Paez-Pereda M, Giacomini D, Refojo D, Nagashima AC, Hopfner U, Grubler Y, Chervin A, Goldberg V, Goya R, Hentges ST, Low MJ, Holsboer F, et al. Involvement of bone morphogenetic protein 4 (BMP-4) in pituitary prolactinoma pathogenesis through a Smad/estrogen receptor crosstalk. Proc Natl Acad Sci U S A. 2003;100:1034–9. doi: 10.1073/pnas.0237312100. [DOI] [PMC free article] [PubMed] [Google Scholar]
- 27.Iida J, Wilhelmson KL, Price MA, Wilson CM, Pei D, Furcht LT, McCarthy JB. Membrane type-1 matrix metalloproteinase promotes human melanoma invasion and growth. J Invest Dermatol. 2004;122:167–76. doi: 10.1046/j.0022-202X.2003.22114.x. [DOI] [PubMed] [Google Scholar]
- 28.Zheng R, Yano S, Zhang H, Nakataki E, Tachibana I, Kawase I, Hayashi S, Sone S. CD9 overexpression suppressed the liver metastasis and malignant ascites via inhibition of proliferation and motility of small-cell lung cancer cells in NK cell-depleted SCID mice. Oncol Res. 2005;15:365–72. doi: 10.3727/096504005776449699. [DOI] [PubMed] [Google Scholar]
- 29.Gullick WJ. The c-erbB3/HER3 receptor in human cancer. Cancer Surv. 1996;27:339–49. 339–49. [PubMed] [Google Scholar]
- 30.King JA, Ofori-Acquah SF, Stevens T, Al-Mehdi AB, Fodstad O, Jiang WG. Activated leukocyte cell adhesion molecule in breast cancer: prognostic indicator. Breast Cancer Res. 2004;6:R478–R487. doi: 10.1186/bcr815. [DOI] [PMC free article] [PubMed] [Google Scholar]
- 31.Lunter PC, van Kilsdonk JW, van BH, Cornelissen IM, Bergers M, Willems PH, van Muijen GN, Swart GW. Activated leukocyte cell adhesion molecule (ALCAM/CD166/MEMD), a novel actor in invasive growth, controls matrix metalloproteinase activity. Cancer Res. 2005;65:8801–8. doi: 10.1158/0008-5472.CAN-05-0378. [DOI] [PubMed] [Google Scholar]
- 32.Burkhardt M, Mayordomo E, Winzer KJ, Fritzsche F, Gansukh T, Pahl S, Weichert W, Denkert C, Guski H, Dietel M, Kristiansen G. Cytoplasmic overexpression of ALCAM is prognostic of disease progression in breast cancer. J Clin Pathol. 2006;59:403–9. doi: 10.1136/jcp.2005.028209. [DOI] [PMC free article] [PubMed] [Google Scholar]
- 33.Theocharis SE, Margeli AP, Klijanienko JT, Kouraklis GP. Metallothionein expression in human neoplasia. Histopathology. 2004;45:103–18. doi: 10.1111/j.1365-2559.2004.01922.x. [DOI] [PubMed] [Google Scholar]
- 34.Karsdal MA, Larsen L, Engsig MT, Lou H, Ferreras M, Lochter A, Delaisse JM, Foged NT. Matrix metalloproteinase-dependent activation of latent transforming growth factor-beta controls the conversion of osteoblasts into osteocytes by blocking osteoblast apoptosis. J Biol Chem. 2002;277:44061–7. doi: 10.1074/jbc.M207205200. [DOI] [PubMed] [Google Scholar]
- 35.Mu D, Cambier S, Fjellbirkeland L, Baron JL, Munger JS, Kawakatsu H, Sheppard D, Broaddus VC, Nishimura SL. The integrin {alpha}v{beta}8 mediates epithelial homeostasis through MT1-MMP-dependent activation of TGF-{beta}1. J Cell Biol. 2002;157:493–507. doi: 10.1083/jcb.200109100. [DOI] [PMC free article] [PubMed] [Google Scholar]
- 36.Yue J, Hartsough MT, Frey RS, Frielle T, Mulder KM. Cloning and expression of a rat Smad1: regulation by TGFbeta and modulation by the Ras/MEK pathway. J Cell Physiol. 1999;178:387–96. doi: 10.1002/(SICI)1097-4652(199903)178:3<387::AID-JCP13>3.0.CO;2-8. [DOI] [PubMed] [Google Scholar]
- 37.Candia AF, Watabe T, Hawley SH, Onichtchouk D, Zhang Y, Derynck R, Niehrs C, Cho KW. Cellular interpretation of multiple TGF-beta signals: intracellular antagonism between activin/BVg1 and BMP-2/4 signaling mediated by Smads. Development. 1997;124:4467–80. doi: 10.1242/dev.124.22.4467. [DOI] [PubMed] [Google Scholar]
- 38.Leivonen SK, Ala-aho R, Koli K, Grenman R, Peltonen J, Kahari VM. Activation of Smad signaling enhances collagenase-3 (MMP-13) expression and invasion of head and neck squamous carcinoma cells. Oncogene. 2006 doi: 10.1038/sj.onc.1209291. [DOI] [PubMed] [Google Scholar]
- 39.Pardali K, Kowanetz M, Heldin CH, Moustakas A. Smad pathway-specific transcriptional regulation of the cell cycle inhibitor p21(WAF1/Cip1) J Cell Physiol. 2005;204:260–72. doi: 10.1002/jcp.20304. [DOI] [PubMed] [Google Scholar]
- 40.Okada A, Tomasetto C, Lutz Y, Bellocq JP, Rio MC, Basset P. Expression of matrix metalloproteinases during rat skin wound healing: evidence that membrane type-1 matrix metalloproteinase is a stromal activator of pro-gelatinase A. J Cell Biol. 1997;137:67–77. doi: 10.1083/jcb.137.1.67. [DOI] [PMC free article] [PubMed] [Google Scholar]
- 41.Overall CM, Kleifeld O. Tumour microenvironment - opinion: validating matrix metalloproteinases as drug targets and anti-targets for cancer therapy. Nat Rev Cancer. 2006;6:227–39. doi: 10.1038/nrc1821. [DOI] [PubMed] [Google Scholar]
- 42.Vihinen P, la-aho R, Kahari VM. Matrix metalloproteinases as therapeutic targets in cancer. Curr Cancer Drug Targets. 2005;5:203–20. doi: 10.2174/1568009053765799. [DOI] [PubMed] [Google Scholar]
- 43.Mannello F, Tonti G, Papa S. Matrix metalloproteinase inhibitors as anticancer therapeutics. Curr Cancer Drug Targets. 2005;5:285–98. doi: 10.2174/1568009054064615. [DOI] [PubMed] [Google Scholar]
- 44.Mandal M, Mandal A, Das S, Chakraborti T, Sajal C. Clinical implications of matrix metalloproteinases. Mol Cell Biochem. 2003;252:305–29. doi: 10.1023/a:1025526424637. [DOI] [PubMed] [Google Scholar]