

Abstract
Peroxisome proliferator-activated receptor α (PPARα) is a nuclear receptor with manifold effects on intermediary metabolism. To define a set of urinary biomarkers that could be employed to determine the efficacy of PPARα agonists, a metabolomic investigation was undertaken in wild-type and Pparα-null mice fed for 2 weeks either a regular diet or a diet containing the PPARα ligand Wy-14,643 and their urine analyzed by ultra-performance liquid chromatography coupled with time of flight mass spectrometry. Principal components analysis of 6393 accurate mass positive ions revealed clustering as a single phenotype of the treated and untreated Pparα (−/−) mice plus two further discrete phenotypes for the treated and untreated Pparα (+/+) mice. Biomarkers of PPARα activation were identified from their accurate masses and confirmed by tandem mass spectrometry of authentic compounds. Biomarkers were quantitated from raw chromatographic data using appropriate calibration curves. PPARα urinary biomarkers highly statistically significantly elevated by Wy-14,643 treatment included 11β-hydroxy-3,20-dioxopregn-4-en-21-oic acid (>3,700-fold), 11β,20-dihydroxy-3-oxopregn-4-en-21-oic acid (50-fold), nicotinamide (>2-fold), nicotinamide 1-oxide (5-fold), 1-methylnicotinamide (1.5-fold), hippuric acid (2-fold), and 2,8-dihydroxyquinoline-β-D-glucuronide (3-fold). PPARα urinary biomarkers highly statistically significantly attenuated by Wy-14,643 treatment included xanthurenic acid (1.3-fold), hexanoylglycine (20-fold), phenylpropionylglycine (4-fold), and cinnamoylglycine (9-fold). These biomarkers arise from PPARα effects on tryptophan, corticosterone and fatty acid metabolism and on glucuronidation. This study underscores the power of mass spectrometry-based metabolomics combined with genetically-modified mice in the definition of monogenic metabolic phenotypes.
Keywords: peroxisome proliferator-activated receptor α, metabolomics, Wy-14, 643, Pparα-null mice, tryptophan-nicotinamide pathway
INTRODUCTION
Peroxisome proliferator-activated receptor α (PPARα) belongs to the nuclear receptor superfamily. After binding to its ligands, PPARα forms a heterodimer with the retinoic X receptor (RXR) which then disengages co-repressors and/or recruits co-activators and binds to specific direct repeat 1 (DR1) type DNA elements, called peroxisome proliferator response elements (PPRE), in the promoter regions of target genes involved in lipid, glucose and amino acid homeostasis (1, 2). In rodent models, long-term treatment with PPARα ligands results in hepatocellular carcinomas (3, 4) while this phenomenon is absent in Pparα-null mice (5). It is of great interest to understand the mechanism PPARα-induced liver toxicity and carcinogenesis.
A more global approach to study PPARα and other nuclear receptors could rely on extensive analysis of the pool of small organic molecules or metabolites that are present in a biological medium, also called the “metabolome” (6). Metabolomics, also called metabonomics, is defined as the quantitative measurement of the dynamic multi-parametric metabolic response of living system to pathophysiological stimuli or genetic modification (7), have been mostly performed using methodology centered on high field NMR spectroscopy with data analyzed by multivariate data analysis (MDA) methods such as principal components analysis (PCA) (8–10). Recent advances in mass spectrometric techniques, especially when linked to the newly introduced very high-resolution ultra-performance liquid chromatography, have resulted in the development of robust methods for low molecular mass organic molecules in complex biological matrices that can also be combined with MDA to yield sets of accurate mass ions, by electrospray in both positive and negative ion modes (ES+ and ES−, respectively), that describe the differences between two or more groups of samples (11). The application of PCA to urinary metabolite profiles provides an unbiased evaluation of the metabolites that characterize the difference in urine composition between two groups of animals, for example, male versus female mice, or different strains of mice (11). Contemporary mass spectrometry methods, such as ultra-performance chromatography-coupled time-of-flight mass spectrometry (UPLC-TOFMS) are able to detect approximately 5,000 ion-retention time pairs in a single urine sample (12). PCA is able to define metabolic phenotypes and also identify which of the urinary ion-retention time pairs contributes most to the separation between two phenotypes. Because the ions are acquired by the TOFMS with a mass accuracy of typically <5 ppm, it is generally possible to deduce the empirical formulae of candidate metabolites. Authentic standards, acquired by either purchase or chemical synthesis are then used to confirm the urinary metabolites that contribute to a particular phenotype.
Metabolites produced by any of the target gene products of PPARα are theoretical biomarkers for PPARα activation. One candidate metabolic set arises from the tryptophan-niacin pathway that is upregulated by PPARα ligands (13). A study employing NMR-based metabolomics has reported elevated urinary excretion of 1-methylnicotinamide and 1-methyl-4-pyridone-3-carboxamide after exposure of rats to PPARα agonists (14, 15).
In this study, the occurrence of urinary biomarkers of Pparα activation in the mouse is reported. To accomplish this, Pparα +/+ and Pparα −/− mice were treated with the prototypical PPARα ligand Wy-14,643 and urines analyzed using UPLC-TOFMS coupled with multivariate data analysis.
RESULTS
Phenotype of Pparα induction by Wy-14,643
To validate the efficacy of Wy-14,643 treatments, liver and body weights were determined after 15 days of Wy-14,643 feeding. Body weights were 20.4±1.7 (mean±s.d.) and 22.4±0.7 g in treated and 22.8±1.5 and 24.5±1.1 g for the untreated +/+ and −/− mice, respectively. These data revealed a 10% decrease in body weight (P<0.05) for the treated +/+ mice, compared with either the treated −/− mice or the untreated groups. In addition, liver to body weight ratio on day 15 was 0.15, 0.043, 0.041, and 0.055 for the +/+ treated, −/− treated, +/+ untreated, and −/− untreated groups, respectively revealing a 3-fold increase (P<0.005) in relative liver mass for the Wy-14,643-treated +/+ mice only. Taken together, this phenotype is consistent with earlier reports (3, 5) thus demonstrating Wy-14,643 activation of PPARα.
Multivariate data analysis of mouse urines
UPLC-TOFMS analysis of urine coupled with multivariate data analysis was used to profile urinary metabolome changes attributable to both non-activated PPARα (untreated +/+ versus untreated −/−) and Wy-14,643-treated PPARα-activated (treated +/+ versus untreated −/−) mice. The differences between all four groups of mice were best described by PCA with four components, having a R2 value of 0.58 and a Q2 value of 0.37 (Fig. 2A). Data from each of the four groups of animals clustered together, showing relatively little interindividual differences. The treated and untreated −/− mouse urines clustered together, but the treated and untreated +/+ mouse urines were widely separated in component 1. Moreover, untreated +/+ and untreated −/− urines separated slightly in component 1, but widely in component 2. Accordingly, it was decided to perform PCA analysis on the two untreated groups, with a view of uncovering differences due to the endogenous effect of the Pparα gene, in the absence of ligand activation. For the untreated animals alone (+/+ versus −/−), PCA yielded two components with R2 of 0.44 and Q2 of 0.24 (Fig. 2B). The +/+ and −/− groups separated widely in component 1. In contrast to the Wy-14,643-treated animals, there was considerable within-group variation in component 2, which could not be explained by housing in different cages. Because of these clear group separations in the PCA scores plots, it was not necessary to employ supervised multivariate analyses such as partial least-squares discriminant analysis (PLSDA) or orthogonal projection to latent surfaces (OPLS). This initial PCA analysis revealed specific metabolic phenotypes associated with the presence/absence of the Pparα gene and/or treatment with the PPARα ligand Wy-14,643. Having established that ligand activation of PPARα generated unique metabolic phenotypes in +/+ and −/− mice, and that untreated +/+ and −/− also displayed a different metabolic phenotype, PCA was further utilized to scrutinize which urinary ions were responsible for these PPARα-specific phenotype differences.
Fig. 2.

A) PCA scores plot of component 1 versus component 2 for four groups of mice, wild-type (+/+) and Pparα-null (−/−) mice, both untreated and treated with Wy-14,643. B) PCA scores plot of component 1 versus component 2 for two groups of mice, untreated wild-type (+/+) and Pparα-null (−/−) mice.
Examination of the loadings plot for the Wy-14,643-treated animals (Fig. 3A) revealed ions that deviated from the cloud of ions representing the urinary metabolome. These fell broadly into three groups. Firstly, several ions were elevated in the treated +/+ animals (towards the bottom right of Fig. 3A). Secondly, ions were discernible that were reduced in the treated +/+ animals compared to the treated −/− animals (towards the top left of Fig. 3A). Finally, a group of ions were apparent that were elevated in untreated +/+ mice compared to untreated −/− mice (towards the bottom left of Fig. 3A). In general, therefore, an increase in component 1 appears to be associated with Pparα activation by Wy-14,643, and a decrease in component 2 appears to be associated with the presence of the Pparα gene itself.
Fig. 3.

A) PCA loadings plot showing the effect of both Wy-14,643 and Pparα on the mouse urinary metabolome. Ions 1–6 are elevated in +/+ mice relative to −/− mice after Wy-14,643 treatment. Ions 7–9 are reduced in +/+ mice relative to −/− mice after Wy-14,643 treatment. Ion 10 is representative of substances that are excreted in higher amount in untreated +/+ mice relative to untreated −/− mice. Ions correspond to HDOPA [1], DHOPA [2], 2,8-dihydroxyquinoline glucuronide [3], nicotinamide 1-oxide [4], nicotinamide [5], hippuric acid [6a and 6b], cinnamoylglycine [7a and 7b], hexanoylglycine [8], phenylpropionylglycine [9], 2,8-dihydroxyquinoline (10), xanthurenic acid [11] [see below].
B) PCA loadings plot showing the effect of Pparα on the mouse urinary metabolome. Ions 7a, 7b, 10, and 11 are elevated in +/+ mice compared to −/− mice. Ions 6a and 6b are reduced in +/+ mice compared to −/− mice.
Perusal of the loadings plot for untreated animals revealed ions that are associated with the presence and absence of the Pparα gene (Fig. 3B). Specifically, ions most deviated to the right of Fig. 3B are associated with the presence of the Pparα gene, while those to the left are associated with the absence of the gene. It is of interest to note that two ions could be identified in both Fig. 3A and 3B that were associated with the presence of the Pparα gene, specifically, ions 10 and 11.
Identification of biomarkers for PPARα activation
Examination of the contributions table from SIMCA-P revealed that 6393 positive ions had been detected. The top 100 ions (50 elevated and 50 reduced by Wy-14,643 treatment) that contributed most to the separation between groups were then analyzed and 12 empirical formulae identified by their accurate masses. Values of m/z for protonated molecular ions or fragment ions (empirical formula) that were elevated in treated +/+ mice compared to treated −/− mice were 361.201 (C21H29O5), 363.216 (C21H31O5), 105.034 (C7H5O), 338.087 (C15H16NO8), 180.066 (C9H10NO3), 139.0.51 (C6H7N2O2) and 123.057 (C6H7N2O). The corresponding ions that were reduced in treated +/+ mice compared to treated −/− mice were 131.049 (C9H7O), 206.082 (C11H12NO3), 174.113 (C8H16NO3) and 208.098 (C11H14NO3). Two ions were identified that were increased in the untreated +/+ mice compared to the untreated −/− mice and were 162.054 (C9H8NO2), and 206.044 (C10H8NO4).
Biomarkers elevated in Ppar +/+ mice relative to −/− mice after 14 days of Wy-14,643 treatment
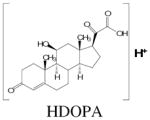
Regarding the ions elevated in treated +/+ mice, the top ranking three ions plus four others were unequivocally identified, as follows and as listed in Table 1. 11β-Hydroxy-3,20-dioxopregn-4-en-21-oic acid (HDOPA; C21H29O5; MH+ = 361.202) was the top ranking ion in the urine of +/+ mice treated with Wy-14,643. This mass corresponds to both aldosterone and cortisone. These candidates were both eliminated on the basis of their retention times and MSMS fragmentation (data not shown). It was noted that the corresponding negative ion ([M-H]− = 359.187) was 4-times more abundant in mouse urine than the positive ion. In addition, the deprotonated molecular ion readily formed a dimer ([M2-H]− = 719.366) in negative ion mode, typical of a carboxylic acid (16). Therefore, the 20-oxo 21-oic acid derived from corticosterone, which had the same mass (see above), was synthesized. Structural identity of this biomarker was confirmed by comparison of the urinary ion with the synthetic material using UPLC-MSMS (Fig. 4A).
Table 1.
Ions elevated in mouse urine after 14 days treatment with Wy-14,643
| m/z found | Retention time (min) | Rank | Empirical formula | m/z calculated | Mass error (ppm) | Structure of ion |
|---|---|---|---|---|---|---|
| 361.201 | 5.39 | 1 | C21H29O5 | 361.202 | 2.8 |
|
| 363.216 | 5.31 | 2 | C21H31O5 | 363.217 | 2.8 |

|
| 105.034 | 2.85 | 3 | C7H5O | 105.034 | 0 |
|
| 338.087 | 3.00 | 6 | C15H16NO8 | 338.088 | 3.0 |

|
| 139.051 | 0.61 | 11 | C6H7N2O2 | 139.051 | 0 |
|
| 180.066 | 2.84 | 12 | C9H10NO3 | 180.066 | 0 |

|
| 123.056 | 0.60 | 18 | C6H7N2O | 123.056 | 0 |

|
Fig. 4.

UPLC-MSMS of synthetic versus urinary HDOPA (A) and synthetic versus urinary DHOPA.
11β,20-Dihydroxy-3-oxopregn-4-en-21-oic acid (DHOPA; C21H31O5; MH+ = 363.217) was clearly HDOPA plus two hydrogens. The 20-hydroxy compound had been previously synthesized (17, 18). This compound had been described as a major metabolite of corticosterone found in the liver 1 h after i.p. injection of corticosterone to mice (17). Thus, the chemical identity of this biomarker was establishing by synthesis of this 20-hydroxy 21-oic acid (see above) and comparison of the MSMS fragmentation patterns of the synthetic and urinary materials, (Fig. 4B).
Hippuric acid (benzoylglycine; C9H10NO3; MH+ = 180.066 and 105.034 (fragment) gave perfect matches for hippuric acid and its benzoyl cation. Comparison of retention times and MSMS fragmentation for authentic hippuric acid and the urinary compound (Fig. 5A) established the identity of this biomarker.
Fig. 5.

A) UPLC-MSMS of synthetic versus urinary hippuric acid. Note that the protonated molecular ion (marked MH+) is unstable and absent from the spectra. B) UPLC-MSMS of synthetic versus urinary DHQ. C) UPLC-MSMS of DHQ glucuronide in urine. The 2-O-glucuronide is shown. This biomarker may also be the 8-O-glucuronide, or a mixture of both. Fragmentation with loss of 176 Da is shown.
2,8-Dihydroxyquinoline-β-D-glucuronide (C15H16NO8; MH − = 338.088) represents a common urinary finding in the mouse. To confirm the identity of this biomarker, urines were treated with β-glucuronidase and then reanalyzed by UPLC-TOFMS. Increases in 2,8-dihydroxyquinoline (DHQ) proportional to the glucuronide were observed (data not shown) and the presence of DHQ was determined by the comparison of the MSMS fragmentation of authentic DHQ and the urinary compound (Fig. 5B). In addition, the MSMS of the glucuronide in urine was studied and was consistent with the proposed structure (Fig. 5C), due to the diagnostic loss of 176 Da for glucuronides.
The identities of nicotinamide (C6H7N2O; MH+ = 123.056), Nicotinamide 1-oxide (C6H7N2O2; MH+ = 139.051). 1-methylnicotinamide (C7H9N2O; M+ = 137.071), and xanthurenic acid (C10H8NO4; MH+ = 206.045) were established by comparison of MSMS fragmentations of authentic standards and the urinary compounds (Fig. 6).
Fig. 6.

UPLC-MSMS of synthetic versus urinary nicotinamide (A), nicotinamide 1-oxide (B), 1-methylnicotinamide (C), and xanthurenic acid (D). Note that the protonated molecular ion (marked MH+ in panel D) is unstable and absent from the spectra.
Biomarkers reduced in Pparα +/+ mice relative to −/− mice after 14 days of Wy-14,643 treatment
Regarding the ions reduced in treated +/+ mice, the second ranking ion plus three others were unequivocally identified. All four ions were derived from three glycine conjugates, those of cinnamic acid (131.050+ (cinnamoyl cation fragment) and 206.082+), phenylpropionic acid (208.097+), and hexanoic acid (174.113+) [Table 2]. All three glycine conjugates were readily confirmed by comparison of the MSMS fragmentation of authentic versus the urinary compounds (data not shown). Both decreased and increased glycine conjugation of benzoic acid to hippuric acid has been reported in rats treated with PPARα activator fibrate drugs (19).
Table 2.
Ions decreased in mouse urine after 14 days treatment with Wy-14,643
| m/z found | Retention time (min) | Rank | Empirical formula | m/z calculated | Mass error (ppm) | Structure of ion |
|---|---|---|---|---|---|---|
| 131.049 | 4.35 | 2 | C9H7O | 131.050 | 7.6 |

|
| 174.113 | 3.71 | 12 | C8H16NO3 | 174.113 | 0 |

|
| 208.098 | 4.03 | 34 | C11H14NO3 | 208.097 | 4.8 |

|
| 206.082 | 4.33 | 38 | C11H12NO3 | 206.082 | 0 |

|
Biomarkers increased in untreated Pparα +/+ mice relative to Pparα −/− mice
Two ions, ranking 2nd and 3rd in the SIMCA-P contributions table, were identified unequivocally. The first of these was unconjugated DHQ (162.056+), which has already been dealt with above and whose authentication is depicted in Fig. 5B. The second was xanthurenic acid (206.045+) [Table 3]. The presence of this biomarker in urine was confirmed by comparison of the MSMS fragmentation of authentic compound and the urinary substance (Fig. 6).
Table 3.
Ions elevated in Pparα +/+ mouse urine compared to Pparα −/− mouse urine
| m/z found | Retention time (min) | Rank | Empirical formula | m/z calculated | Mass error (ppm) | Structure of ion |
|---|---|---|---|---|---|---|
| 162.054 | 3.32 | 2 | C9H8NO2 | 162.056 | 12.3 |

|
| 206.044 | 2.49 | 3 | C10H8NO4 | 206.045 | 4.9 |

|
Quantitation of biomarkers in urine of Wy-14,643 fed Pparα +/+ and −/− mice, and control fed Pparα +/+ and −/− mice
All biomarkers in Tables 1–3 were quantitated by UPLC-TOFMS using calibration curves with theophylline as an internal standard. With the exception of the two corticosteroids, HDOPA and DHOPA, all data were expressed as μmol/mmol creatinine, and thus were independent of urine volume. The mean±s.d. urinary excretion on day 14 after continuous feeding with a Wy-14,643 diet and control diet in both Pparα +/+ and −/− mice (8 per group) for HDOPA, DHOPA, and the four metabolites of the tryptophan-niacin pathway are displayed (Fig. 7). Due to insufficient synthetic standards of sufficient purity, proper calibration curves could not be constructed for DHOPA and HDOPA. Therefore, urinary excretion of HDOPA and DHOPA was calculated in terms of peak area of each compound relative to the theophylline internal standard area, then divided by mmol creatinine excreted. While −/− mice treated with Wy-14,643 had undetectable HDOPA in their urine, treated +/+ mice had a value of 374±109 standardized units of HDOPA in their urine. Moreover, −/− mice had 3.6±1.7 normalized units of urinary DHOPA but in +/+ mice, this value rose to 172 ±64. These intergenotype differences were highly statistically significant (P<0.0001). In the untreated groups, there were no significant differences in excretion of either HDOPA or DHOPA.
Fig. 7.
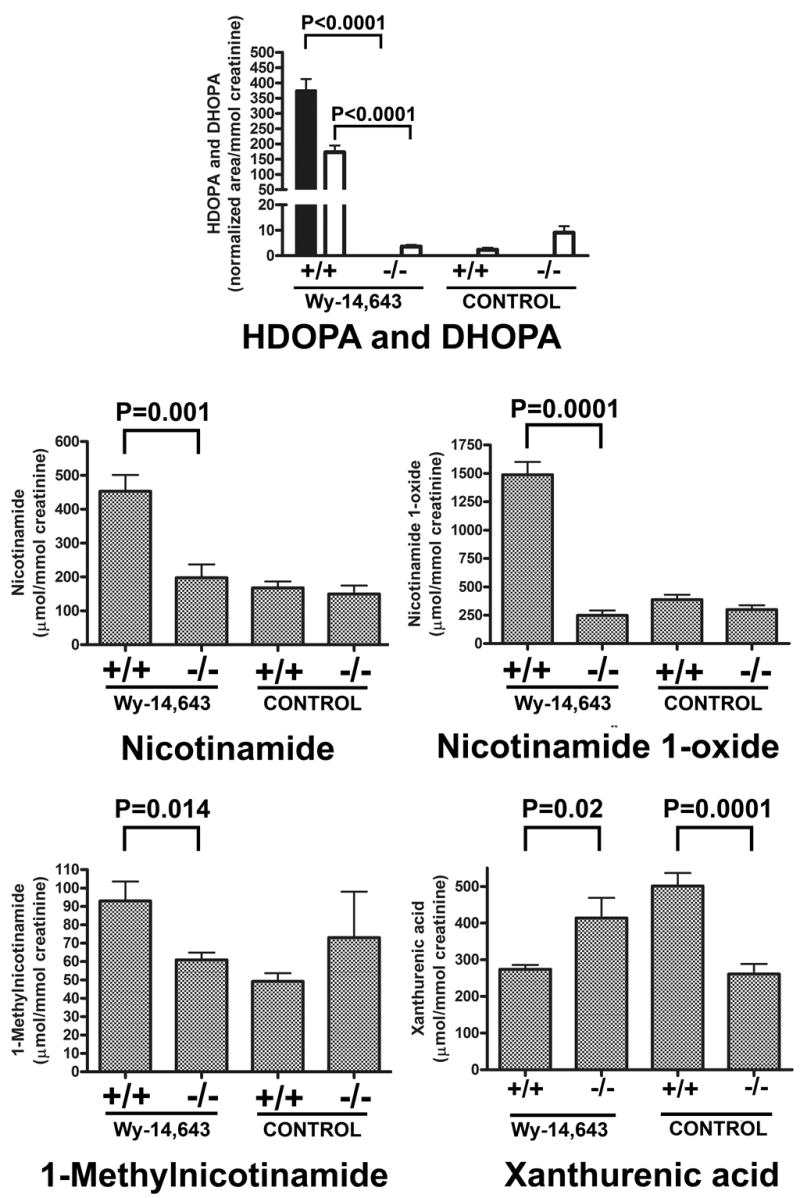
Quantitation of day 14 urinary HDOPA (black bars), DHOPA (white bars), nicotinamide, nicotinamide 1-oxide, 1-methylnicotinamide and xanthurenic acid in Wy-14,643-fed Pparα +/+ and −/− mice, and control Pparα +/+ and −/− mice. Group differences were calculated by two-tailed unpaired Student’s t-test (8 mice per group). Data are given as mean±s.e.m.
Activation of PPARα by Wy-14,643 caused a highly statistically significant (P=0.0001) five-fold increase (299±110 to 1490 ± 320 μmol/mmol creatinine) in nicotinamide 1-oxide excretion, a highly statistically significant (P=0.001) greater than two-fold increase (198±112 to 453±136) in nicotinamide excretion, and a statistically significant (P=0.014) 50% increase (60.9±11 to 92.9±30) in 1-methylnicotinamide excretion, relative to mice receiving the control diet. There were no statistically significant differences in the excretion of these three biomarkers between untreated Pparα +/+ and −/− mice. In addition, activation of PPARα by Wy-14,643 was associated with a statistically significant (P=0.02) ~30% decreased excretion of xanthurenic acid. Interestingly, untreated +/+ mice had the highest excretion of xanthurenic acid, a highly statistically significantly (P=0.0001) two-fold elevated excretion compared with untreated −/− mice. This finding is consistent with the position of xanthurenic acid on the loadings plot (Fig. 3A).
Activation of PPARα by dietary Wy-14,643 had a profound effect on the urinary excretion of 2,8-dihydroxyquinoline and its glucuronide (Fig. 8). Not only did PPARα activation significantly (P=0.008) enhance excretion of the glucuronide, but the total conjugated + unconjugated 2,8-dihydroxyquinoline was also increased from 150±150 to 392±223 μmol/mmol creatinine (P=0.04). In the untreated groups there was a considerable difference in excretion of unconjugated 2,8-dihydroxyquinoline between +/+ and −/− mice (P<0.0001) that was not reflected in a compensatory difference in excretion of the glucuronide. Indeed, an enhanced excretion of free + conjugated 2,8-dihydroxyquinoline of 397.9±196.7 was observed in +/+ mice versus 49.6±53.0 μmol/mmol creatinine for −/− mice (P=0.0003). Thus, the wild type (+/+) Pparα genotype is associated with increased excretion of free + conjugated 2,8-dihydroxyquinoline in both Wy-14,643-treated and untreated mice. The effect of PPARα activation by dietary Wy-14,643 was to shift the excretion to the glucuronide metabolite (Fig. 8).
Fig. 8.

Quantitation of day 14 urinary 2,8-dihydroxyquinoline, 2,8-dihydroxyquinoline-β-D-glucuronide, hexanoylglycine, hippuric acid, phenylpropionylglycine and cinnamoylglycine in Wy-14,643-fed Pparα +/+ and −/− mice, and control Pparα +/+ and −/− mice. Group differences were calculated by two-tailed unpaired Student’s t-test (8 mice per group). Data are given as mean±s.e.m.
Urinary excretion of three glycine conjugates, hexanoylglycine, phenylpropionylglycine and cinnamoylglycine was significantly decreased (P<0.0001 to 0.004) in both treated and untreated +/+ mouse groups relative to −/− mice (Fig. 8). Interestingly, the excretion of hippuric acid (benzoylglycine), while decreased in the untreated +/+ relative to −/− mice, displayed an increase (P<0.0001) associated with PPARα activation by Wy-14,643.
Metabolomic analysis of urine from Pparα +/+ and −/− mice fed a diet containing the PPARα ligand Wy-14,643 uncovered PPARα-specific urinary metabolic phenotypes that were characterized by both elevated and reduced excretion of endogenous metabolites, presumably as a result of the induction of PPARα target genes and resultant alterations in host metabolism.
DISCUSSION
This study underscores the power of metabolomics combined with transgenic mouse models in uncovering biomarkers associated with a single genotype or phenotype, in this case the Pparα +/+ genotype and the activated PPARα phenotype. Four groups of mice were used, Wy-14,643- treated and untreated Pparα +/+ and −/− mice. Clear group differences were apparent on principal components analysis, which established that off-receptor effects of dietary Wy-14,643 treatment were minimal, as the untreated and treated Pparα-null mice clustered together in the scores plot (Fig. 2A). However, a large on-receptor effect was apparent for the treated wild-type mice, with a shift of the treated +/+ cluster relative to the untreated +/+ cluster (Fig. 2A). A major change in the urinary metabolome was therefore expected due to PPARα activation by dietary Wy-14,643. Interestingly, a similar difference in the scores plot was observed for the untreated Pparα wild-type and null mice (Fig. 2B), suggesting the presence of an activated PPARα phenotype in the absence of exogenous PPARα ligand treatment. As with the treated groups, a change in the urinary metabolome due to the genotype difference alone could be anticipated. Examination of the loadings plots (Fig. 3) and analysis of the ions derived from them (Figs. 4–6), yielded a number of biomarkers that were associated with PPARα activation. The most dramatic increase in urinary excretion was observed for two derivatives of corticosterone, 11β-hydroxy-3,20-dioxopregn-4-en-21 -oic acid (HDOPA) and 11β,20-dihydroxy-3-oxopregn-4-en-21-oic acid (DROPA) [Fig. 1]. These appear to be highly specific biomarkers for PPARα activation in the mouse (Fig. 7). The urinary excretion of DHOPA is elevated ~50-fold and that of HDOPA even more so, rising from undetectable (<0.1 unit/mmol creatinine) in the treated null mice to 374.3±108.8 unit/mmol creatinine in the treated wild-type mice (>3,700-fold). The question remains as to which target gene of PPARα is responsible for this massively elevated synthesis and excretion of HDOPA and DHOPA? The in vivo conversion of corticosterone ([I] in Fig. 1) to DHOPA ([III] in Fig. 1) may well proceed via the aldehyde intermediate 11β-hydroxy-3,20-dioxopregn-4-en-21-al ([IIa] in Fig. 1) as it does in the chemical synthesis. In fact, we have demonstrated that various recombinant human cytochromes P450, and especially CYP3A4, are able to convert corticosterone to the gem-diol form of the aldehyde ([IIb] in Fig. 1) [Supplementary Fig. 1A]. This oxidation of an alcohol to its corresponding aldehyde was not carried out by hepatic alcohol dehydrogenase [Supplementary Fig. 1B]. In none of these in vitro experiments was there any evidence of the formation of DHOPA or HDOPA, as judged by MSMS comparisons, in both ES+ and ES− modes, with the two urinary and synthetic corticosteroid acids. Since CYP3A4 is highly abundant in the liver (20), the conversion of corticosterone to its aldehyde presumably occurs readily and the formation of DHOPA by isomerization of the aldehyde (Fig. 1) and its subsequent dehydrogenation to HDOPA are both reactions carried out by as yet unidentified PPARα target gene products. Possible candidates include aldehyde dehydrogenase type 3, lactate dehydrogenase A4 (DHOPA to HDOPA is analogous to lactate to pyruvate), 11β-HSD I and 17β-HSD I, or one of the many cytochromes P450 that are upregulated by PPARα in the mouse (21). Elucidation of this falls beyond the scope of this report.
Fig. 1.

Synthetic scheme for the two steroid acids 11β,20-dihydroxy-3-oxo-4-pregnen-21-oic acid (DHOPA; [III]) and 11β-hydroxy-3,20-dioxopregn-4-en-21-oic acid (HDOPA; [IV]) from corticosterone [I] via its 21-aldehyde [IIa]. The aldehyde also exists in a hydrated gem-diol form [IIb].
The excretion in the various mouse groups of four tryptophan metabolites in the tryptophan-nicotinamide pathway was also uncovered in this study. Nicotinamide (NM in Fig. 9) is a catabolic product of nicotinamide adenine dinucleotide (NAD). NM was significantly elevated in wild-type compared to Pparα-null mice. Moreover, two NM metabolites, nicotinamide 1-oxide (NMO) and 1-methylnicotinamide (MNM) were also both significantly elevated in Pparα +/+ mice (Fig. 7). The secondary NM metabolites 2-Py and 4-Py were not determined. The major NM excretory product in all mice was NMO, representing about 70% of the NM-related metabolites in Wy-14,643-treated +/+ mice, where it was increased six-fold over the −/− mice. In contrast, MNM showed only a modest, but statistically significant (P=0.014), difference between treated +/+ and −/− mice. This biomarker had been previously reported to be associated with PPARα activation in the rat (14). The enhanced excretion of NM, NMO and MNM was to be expected, given the critical role played by PPARα in regulating the tryptophan-nicotinamide pathway through its downregulation of ACMSD (EC 4.1.1.45) (22). As Fig. 9 shows, flux from tryptophan to nicotinamide, in particular between 3-hydroxyanthranilic acid (3-HA) and quinolinic acid (QA), is influenced by the degree of leakage out of the pathway, by conversion of ACMS to AMS by ACMSD. Also fitting these expectations, is the observation that xanthurenic acid (XA) showed a modest decrease in excretion in treated +/+ mice versus −/− mice. In contrast, however, XA excretion was significantly increased in untreated +/+ mice relative to −/− mice. This may simply reflect the complexity of the effects of PPARα on the tryptophan-nicotinamide pathway (22–24).
Fig. 9.

The tryptophan-nicotinamide pathway showing the hepatic conversion of the essential amino acid L-tryptophan (L-Trp) to nicotinamide (NM) and the formation of nicotinamide adenine dinucleotide (NAD). L-Trp undergoes ring-opening, leading to 3-hydroxykynurenine (3-HK), which can then either be converted to the urinary metabolite xanthurenic acid (XA) or to 3-hydroxyanthranilic acid (3-HA), which in turn forms α-amino-β-carboxymuconate-ε-semialdehyde (ACMS). This intermediate represents a key branch-point in the pathway with either the non-enzymic conversion of ACMS to quinolinic acid (QA) or decarboxylation by α-amino-β-carboxymuconate-ε-semialdehyde decarboxylase (ACMSD; EC 4.1.1.45), that terminates the conversion of L-Trp to NAD through the formation of α-aminomuconate-ε-semialdehyde (AMS), which is further catabolized. The nicotinamide metabolites shown are nicotinamide 1-oxide (NMO), 1-methylnicotinamide (MNM) and l-methyl-2-pyridone-5-carboxamide (2-Py) and l-methyl-4-pyridone-5-carboxamide (4-Py). ACMSD is a hepatic PPARα target gene product that is negatively regulated (22).
The increased glucuronidation of 2,8-dihydroxyquinoline in treated +/+ mice compared with all other groups, may be due to PPARα upregulation of one or more UDP-glucuronosyltransferases. To our knowledge, there have been no reported studies of the glucuronidation of 2,8-dihydroxyquinoline. UGT1A9 was reported to be a PPARα target gene (25) and quantitative structure-activity relationships reported for the glucuronidation of multiple simple and bulky phenols by UGT1A9 (26). Induction of UGT1A9 by Wy-14,643 is a likely explanation for our observation that 2,8-dihydroxyquinoline-β-D-glucuronide is a urinary biomarker for PPARα activation in the mouse. The formation of 2,8-dihydroxyquinoline is probably carried out by the gut microbiota. This compound has been reported to be formed from quinoline by Pseudomonas sp. in sewage (27, 28). Its formation by gut microbiota or by mammalian tissues has not been reported. As discussed above, the excretion of free + conjugated 2,8-dihydroxyquinoline is considerably greater in both treated and untreated +/+ mice compared to their respective −/− counterparts. This suggests that the Pparα +/+ genotype alone is influencing the biosynthesis of 2,8-dihydroxyquinoline. It may be speculated that this is evidence for an effect of a host nuclear receptor on gut floral metabolism, by an as yet unidentified mechanism.
Finally, the excretory pattern of four glycine conjugates, one aliphatic and of fatty acid origin (hexanoylglycine) and three aromatic (benzoyl-,phenylpropionyl- and cinnamoyl-glycines), was influenced by PPARα activation. The observations may be rationalized in terms of the known effects of PPARα on mitochondrial fatty acid β-oxidation (21), whereby upregulated β-oxidation might be expected to reduce the pool of CoA available for mitochondrial glycine conjugation. For example, as MCAD is upregulated by PPARα (21), hexanoyl-CoA would be expected to be β-oxidised rapidly, with little conjugation to hexanoylglycine taking place. The findings in Fig. 8 appear to support this view. In addition, the phenylpropionic acid derivatives, phenylpropionic acid itself and cinnamic acid, may also undergo enhanced β-oxidation, yielding benzoic acid, which would then be conjugated with glycine to hippuric acid and excreted. Again, this is one explanation for the link between PPARα and the findings in Fig. 8. Alternatively, the gut microbiota may also play a role. A reciprocal relationship between hippuric acid excretion and the excretion of chlorogenic acid metabolites, attributed to differences in gut floral metabolism, has been reported as comprising two distinct phenotypes in rats (29). The two phenotypes, designated “high hippuric acid” and “high chlorogenic acid” differed five-fold in hippuric acid excretion. The low hippuric acid excreting “high chlorogenic acid” phenotype was reported to revert to the “high hippuric acid” phenotype when rats of both phenotypes were housed in the same room. If such phenotypes also exist in the mouse, they may be PPARα-dependent. It should be noted that the untreated Pparα +/+ genotype is a phenotypically low excretor of hippuric acid compared to the −/− phenotype (P<0.0001; Fig. 8). Since mammals excrete relatively little unchanged benzoic acid (30), low and high excretors of hippuric acid are presumably low and high producers of benzoic acid, respectively.
From the application of UPLC-TOFMS-based metabolomics to the study of transgenic mice a number of elevated urinary biomarkers for PPARα activation were uncovered in this study. These include 11β-hydroxy-3,20-dioxopregn-4-en-21 -oic acid, 11β,20-dihydroxy-3-oxopregn-4-en-21-oic acid, 2,8-dihydroxyquinoline-β-D-glucuronide, nicotinamide, nicotinamide 1-oxide, and 1-methylnicotinamide. Several other attenuated urinary biomarkers were found, those whose excretion declined in concert with PPARα activation, and included xanthurenic acid, hexanoylglycine, phenylpropionylglycine, and cinnamoylglycine. This pattern of an altered urinary metabolome that reflects the phenotype of PPARα activation may serve as a noninvasive evaluation of PPARα activation in patients receiving drugs that are PPARα ligands and as a means of determining in vivo and noninvasively the pharmacological efficacy of novel drugs in clinical trials that are known or suspected to possess PPARα ligand activity.
A summary of the induction of PPARα target genes in the mouse as detected by urinary metabolomics is shown in Fig. 10. Two contrasting induction mechanisms are shown, both of which are reflected in the urinary metabolic phenotypes that have been defined here. First, ligand-activated PPARα has been reported to reduce hepatic HNF4α levels and proposed as the mechanism by which PPARα reduces transcription of ACMSD, a key gene in the tryptophan-nicotinamide pathway and de novo NAD synthesis (22). Accordingly, our observation that the Pparα +/+ metabolic phenotype includes elevated urinary excretion of the NAD metabolites NM, MNO, and NMN, can be interpreted on the basis of the known effects of PPARα on the enzyme ACMSD. In contrast, when the PPARα-RXR heterodimer binds to the PPRE of target genes, this can be detected in the PPARα +/+ urinary metabolic phenotype as increased synthesis and urinary excretion of metabolites of the affected enzymes. The massive urinary elevation (>3,700-fold) of the corticosteroid acid HDOPA in treated +/+ mice relative to −/− mice, together with the 50-fold increase in excretion of its precursor DHOPA, can be interpreted as due to the induction by PPARα of a dehydrogenase enzyme, presumably a 20-hydroxysteroid dehydrogenase (Fig. 10). In turn, the DHOPA precursor of HDOPA must arise by isomerization of the product of corticosterone oxidation by cytochrome P450, likely by a CYP3A enzyme in mice since CYP3A4 can carry out this reaction (supplementary Fig.). This isomerization is unlikely to be a spontaneous reaction, since DHOPA excretion is so elevated in the PPARα +/+ metabolic phenotype. Our observations cannot be explained by the upregulation of Cyp3a transcription, as these genes are unlikely to be PPARα target genes (21). The power of metabolomics in combination with genetically-modified mice, as shown in Fig. 10, is that it may uncover new pathways of endogenous metabolism and potential novel nuclear receptor target genes.
Fig. 10.

Mechanistic representation of the proposed role of ligand-activated PPARα in the generation of urinary biomarkers observed in Pparα +/+ mice relative to Pparα −/− mice. The reduced activity of α-amino-β-carboxymuconate-ε-semialdehyde decarboxylase (ACMSD)-mediated conversion of α-amino-β-carboxymuconate-ε-semialdehyde (ACMS) to α-aminomuconate-ε-semialdehyde (AMS) occurs due to reduced levels of HNF4α brought about by ligand-activated PPARα. This reduced ACMS metabolism, in turn, leads to the spontaneous ring closure of ACMS to quinolinic acid (see Fig. 9) and further metabolism to NAD, which is detected as enhanced NAD urinary metabolites, nicotinamide (NM), nicotinamide 1-oxide (NMO), and 1-methylnicotinamide (NMN). In contrast, ligand-activated PPARα-RXR heterodimer binds to the peroxisome proliferator responsive element (PPRE) of an as yet unidentified target gene, leading to increased synthesis of 11β-hydroxy-3,20-dioxopregn-4-en-21-oic acid (HDOPA) from 11β,20-dihydroxy-3-oxo-4-pregnen-21-oic acid (DHOPA), presumably by a hydroxysteroid dehydrogenase (HSD) enzyme. DHOPA is itself synthesized from corticosterone by cytochrome P450 3A4 (CYP3A4; supplementary Fig.) thus suggesting that a mouse CYP3A P450 carries out this reaction, and a putative isomerase.
MATERIALS AND METHODS
Chemicals
Hexanoylglycine and phenylpropionylglycine were obtained from the Metabolic Laboratory, VU Medical Center (Amsterdam, Netherlands). Corticosterone was purchased from Steraloids (Newport, RI). Nicotinamide, nicotinamide 1-oxide, 1-methylnicotinamide, hippuric acid, cinnamoylglycine, titanium (III) chloride, copper (II) acetate, aldosterone, cortisone, corticosterone, theophylline and β-glucuronidase powder (type H-1 from Helix pomatia) were purchased from Sigma-Aldrich (St. Louis, MO). 2,8-Dihydroxyquinoline was provided by the Developmental Therapeutics Program, National Cancer Institute (Frederick, MD). HPLC grade solvents (acetonitrile, ethanol and water) were purchased from Fisher Scientific (Hampton, NH).
Synthesis of 11β,20-dihydroxy-3-oxopregn-4-en-21-oic acid (DHOPA) and 11β-hydroxy-3,20-dioxopregn-4-en-21-oic acid (HDOPA)
11β,20-Dihydroxy-3-oxo-4-pregnen-21-oic acid (DHOPA) was synthesized according to previously described methods (17, 18). In brief, a solution of 120 mg of copper (II) acetate in 60 mL methanol was added to a solution of 500 mg corticosterone in the same solvent (40 mL). The mixture was stirred at room temperature for 10 min, air was bubbled through the mixture for a further 60 min and then the methanol removed by evaporation. The corresponding 21-aldehyde was obtained in the organic phase by extraction using a mixture of aqueous sodium sulfate (8%) and ethyl acetate. After evaporation of the ethyl acetate, the crude product was subjected to chemical rearrangement with 0.18M sodium hydroxide. The resultant DHOPA was extracted into 1 vol ethyl acetate after the reaction mixture was adjusted to pH 2.0 with 5 M HCl. The yield was 30%. HDOPA was obtained by oxidation of DHOPA with alkaline silver nitrate (31, 32), with a yield of 20%. The reaction scheme is shown in Fig. 1.
Titanium (III) chloride reduction
TiCl3 was used to reduce N-oxide derivatives as recently described (12). Twenty μL ice-cold urine samples were added to 20 μL ice-cold TiCl3 (or 5M HCl as a negative control) and the solution vortexed for 10 seconds. The reaction mixture was agitated at room temperature for one hour and 40 μL of saturated sodium bicarbonate and 20 μL water were added to the reaction to yield a final pH of 3.0. After brief centrifugation, the solution was analyzed by UPLC-TOFMS.
Animals and treatments
C57BL/6N male Pparα-null mice (33) were used in this study; the corresponding 5–6 week-old wild-type mice were purchased from Charles River Laboratories (Frederick, MD). Mice were housed 3–5 animals/cage (6–8 mice/group), maintained under a standard 12 h light/12 h dark cycle with water and chow provided ad libitum. Handling was in accordance with an animal study protocol approved by the National Cancer Institute Animal Care and Use Committee. Mice were put on a rodent grain base diet (Bioserv, Frenchtown, NJ) for two weeks. Animals in control groups were on the same diet for another two weeks while treatment groups were changed to a 0.1% Wy-14,643 diet (Bioserv).
Urine collections
Mice were placed in glass metabolic cages (Jencons, Leighton Buzzard, U.K.) for 24 h on day 10 and day 12 of Wy-14,643 treatment to acclimate to the cages. On days 11 and 13 they were returned to their home cages. On day 14, mice were placed again in glass metabolic cages and urine samples were collected for 24 h and stored at −80 °C until analysis. Mice were killed on day 15 and livers and serum were collected and stored at −80 °C.
UPLC-TOFMS analyses
Urine samples were diluted with 4 vol of 50% aqueous acetonitrile and centrifuged at 18,000 g to remove particulates and proteins. Urine samples (5 μL/injection) subjected to chromatography on a 50 × 2.1 mm ACQUITY™ 1.7 μm BEH C18 column (Waters Corporation, Milford, MA) using an ACQUITY UPLC system (Waters Corporation) with a gradient mobile phase comprised of 0.1% formic acid and acetonitrile containing 0.1% formic acid. A 0.5 mL/min flow rate was maintained in a 10 min run. The eluent was introduced directly into the mass spectrometer by electrospray. Mass spectrometry was performed on a Waters Q-TOF Premier operating in positive-ion mode. The desolvation gas flow was set to 650 L/h at a temperature of 350 °C with the cone gas set to 50 L/h and the source temperature at 120 °C. The capillary voltage and the cone voltage were set to 3000 and 30 V, respectively. Sulfamethoxine was used as the lock mass (m/z 311.0814) for accurate mass calibration and introduced using the LockSpray interface at 60~70 μL/min and a concentration of 0.5 ng/μL in 50% aqueous acetonitrile. In MS scanning, data were acquired in the centroid mode from 100 to 850 m/z. For MS/MS fragmentation of target ions, collision energies ranging from 15 to 35 V were applied.
Multivariate data analysis of urinary metabolite markers
Centroided and integrated mass spectrometric data were processed by MarkerLynx mass spectrometry software (Waters Corporation) to generate a multivariate data matrix. The retention time window was set between 0.1 to 6.5 min and mass window was set between 100 to 850 with a mass tolerance at 0.05. Ions that were obviously derived from Wy-14,643, specifically of m/z = 324.057 (Wy-14,643 parent compound), 340.052 (putative hydroxylated Wy-14,643) and 354.032 (putative Wy-14,643 carboxy metabolite) were excluded from the data matrix. In addition, MetaboLynx software (Waters) was used to generate a table ions that derived from theoretical Wy-14,643 metabolites, e.g. putative glucuronides and sulfates of hydroxylated and dihydroxylated Wy-14,643, and these were also deleted from the data matrix. The data matrix was further analyzed by SEMCA-P+ 11 software (Umetrics, Kinnelon, NJ). Principal components analysis (PCA) was conducted after the data were transformed by Pareto scaling, in which the importance of the low concentration metabolites was increased, without noise amplification. Identification of the potential biomarkers of PPARα activation was performed by analyzing the corresponding loading plots and contribution lists generated by MarkerLynx.
Structure elucidation of the urinary markers
The molecular formulae were calculated from the accurate masses using MassLynx with a mass tolerance of 10 ppm. Biologically plausible empirical formulae were used to search multiple chemical databases to reveal potential candidate biomarkers. Where authentic standards were available, confirmation of identity was sought by comparison of UPLC retention times and MSMS spectra. In the case of nicotinamide 1-oxide, additional confirmation of the identity of this biomarker in mouse urine was obtained by reduction of urines with TiCl3, which is specific for N-oxides (see above).
Quantification of urinary metabolites
MetaboLynx and QuantLynx software was applied to quantify the amounts of urinary metabolites from their peak areas. In the case where authentic standards were available, specifically, nicotinamide (MH+ = 123.056 m/z), 1-methylnicotinamide (M+ = 137.072 m/z) and nicotinamide 1-oxide (MH+ = 139.051 m/z), calibration curves were constructed from 0.1 to 5.0 μM using theophylline (3.125 μM; MH+ = 181.073 m/z) as internal standard. In the case of xanthurenic acid (MH+ = 206.0453) and 2,8-dihydroxyquinoline (MH+ = 162.0555), calibration curves were constructed from 5–25 μM, and for hexanoylglycine (MH+ = 174.1130), hippuric acid (MH+ = 180.0661), phenylpropionylglycine (MH+ = 208.0974) and cinnamoylglycine (MH+ = 206.0817), the calibration range was 10–100 μM. Creatinine concentration (0.1 to 5.0 μM; MH+ = 114.067 m/z) was also calculated from the MS data using theophylline as internal standard, as above. The retention time window set at 0.25–0.40 min depending on the size of the peak, and mass window set at 0.010 amu. Absolute peak areas were used to calculate peak area ratios (analyte/theophylline). All calibration curves were linear from 0.1 to 5.0 μM for each analyte (r; P) as follows: nicotinamide (0.95; <0.0001), 1-methylnicotinamide (0.92; <0.0001), nicotinamide 1-oxide (0.98; <0.0001), xanthurenic acid (0.96; <0.0001), 2,8-dihydroxyquinoline (0.91; 0.0003), hippuric acid (0.99; <0.0001), hexanoylglycine (0.99; <0.0001), phenylpropionylglycine (0.99; <0.0001), cinnamoylglycine (0.97; <0.0001) and creatinine (0.97; <0.0001). Limits of sensitivity (μM) were creatinine (0.1), nicotinamide (0.1), 1-methylnicotinamide (0.05), and nicotinamide 1-oxide (0.01), xanthurenic acid [5], 2,8-dihydroxyquinoline [5], hexanoylglycine [10], hippuric acid [10], phenylpropionylglycine [10], and cinnamoylglycine [10]. The relative insensitivity of the method for the four glycine conjugates is a reflection of their relatively poor ionization in electrospray positive mode (ES+). Concentrations of 2,8-dihydroxyquinoline-β-D-glucuronide were estimated from the increase in 2,8-dihydroxyquinoline (MH+ = 162.0555) after deconjugation with β-glucuronidase for 18 h at pH 5.0. In all cases, the ion corresponding to the glucuronide (MH+ = 338.0876) disappeared after hydrolysis. Concentration of each analyte in mouse urine (dilutions from 5- to 300-fold) was determined from these calibration curves and expressed as μmol/mmol creatinine.
Supplementary Material
Footnotes
Disclosure statement: The authors have nothing to disclose.
This study was supported by the National Cancer Institute Intramural Research Program. J.R.I. was supported by the US Smokeless Tobacco Company under a grant for collaborative research.
Publisher's Disclaimer: "This is an un-copyedited author manuscript copyrighted by The Endocrine Society. This may not be duplicated or reproduced, other than for personal use or within the rule of “Fair Use of Copyrighted Materials” (section 107, Title 17, U.S. Code) without permission of the copyright owner, The Endocrine Society. From the time of acceptance following peer review, the full text of this manuscript is made freely available by The Endocrine Society at http://www.endojournals.org/. The final copy edited article can be found at http://www.endojournals.org/. The Endocrine Society disclaims any responsibility or liability for errors or omissions in this version of the manuscript or in any version derived from it by the National Institutes of Health or other parties. The citation of this article must include the following information: author(s), article title, journal title, year of publication and DOI.
References
- 1.Kota BP, Huang TH, Roufogalis BD. An overview on biological mechanisms of PPARs. Pharmacol Res. 2005;51:85–94. doi: 10.1016/j.phrs.2004.07.012. [DOI] [PubMed] [Google Scholar]
- 2.Peters JM, Cheung C, Gonzalez FJ. Peroxisome proliferator-activated receptor-alpha and liver cancer: where do we stand? J Mol Med. 2005;83:774–785. doi: 10.1007/s00109-005-0678-9. [DOI] [PubMed] [Google Scholar]
- 3.Reddy JK, Moody DE, Azarnoff DL, Tomarelli RM. Hepatic effects of some [4-chloro-6-(2,3-xylidino)-2-pyrimidinylthio] acetic acid (WY-14,643) analogs in the mouse. Arch Int Pharmacodyn Ther. 1977;225:51–57. [PubMed] [Google Scholar]
- 4.Reddy JK, Rao MS, Azarnoff DL, Sell S. Mitogenic and carcinogenic effects of a hypolipidemic peroxisome proliferator, [4-chloro-6-(2,3-xylidino)-2-pyrimidinylthio]acetic acid (Wy-14, 643), in rat and mouse liver. Cancer Res. 1979;39:152–161. [PubMed] [Google Scholar]
- 5.Lee SS, Pineau T, Drago J, Lee EJ, Owens JW, Kroetz DL, Fernandez-Salguero PM, Westphal H, Gonzalez FJ. Targeted disruption of the alpha isoform of the peroxisome proliferator-activated receptor gene in mice results in abolishment of the pleiotropic effects of peroxisome proliferators. Mol Cell Biol. 1995;15:3012–3022. doi: 10.1128/mcb.15.6.3012. [DOI] [PMC free article] [PubMed] [Google Scholar]
- 6.Tweeddale H, Notley-McRobb L, Ferenci T. Effect of slow growth on metabolism of Escherichia coli, as revealed by global metabolite pool (“metabolome”) analysis. J Bacteriol. 1998;180:5109–5116. doi: 10.1128/jb.180.19.5109-5116.1998. [DOI] [PMC free article] [PubMed] [Google Scholar]
- 7.Nicholson JK, Lindon JC, Holmes E. ‘Metabonomics’: understanding the metabolic responses of living systems to pathophysiological stimuli via multivariate statistical analysis of biological NMR spectroscopic data. Xenobiotica. 1999;29:1181–1189. doi: 10.1080/004982599238047. [DOI] [PubMed] [Google Scholar]
- 8.Gavaghan CL, Holmes E, Lenz E, Wilson ID, Nicholson JK. An NMR-based metabonomic approach to investigate the biochemical consequences of genetic strain differences: application to the C57BL10J and Alpk:ApfCD mouse. FEBS Lett. 2000;484:169–174. doi: 10.1016/s0014-5793(00)02147-5. [DOI] [PubMed] [Google Scholar]
- 9.Griffin JL, Walker LA, Garrod S, Holmes E, Shore RF, Nicholson JK. NMR spectroscopy based metabonomic studies on the comparative biochemistry of the kidney and urine of the bank vole (Clethrionomys glareolus), wood mouse (Apodemus sylvaticus), white toothed shrew (Crocidura suaveolens) and the laboratory rat. Comp Biochem Physiol B Biochem Mol Biol. 2000;127:357–367. doi: 10.1016/s0305-0491(00)00276-5. [DOI] [PubMed] [Google Scholar]
- 10.Waters NJ, Holmes E, Williams A, Waterfield CJ, Farrant RD, Nicholson JK. NMR and pattern recognition studies on the time-related metabolic effects of alpha-naphthylisothiocyanate on liver, urine, and plasma in the rat: an integrative metabonomic approach. Chem Res Toxicol. 2001;14:1401–1412. doi: 10.1021/tx010067f. [DOI] [PubMed] [Google Scholar]
- 11.Plumb R, Granger J, Stumpf C, Wilson ID, Evans JA, Lenz EM. Metabonomic analysis of mouse urine by liquid-chromatography-time of flight mass spectrometry (LC-TOFMS): detection of strain, diurnal and gender differences. Analyst. 2003;128:819–823. doi: 10.1039/b304296k. [DOI] [PubMed] [Google Scholar]
- 12.Giri S, Krausz KW, Idle JR, Gonzalez FJ. The metabolomics of (+/−)-arecoline 1-oxide in the mouse and its formation by human flavin-containing monooxygenases. Biochem Pharmacol. 2007;73:561–573. doi: 10.1016/j.bcp.2006.10.017. [DOI] [PubMed] [Google Scholar]
- 13.Shibata K, Fukuwatari T, Enomoto A, Sugimoto E. Increased conversion ratio of tryptophan to niacin by dietary di-n-butylphthalate. J Nutr Sci Vitaminol (Tokyo) 2001;47:263–266. doi: 10.3177/jnsv.47.263. [DOI] [PubMed] [Google Scholar]
- 14.Ringeissen S, Connor SC, Brown HR, Sweatman BC, Hodson MP, Kenny SP, Haworth RI, McGill P, Price MA, Aylott MC, Nunez DJ, Haselden JN, Waterfield CJ. Potential urinary and plasma biomarkers of peroxisome proliferation in the rat: identification of N-methylnicotinamide and N-methyl-4-pyridone-3-carboxamide by 1H nuclear magnetic resonance and high performance liquid chromatography. Biomarkers. 2003;8:240–271. doi: 10.1080/1354750031000149124. [DOI] [PubMed] [Google Scholar]
- 15.Connor SC, Hodson MP, Ringeissen S, Sweatman BC, McGill PJ, Waterfield CJ, Haselden JN. Development of a multivariate statistical model to predict peroxisome proliferation in the rat, based on urinary 1H-NMR spectral patterns. Biomarkers. 2004;9:364–385. doi: 10.1080/13547500400006005. [DOI] [PubMed] [Google Scholar]
- 16.Schug K, McNair HM. Adduct formation in electrospray ionization mass spectrometry II. Benzoic acid derivatives. J Chromatogr A. 2003;985:531–539. doi: 10.1016/s0021-9673(02)01732-6. [DOI] [PubMed] [Google Scholar]
- 17.Han A, Marandici A, Monder C. Metabolism of corticosterone in the mouse. Identification of 11 beta, 20 alpha-dihydroxy-3-oxo-4-pregnen-21-oic acid as a major metabolite. J Biol Chem. 1983;258:13703–13707. [PubMed] [Google Scholar]
- 18.Oh SW, Monder C. Synthesis of corticosteroid derivatives containing the 20beta-ol-21-al side chain. J Org Chem. 1976;41:2477–2480. doi: 10.1021/jo00876a029. [DOI] [PubMed] [Google Scholar]
- 19.Gregus Z, Fekete T, Halaszi E, Gyurasics A, Klaassen CD. Effects of fibrates on the glycine conjugation of benzoic acid in rats. Drug Metab Dispos. 1998;26:1082–1088. [PubMed] [Google Scholar]
- 20.Daly AK. Significance of the minor cytochrome P450 3A isoforms. Clin Pharmacokinet. 2006;45:13–31. doi: 10.2165/00003088-200645010-00002. [DOI] [PubMed] [Google Scholar]
- 21.Mandard S, Muller M, Kersten S. Peroxisome proliferator-activated receptor alpha target genes. Cell Mol Life Sci. 2004;61:393–416. doi: 10.1007/s00018-003-3216-3. [DOI] [PMC free article] [PubMed] [Google Scholar]
- 22.Shin M, Kim I, Inoue Y, Kimura S, Gonzalez FJ. Regulation of mouse hepatic alpha-amino-beta-carboxymuconate-epsilon-semialdehyde decarboxylase, a key enzyme in the tryptophan-nicotinamide adenine dinucleotide pathway, by hepatocyte nuclear factor 4alpha and peroxisome proliferator-activated receptor alpha. Mol Pharmacol. 2006;70:1281–1290. doi: 10.1124/mol.106.026294. [DOI] [PubMed] [Google Scholar]
- 23.Shin M, Ohnishi M, Iguchi S, Sano K, Umezawa C. Peroxisome-proliferator regulates key enzymes of the tryptophan-NAD+ pathway. Toxicol Appl Pharmacol. 1999;158:71–80. doi: 10.1006/taap.1999.8683. [DOI] [PubMed] [Google Scholar]
- 24.Shin M, Sano K, Umezawa C. Effects of peroxisome-proliferators on the TRP-NAD pathway. Adv Exp Med Biol. 1999;467:333–340. doi: 10.1007/978-1-4615-4709-9_43. [DOI] [PubMed] [Google Scholar]
- 25.Barbier O, Villeneuve L, Bocher V, Fontaine C, Torra IP, Duhem C, Kosykh V, Fruchart JC, Guillemette C, Staels B. The UDP-glucuronosyltransferase 1A9 enzyme is a peroxisome proliferator-activated receptor alpha and gamma target gene. J Biol Chem. 2003;278:13975–13983. doi: 10.1074/jbc.M300749200. [DOI] [PubMed] [Google Scholar]
- 26.Ethell BT, Ekins S, Wang J, Burchell B. Quantitative structure activity relationships for the glucuronidation of simple phenols by expressed human UGT1A6 and UGT1A9. Drug Metab Dispos. 2002;30:734–738. doi: 10.1124/dmd.30.6.734. [DOI] [PubMed] [Google Scholar]
- 27.Shukla OP. Microbial transformation of quinoline by a Pseudomonas sp. Appl Environ Microbiol. 1986;51:1332–1342. doi: 10.1128/aem.51.6.1332-1342.1986. [DOI] [PMC free article] [PubMed] [Google Scholar]
- 28.Shukla OP. Microbiological degradation of quinoline by Pseudomonas stutzeri: the coumarin pathway of quinoline catabolism. Microbios. 1989;59:47–63. [PubMed] [Google Scholar]
- 29.Robosky LC, Wells DF, Egnash LA, Manning ML, Reily MD, Robertson DG. Metabonomic identification of two distinct phenotypes in Sprague-Dawley (Crl:CD(SD)) rats. Toxicol Sci. 2005;87:277–284. doi: 10.1093/toxsci/kfi214. [DOI] [PubMed] [Google Scholar]
- 30.Bridges JW, French MR, Smith RL, Williams RT. The fate of benzoic acid in various species. Biochem J. 1970;118:47–51. doi: 10.1042/bj1180047. [DOI] [PMC free article] [PubMed] [Google Scholar]
- 31.Scheider JJ. Hormonal Steroids. New York: Academic Press; 1964. [Google Scholar]
- 32.Nayyar A. Silver Nitrate: Versatile Reagent in Organic Synthesis. Synlett. 2005;19:3016–3017. [Google Scholar]
- 33.Akiyama TE, Nicol CJ, Fievet C, Staels B, Ward JM, Auwerx J, Lee SS, Gonzalez FJ, Peters JM. Peroxisome proliferator-activated receptor-alpha regulates lipid homeostasis, but is not associated with obesity: studies with congenic mouse lines. J Biol Chem. 2001;276:39088–39093. doi: 10.1074/jbc.M107073200. [DOI] [PubMed] [Google Scholar]
Associated Data
This section collects any data citations, data availability statements, or supplementary materials included in this article.