

Abstract
We have used microarray technology to identify the transcriptional targets of Rho subfamily guanosine 5′-triphosphate (GTP)ases in NIH3T3 cells. This analysis indicated that murine fibroblasts transformed by these proteins show similar transcriptomal profiles. Functional annotation of the regulated genes indicate that Rho subfamily GTPases target a wide spectrum of functions, although loci encoding proteins linked to proliferation and DNA synthesis/transcription are upregulated preferentially. Rho proteins promote four main networks of interacting proteins nucleated around E2F, c-Jun, c-Myc and p53. Of those, E2F, c-Jun and c-Myc are essential for the maintenance of cell transformation. Inhibition of Rock, one of the main Rho GTPase targets, leads to small changes in the transcriptome of Rho-transformed cells. Rock inhibition decreases c-myc gene expression without affecting the E2F and c-Jun pathways. Loss-of-function studies demonstrate that c-Myc is important for the blockage of cell-contact inhibition rather than for promoting the proliferation of Rho-transformed cells. However, c-Myc overexpression does not bypass the inhibition of cell transformation induced by Rock blockage, indicating that c-Myc is essential, but not sufficient, for Rock-dependent transformation. These results reveal the complexity of the genetic program orchestrated by the Rho subfamily and pinpoint protein networks that mediate different aspects of the malignant phenotype of Rho-transformed cells.
Keywords: Rho/Rac GTPases, microarray, proliferation, gene expression, transcription, Rock, c-Myc
Introduction
RhoA, RhoB and RhoC, the three members of the Rho subfamily present in mammals, participate in a wide number of biological processes, including the promotion of stress fibers and focal adhesions, microtubule dynamics, vesicle trafficking, cell polarity, cell cycle progression, and cytokinesis (Etienne-Manneville and Hall, 2002; Jaffe and Hall, 2005). Despite their important roles, there are still obscure areas in their biology. Given their high structural similarity, one of the questions that remain to be addressed is the level of functional overlap existing among them. In this regard, it has been shown that these three guanosine 5′-triphosphate (GTP)ases bind to similar effectors, promote comparable cytoskeletal changes and elicit similar levels of oncogenicity in tissue culture cells (Schuebel et al., 1998; Wheeler and Ridley, 2004). However, the use of rhoB-/- and rhoC-/- knockout animals has revealed that these proteins can also orchestrate specific biological programs, as RhoB favors tumor suppression activities, whereas RhoC promotes the migration and survival of metastatic cancer cells (Liu et al., 2001; Wheeler and Ridley, 2004). Likewise, it has been shown that RhoA and RhoC exert distinct actions during the invasion of breast carcinoma cells (Simpson et al., 2004). Another important question that has not been addressed is a comprehensive study of the effect of these GTPases on gene transcription at the genome-wide level. Thus, despite evidence showing that Rho subfamily proteins can activate transcriptional factors such as nuclear-factor kappa B (NF-kB), the serum response factor (SRF) or AP1 family proteins (Hill et al., 1995; Perona et al., 1997; Montaner et al., 1998, 1999; Marinissen et al., 2004; Wheeler and Ridley, 2004; Jaffe and Hall, 2005), there is only scarce information regarding the effect of Rho subfamily proteins and their main effectors in the overall cell transcriptome. Indeed, to date, there are only two microarray-based studies available using either RhoA or RhoC oncoproteins in NIH3T3 and MCF10A cells (Teramoto et al., 2003; Wu et al., 2004), respectively.
To illuminate these important issues, we decided to use microarray techniques to obtain a genome-wide view of the gene expression profiles induced by RhoA, RhoB and RhoC during the transformation of mouse fibro-blasts. In addition, we have investigated the dependency of those gene expression profiles from specific signaling routes by characterizing the subset of genes regulated by one of the main Rho effectors, the serine/threonine kinase Rock (Riento and Ridley, 2003). Our results indicate that these three GTPases promote similar changes in gene expression, differing only in the overall fold change of small groups of genes. Moreover, we have identified transcriptionally regulated protein networks that contribute to different biological aspects of the cell transformation induced by these oncoproteins.
Results
Transcriptomal changes of Rho-transformed cells
To conduct our studies, we generated NIH3T3 cells expressing the constitutively active forms (Q63L mutants) of each Rho subfamily member using focus formation assays (see Supplementary text, Section I and Supplementary Figure S1). When these cell lines and the parental NIH3T3 cells were studied using Affymetrix microarrays, we observed that the stable expression of these GTPases induced changes in approximately 8.5% (1035 genes) of all the genes probed in the arrays (Figure 1; Supplementary Figure S2 Supplementary Table S1). The initial analysis of the microarray data revealed a main group of genes (≈83.6%) commonly regulated by the three GTPases (Figure 1a) and four minority groups containing genes modulated by RhoAQ63L alone or shared by RhoAQ63L and RhoBQ63L, RhoAQ63L and RhoCQ63L, or RhoBQ63L and RhoCQ63L (Figure 1b–e). However, further examination of the microarray data indicated that the segregation of these groups was only owing to the statistical parameters used in the bioinformatic analysis and did not stand a solid scrutiny under more biological criteria (see Supplementary text, Section II for further details). These results indicate that these three Rho GTPases promote highly similar gene expression profiles in transformed fibroblasts. Analysis by quantitative reverse transcriptase–polymerase chain reaction (RT–PCR) and immunoblotting techniques confirmed the microarray data (see Supplementary text, Section III; Supplementary Table S2Supplementary Figures S3 and S4 ).
Figure 1.
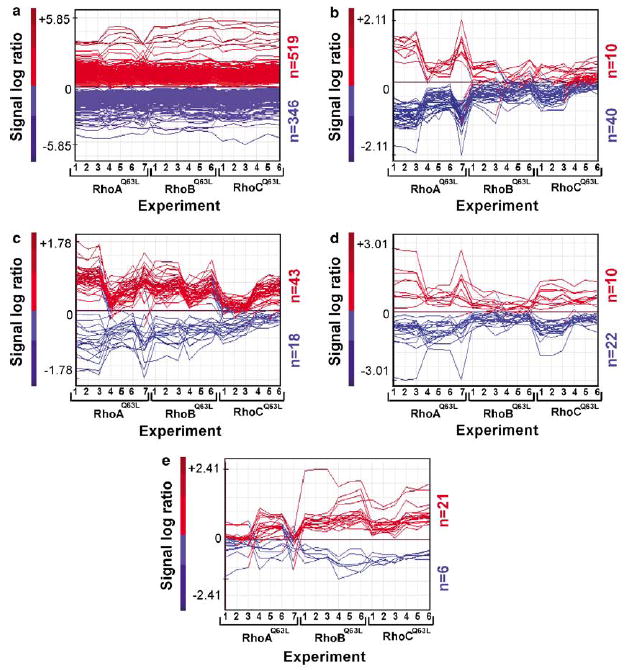
Transcriptomal changes in Rho-transformed cells. (a–e) Induced (red) and repressed (blue) genes that are regulated by the three GTPases (a), by RhoAQ63L alone (b), by RhoAQ63L and RhoBQ63L (c), by RhoAQ63L and RhoCQ63L (d) or by RhoBQ63L and RhoCQ63L (e) according to the statistical criteria. The expression values of the deregulated genes are represented as signal log ratio numbers (SLR, considering that fold change = 2SLR; y-axis) obtained in each experimental sample (x-axis). The total number of upregulated and downregulated genes is indicated on the right of each panel.
To establish an overview of the transcriptional changes induced by the transformation of Rho subfamily GTPases, we assigned the 1008 identified genes regulated by RhoAQ63L to 19 different functional groups using manual annotation procedures (Figure 2a and Supplementary Table S1). A comprehensive discussion of the genes and pathways modulated by Rho proteins can be found in the Supplementary Text(Section IV).
Figure 2.
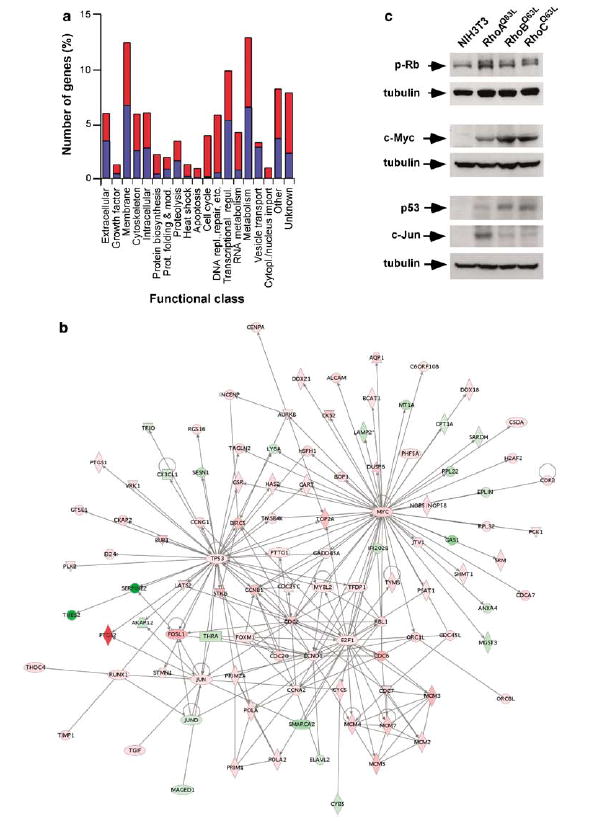
Functional annotation of Rho-regulated genes. (a) Classification of Rho-regulated genes according to general biological functions. Up- and down-regulated genes were colored in red and blue, respectively. (b) The c-Myc-, E2F1-, p53- and c-Jun-dependent networks identified using the Ingenuity database. Nodes are color-coded in red (upregulated) or green (downregulated) according to their fold change values. (c) Total cellular lysates from the indicated cell lines (top) were blotted with anti-phospho-Rb, anti-Myc, anti-p53 and anti-Jun antibodies. The same lysates were blotted with anti-tubulin antibodies to demonstrate equal loading of samples. p, phospho.
E2F, c-Myc and c-Jun are important for Rho-mediated transformation
We further characterized our microarray data using the Ingenuity program, a web-based software that identifies molecular networks by relating each gene entry with a comprehensive database of known physical, transcriptional or enzymatic interactions reported for ≈8000 mouse proteins (see Supplementary materialsonline). This analysis revealed the existence in the Rho-dependent transcriptome of four main networks nucleated around the transcriptional factors c-Myc, p53, E2F and c-Jun (Figure 2b). These results led us to investigate the importance of the c-Myc, E2F, c-Jun and p53 networks in the cell transformation induced by Rho subfamily proteins. First, we demonstrated that these transcriptional factors were indeed upregulated in Rho-transformed cells, using specific antibodies to c-Myc, p53 and c-Jun (Figure 2c) and, in the case of c-Myc and c-Jun, real-time quantitative RT–PCR (Supplementary Table S2). In addition, we monitored indirectly the activation levels of E2F by detecting the hyperpho-sphorylated version of Rb in Rho-transformed cells (Figure 2c). The implication of E2F function in Rho-mediated signaling was further demonstrated by verifying that both the stable and transient expression of RhoAQ63L promoted the activation of an E2F-dependent promoter in NIH3T3 cells (Supplementary Figure S4b). We also observed that RhoAQ63L, RhoBQ63L and RhoCQ63L-transformed cells had increased protein levels of a number of known E2F-regulated proteins (Supplementary Figure S4c). To assess the importance of the E2F pathway in RhoA transformation, we generated three stable cell clones (21-2-20, 21-3-4 and 21-3-6) co-expressing RhoAQ63L with a HA-tagged Rb protein lacking the phosphorylation sites targeted by Cdks (RbΔCDK mutant) (Figure 3a). This protein stays stably bound to E2F independently of the activation status of G1 Cyclin/Cdk complexes, and, as a consequence, acts as a dominant-negative mutant for E2F and related proteins (Leng et al., 1997). When kept in exponentially growing conditions, the three RbΔCDK-expressing cell lines displayed lower proliferation rates than the original RhoAQ63L-transformed and NIH3T3 cells (Figure 3b). However, the RbΔCDK-positive cells still displayed loss of cell-contact inhibition, as they were capable of growing to higher densities than the parental NIH3T3 cell line after reaching confluency (Figure 3b). Despite this, their proliferation rates under these conditions were still impaired when compared with cells expressing RhoAQ63L alone (Figure 3b). Finally, we assessed the transformed phenotype of the three RbΔCDK-expressing cell lines using secondary focus formation assays. As shown in Figure 3c, the three RbΔCDK-expressing cell lines were severely impaired in their transforming activity when compared with the original RhoAQ63L-expressing cell line. Taken together, these results indicate that the activation of the E2F pathway is essential for maintaining the high proliferative rates and the oncogenicity of RhoAQ63L-transformed cells.
Figure 3.
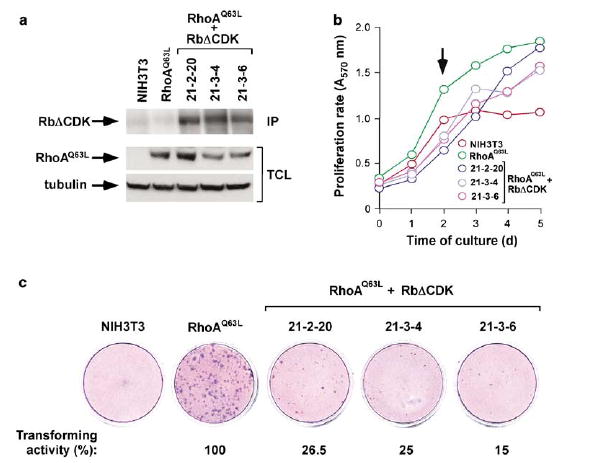
E2F function is essential for RhoAQ63L-mediated transformation. (a) Immunoblot analysis showing the expression of the ectopically expressed RhoAQ63L and RbΔCDK proteins in the cell lines under study. As control, we have included immunoblots lysates obtained from NIH3T3 and IMB11-1P cells (labeled as RhoAQ63L). For the visualization of RbΔCDK, cell lysates were immunoprecipitated (IP) with anti-HA antibodies and then blotted with the same antibody (upper panel). RhoAQ63L was detected in total cell lysates (TCL) by anti-AU5 immunobloting (middle panel). As loading control, we probed aliquots of the same total cellular extracts with anti-tubulin antibodies (lower panel). (b) Proliferation rates of the indicated cell lines. Values represent the mean of a representative experiment performed in triplicate. The arrow indicates the time point in which cells reached 100% confluency. (c) Determination of the transforming activity of NIH3T3, RhoAQ63L-transformed cells (IMB11-1P clone) and the indicated RhoAQ63L + RbΔCDK-expressing cells using secondary focus formation assays.
A similar approach was used to assess the importance of c-Myc, c-Jun and p53 in the cell transformation triggered by RhoAQ63L. Using firefly luciferase reporter assays, we demonstrated that the transient expression of RhoAQ63L promoted the effective activation of c-myc, c-Myc-dependent and AP1-based promoters (Figure 4a). In contrast, the expression of RhoAQ63L failed to promote transcription from a p53-dependent promoter, suggesting that p53 may not be a direct downstream target of RhoAQ63L, or, alternatively, that the p53 protein overexpressed in RhoAQ63L-transformed cells is inhibited in trans by other RhoAQ63L-triggered routes. In agreement with these results, focus formation assays indicated that the expression of c-Myc and c-Jun dominant-negative mutants led to a 95 and 80% inhibition of the transforming activity elicited by RhoAQ63L, respectively (Figure 4b and c). In contrast, the coexpression of a dominant-negative mutant for p53 had no impact on the oncogenic potential of this GTPase (Figure 4c). Altogether, these results indicate that the transforming activity of RhoAQ63L is highly dependent on E2F, c-Myc and c-Jun. Instead, the increased levels of p53 observed in Rho-transformed cells do not deter the development of their malignant phenotype, at least in the case of NIH3T3 cells.
Figure 4.
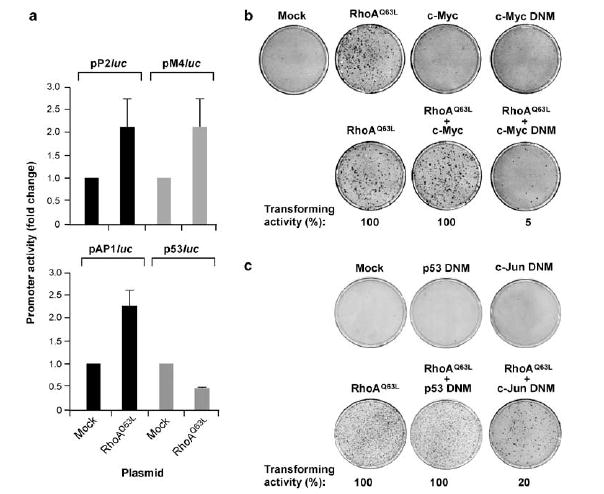
c-Myc and c-Jun, but not p53, are important for RhoAQ63L-dependent cell transformation. (a) NIH3T3 cells were transfected with the transactivation reporter plasmids (top) in the presence (RhoAQ63L) or absence (Mock) of the mammalian expression vector encoding RhoAQ63L and luciferase activities quantified as indicated in Supplementary Materials and methods . Values are expressed as fold change variations with respect to the appropriate control sample (that was given an arbitrary value of 1) and are the mean±s.d. of four independent experiments, each of them performed in triplicate. pP2luc, pM4luc, AP1luc and p53luc are reporter plasmids containing the c-myc promoter, c-Myc binding sites, AP1 binding sites and p53 binding sites, respectively. (b, c) Primary focus formation assays showing the transforming activity of RhoAQ63L when expressed alone or in combination of the indicated proteins. DNM, dominant-negative mutant.
Identification of Rock-dependent genes
We next evaluated the effect of the inhibition of Rock in the gene expression program of RhoAQ63L-expressing cells to start dissecting the contribution of specific Rho downstream pathways to the cell transcriptome. Previous studies have shown that Rock plays central roles in the signal transduction pathway of Rho subfamily proteins and in cell transformation (Riento and Ridley, 2003; Budzyn et al., 2006). To this end, we used a chemical inhibitor (Y27632) that blocks the kinase activity of Rock proteins (Uehata et al., 1997). As described previously (Sahai et al., 1999), the treatment of RhoAQ63L-transformed cells with low amounts of this drug (10 mM) led to the rapid disruption of stress fibers (Figure 5a), the dephosphorylation of the myosin light chain (MLC, Figure 5b), and the abolition of the transforming activity of these cells (Figure 5c).
Figure 5.
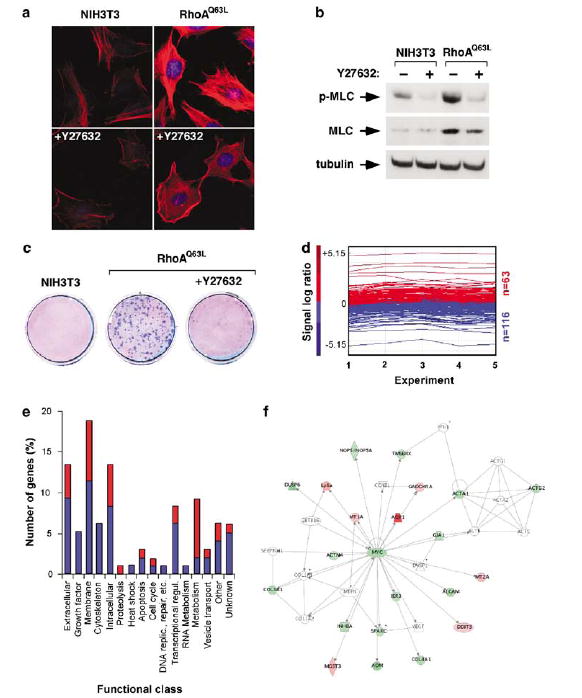
Effect of Y27632 on the transcriptome of RhoAQ63L-transformed cells. (a) Effect of Y27632 in the stress fibers of NIH3T3 (left panels) and RhoAQ63L-transformed (right panels) cells. F-actin and DAPI-stained nuclei are shown in red and blue, respectively. (b) Effect of Y27632 on MLC phosphorylation levels (upper panel). (c) Effect of Y27632 on the oncogenic activity of RhoAQ63L-transformed cells determined by secondary focus formation assays. (d) Graph showing the 179 genes induced (red) or repressed (blue) in RhoA-transformed cells after Y27632 treatment. The expression values of all deregulated genes are represented as in Figure 1. (e) Functional annotation of the 96 Y27632-dependent genes identified in the microrray analysis. (f) Identification of Y27632-regulated elements of the c-Myc-dependent network using the Ingenuity software. Nodes are color-coded as in Figure 2b.
Microarray experiments revealed that the inhibition of the Rock pathway by the Y27632 inhibitor affected the expression of 179 genes in RhoAQ63L-transformed cells (Figure 5d). These genes could be classified into four subsets depending on their expression behavior in relation to the untreated RhoAQ63L-transformed cells. A first subset of 40 genes showed a total reversion to the baseline expression levels observed in NIH3T3 cells, indicating that their changes in expression were totally dependent on Rock signaling (Supplementary Table S3). A second subset of 40 genes reversed their expression levels only partially upon Y27632 addition, and, as a consequence, did not reach the baseline levels observed in the parental cell line (Supplementary Table S4). Despite this partial reversion, immunoblot analysis evidenced that the expression of some of these genes did effectively undergo major changes upon Y27632 treatment (Supplementary Figures S5 and S6a). A third subset of Y27632-regulated genes included 16 loci whose expression was further enhanced (nine genes) or repressed (seven genes) in relation to their previous levels in RhoAQ63L-transformed cells (Supplementary Table S4). For example, the expression levels of Mrpplf3 and Plf2 increase 4- and 3.5-fold in Y27632-treated RhoA-transformed cells, reaching now expression levels similar to those found in RhoBQ63L-transformed cells (Supplementary Table S4; Supplementary Figure S5). Finally, a fourth subset of Y27632-regulated loci (82 genes, Supplementary Table S5) seemed to represent the typical xenotoxic response to drugs as they had not been detected in our previous microarray experiments (Supplementary Table S1)and, in general, were found similarly deregulated by Y27632 in the parental NIH3T3 cells (not shown). If we subtract this latter subset of genes, our results indicate that inactivation of the Rock pathway impacts on a minority (9.5%) of the previously described 1008 RhoA-dependent genes. Our microarray data were confirmed by real-time quantitative RT–PCR (Supplementary Figure S5) and immuno-blotting techniques (in the case of c-Myc and Cox2/ Ptgs2 proteins; Supplementary Figure S6a).
As shown in Figure 5e, the Y27632-dependent genes in RhoAQ63L-transformed cells are distributed in 16 functional classes, although the main functions affected are those pertaining to extracellular molecules, membrane proteins, cytoskeletal and intracellular signaling molecules, transcriptional regulation, and metabolism. The functional categories of growth factors, cytoske-leton, heat shock, DNA replication/repair, and RNA metabolism contained only repressed genes. Proteolysis-and metabolism-linked functions were the only ones displaying a higher number of induced versus down-modulated genes (Figure 5e).
c-Myc is a common target for E2F and Rock involved in loss of contact inhibition
The bioinformatics analysis of the Rock-dependent transcriptome revealed that Y27632 targets the c-Myc network (Figure 5f). This downmodulation is also observed at the proteome level, as the treatment of RhoAQ63L-transformed fibroblasts with the Rock inhibitor promotes a rapid elimination of c-Myc protein levels (Supplementary Figure S6a). However, it should be noted that c-Myc repression was not the only event responsible for Rock-mediated gene expression changes, because the blockage of c-Myc function via the expression of either a c-Myc dominant-negative mutant or a short hairpin (sh) c-myc RNA alters the transcript levels of some (i.e., alcam, lats2, plaur), but not all (i.e., tnc) of the identified Rock-dependent genes (Supplementary Figure S6b). Moreover, we observed that the inhibition of Rock and c-Myc induced opposite effects in the case of the cyr61 gene (Supplementary Figure S6b), further suggesting that Rock affects the RhoA-dependent transcriptome through both c-Myc-dependent and -independent events. In the same context, our experiments also indicated that the expression of c-Myc protein is not only maintained through the Rock pathway, because its expression is also downmodulated by the expression of the RbΔCDK protein (Supplementary Figure S6c). These results indicate that the upregulation of c-Myc in Rho-transformed cells relays on two separate Rock- and E2F-dependent incoming signals.
To investigate the role of c-Myc downmodulation in the biological effects of the Rock inhibitor, we first generated cell lines expressing RhoAQ63L in the presence of either a c-Myc dominant-negative mutant or a c-myc shRNA (Figure 6a and b). We found that the elimination of c-Myc activity using these two loss-of-function approaches resulted in only marginal effects on the proliferation of the RhoAQ63L-transformed cells (Figure 6c). However, when tested in secondary focus formation assays, these cell lines showed a strong reduction in their transforming activity (Figure 6d and e). In addition, the foci that came out in these conditions were significantly smaller than those generated by the transforming cells expressing only RhoAQ63L (Figure 6e).
Figure 6.
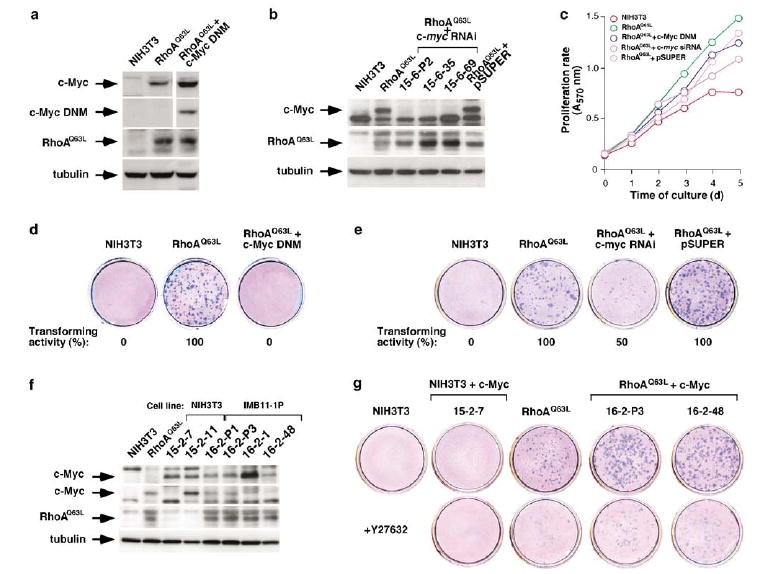
c-Myc is important for the transforming activity, but not proliferation, of RhoAQ63L-transformed cells. (a) Expression of the indicated (left) ectopic (RhoAQ63L, c-Myc DNM) or endogenous (c-Myc, tubulin) proteins in NIH3T3 cells, IMB11-1P cells (labeled as RhoAQ63L, top), and a cell line co-expressing RhoAQ63L with the c-Myc dominant-negative mutant (DNM). Proteins were visualized in total cellular extracts by immunobloting with antibodies to c-Myc (upper panels), AU5 epitope (third panel) and tubulin (bottom panel). (b) A similar assay showing the expression of the indicated proteins (left) in NIH3T3 cells, IMB11-1P cells (labeled here as RhoAQ63L, top) and IMB11-1P-derived cell clones expressing either the c-myc shRNA or the empty pSUPER.GFP/neo. Proteins were visualized in total cellular extracts by immunobloting with antibodies to c-Myc (upper panel), the AU5 epitope (middle panel) and tubulin (bottom panel). (c) Proliferation rates of cell lines expressing the indicated proteins or shRNA. Values represent the mean of a representative experiment performed in triplicate. (d and e) Secondary focus formation assays showing the transforming activity of cells expressing RhoAQ63L alone or in combination with the indicated DNMs (d and e), shRNA (e) or vector controls (pSUPER.GFP/neo) (e). (f) Expression of the indicated proteins (left) in NIH3T3- (15-2-7, 15-2-11) and IMB11-1P-derived cell lines (16-2-P1, 16-2-P3, 16-2-11, 16-2-48) constitutively expressing c-Myc. Proteins were visualized in total cellular extracts by immunobloting with anti-c-Myc antibodies to detect the exogenous (upper panel) and endogenous (second panel from top) transcriptional factor, anti-AU5 antibodies (third panel from top) and anti-tubulin antibodies (bottom panel). (g) Secondary focus formation assay with cell lines expressing the indicated proteins (top). Cells were cultured in the absence or presence ( + Y27632) of the Rock inhibitor as indicated in Materials and methods.
To verify whether the inhibition of c-Myc was the primary target that led to the inhibition of RhoAQ63L-transforming activity by Y27632, we next investigated whether the overexpression of this transcriptional factor could make the transforming activity of RhoAQ63L Y27632-independent. To this end, we generated stable cell clones expressing either c-Myc alone (clones 15-2-7, 15-2-11) or in combination with RhoAQ63L (clones 16-2-P1, 16-2-P3, 16-2-1, 16-2-48). The expression and activity of c-Myc in these clones was demonstrated by immunoblot and promoter transactivation assays, respectively (Figure 6f and Supplementary Figure S7a). We then compared the transforming nature of these cells and RhoAQ63L-transformed cells using secondary focus formation assays. In the absence of Y27632, the RhoAQ63L-transformed cells lines induced similar numbers of foci with or without the ectopic c-Myc protein (Figure 6g). However, the cell lines containing the ectopically expressed c-Myc protein produced larger foci than those expressing only RhoAQ63L (Figure 6g). This may be due to higher proliferation rates after reaching confluency, as these cells only show higher growth rates than the RhoAQ63L-expressing cells in high cell density cultures (Supplementary Figure S7b). Despite these results, Y27632 abolished the transforming activity of the lines co-expressing RhoAQ63L and c-Myc (Figure 6g), indicating that this transcriptional factor is an important, but not the unique branch used by Rock to promote the RhoAQ63L-dependent transformation of rodent fibroblasts.
Discussion
In this study, we have utilized Affymetrix microarrays to obtain a genome-wide view of the gene expression patterns induced by RhoAQ63L, RhoBQ63L and RhoCQ63L in mouse fibroblasts, of the level of signaling overlap among them, and to start dissecting the contribution of specific Rho downstream routes to their transcriptional programs. In addition to the elucidation of the genetic program of Rho subfamily members (see Supplementary text online) and the identification of three transcription-ally regulated protein networks that are crucial for their transforming activity (E2F, c-Myc, c-Jun), one of the main results of this work is the observation that the constitutively active forms of these three GTPases trigger highly similar transcriptomal programs. This was somewhat striking as these GTPases trigger different, and sometimes antagonistic biological responses in certain cell contexts (Liu et al., 2001; Simpson et al., 2004; Wheeler and Ridley, 2004; Hakem et al., 2005). This indicates that the functional specificity of these GTPases may be established outside the transcriptional program (i.e., via the posttranscriptional activation of cellular processes) or, alternatively, that it may require additional regulatory components and/or specific cell backgrounds. Further work in this area will be needed to address these possibilities. In addition, it will be important to compare the proteome and phospho-proteome of the Rho-transformed cells reported in this work to investigate the level of signaling redundancy of these three GTPases at the protein/signaling level.
Another important observation of this work is that the inhibition of the serine/threonine kinase Rock does not have any major impact in the transcriptome of RhoA-transformed cells. Most notably, the expression of most proliferation-related genes remained unchanged before and after Y27632 treatment, a result that concurs with previous observations indicating that the inhibition of Rock does not have any effect in the serum-dependent transactivation of SRF and c-Fos promoter elements in NIH3T3 cells (Sahai et al., 1999). c-Myc is a notable exception to this general lack of implication of Rock in transcriptional-related events. This transcriptional factor did undergo a rapid and drastic reduction of its mRNA and protein levels upon Y27632 treatment, an event that correlated well with the concomitant elevation of transcripts usually repressed by this transcriptional factor (GADD45a and Ddit3) (Chen et al., 1996; Barsyte-Lovejoy et al., 2004). Our data indicate, however, that the mechanism to maintain optimal expression of c-Myc in Rho-transformed cells is highly complex, as it requires the simultaneous input from E2F routes in addition to Rock signaling (Figure 7). c-Myc seems to be an essential element of the Rock pathway implicated in the modulation of cell contact inhibition, because its repression abrogates the transforming activity of RhoAQ63L-expressing cells without impairing their proliferative potential in vitro. Our results also indicate that the repression of the c-myc gene, although important, is not the only signaling event implicated in the inhibition of focus formation induced by Y27632, because the forced overexpression of this transcriptional factor in RhoAQ63L-transformed cells does not bypass the inhibitory effects of the Rock inhibitor. Based on previous results indicating that Rock promotes the phosphorylation and stabilization of c-Myc in RhoA-transformed kidney epithelial cells (Watnick et al., 2003), it can be argued that the negative results obtained with the overexpression of c-Myc in these cell lines is due to the fact that this protein becomes degraded during Y27632 treatments because of low phosphorylation levels. However, this possibility can be ruled out because we observed that the inhibition of Rock in our RhoAQ63L-transformed NIH3T3 cells triggers the phosphorylation, rather than the depho-sphorylation, of the amino acid residues T58 and S62 of c-Myc (unpublished data). Based on these results, we infer that the influence of Rock in the transforming activity of Rho subfamily proteins will be probably achieved via post-transcriptional mechanisms.
Figure 7.
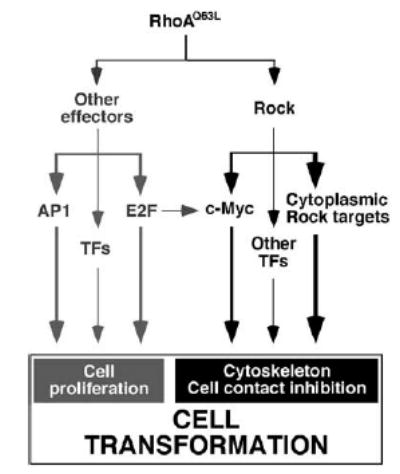
Schematic representation of the pathways activated by Rho proteins that contribute to proliferation and loss of cell contact inhibition, as inferred from the experimental data presented in this work.
In summary, these results have provided a comprehensive picture of the transcriptional events induced by Rho subfamily proteins during the oncogenic transformation of mouse fibroblasts. From this analysis, we have obtained information regarding Rho-dependent routes that impinge on crucial aspects of the biology for both normal and tumorigenic cells and, in addition, disclosed possible cross-talk that may result in either synergistic or antagonistic effects on other signaling pathways. Given that our work has been focused on NIH3T3 cells, it would be interesting to expand these studies to other cell types in the future to get an idea of the level of conservation of the transcriptional programs of these GTPases in different cell types and tissues.
Materials and methods
Generation of cell lines
To generate Rho-subfamily transformed cell lines, we followed the standard protocol for focus formation assays. 1.5 × 10⁵ NIH3T3 cells were transfected with 20 μg of high molecular weight calf thymus DNA (Roche Molecular Biochemicals, Mannheim, Germany) and 1 μg of RhoAQ63L-, RhoBQ63L-, or RhoCQ63L-encoding vectors using the calcium phosphate precipitation method (van der Eb and Graham, 1980). After 15 days of culture, foci of transformed cells were pooled and expanded to generate the cell lines used in the microarray experiments. These final transformed cell lines expressing RhoAQ63L-, RhoBQ63L- or RhoCQ63L were labeled as IMB11-1P, IMB11-2P and IMB11-3P, respectively. A similar strategy was used to generate H-RasG12V-transformed cells. For the generation of stable cell clones, IMB11-1P cells were transfected as above using 100 μg of pTKHyg and 2 μg of pECE-ΔCDK-Rb, pCEFL-MadMyc, pSUPER.GFP/neo, pSUPER-c-mycRNAsi or pCEFL-Myc. After transfection, cells were subjected to drug selection using 100 μg/ml hygromycin (BD Biosciences, San Jose, CA, USA) for 15–20 days. Isolated cell clones were picked, expanded and characterized for the expression of the ectopic proteins by immunoprecipitation and/or immunoblot analysis. Information about the denomination of all cell lines used in this study can be found in Supplementary Materials and methods(List 1) available online. All cell cultures were grown under standard temperature/CO2 conditions in a Dulbecco’s modified Eagle’s medium (DMEM) supplemented with 1% L-glutamine, 1% penicillin/streptomycin and 10% calf serum. All tissue culture reagents were obtained from Invitrogen (Carlsbad, CA, USA).
Microarray analysis and functional annotation of identified genes
In the case of the studies of the transcriptomal changes induced by RhoAQ63L, RhoBQ63L or RhoCQ63L, three 10 cm diameter plates containing exponentially growing cultures of IMB11-1P (expressing RhoAQ63L), IMB11-2P (expressing RhoBQ63L) or IMB11-3P (expressing RhoCQ63L) cells were washed with phosphate buffer saline (PBS) and their total cellular RNAs isolated using the RNeasy kit (Qiagen, Hilden, Germany) according to the supplier’s specifications. In the case of the studies aimed at identifying Rock targets, total RNAs were obtained as indicated above from exponentially growing IMB11-1P cells treated or untreated for 24 h with 10 μM ( +)-(R)-trans-4-(1-aminoethyl)-N-(4-pyridyl)cyclohexanecarboxa-mide di-hydrochloride (Y27632, Calbiochem, Darmstad, Germany). The quantity and quality of the total RNAs obtained was determined using 6000 Nano Chips (Agilent Technologies, Santa Clara, CA, USA). Total RNA samples (4 μg) were then processed for hybridization on MGU75Av2 microarrays (Affymetrix, Santa Clara, CA, USA) using standard Affymetrix protocols at the CIC Genomics and Proteomics Facility. Normalization, filtering and analysis of the raw data obtained from the microarrays was carried out with the Bioconductor software (www.bioconductor.com) using de ReadAffy package and the robust-multi-array analysis (RMA) application. The RMA algorithm was selected over the standard Affymetrix software because it provides a better precision in signal detection to achieve adequate normalization of multiple microarray hybridizations, especially in cases of low levels of gene expression (Bolstad et al., 2004; Gautier et al., 2004; Gentleman et al., 2004; Parrish and Spencer, 2004). We considered a gene to be differentially expressed when exhibiting a signal ≥100 and met the following criteria: in the case of the characterization of the transcriptome of Rho-transformed cells (Figure 1), we regarded a gene as common to all GTPases when: (i) It showed a fold change ≥ ±1.5 in at least two of the cell lines used; (ii) the fold change in the third cell line was ≥ ±1.0 and displayed a similar variation trend when compared with the other two cell lines (i.e., similar upregulation or downmodulation in the three cell lines); (iii) the fold change values in the three cell lines always had P-values ≤0.01. We regarded a gene as common to only two GTPases when: (i) It showed a fold change ≥ ±1.5 in two the cell lines with P-values p0.01; (ii) the fold change in the third cell line was non-existent or, alternatively, had P-values ≤0.01. We considered a gene as uniquely regulated by a GTPase when: (i) the fold change in the expression levels of is transcript in the cell line transformed by that GTPase was ≥ ±1.5 with P-value ≤0.01; (ii) the fold change, if any, obtained in the other cell lines had P-values ≥0.01. In the case of the experiments involving the Y27632 inhibitor (Figure 5), we considered a gene as a target of the Rock inhibitor when its fold change with respect to the levels of expression of untreated RhoAQ63L-transformed cells was ≥±1.5 and with P-values ≤0.01. Statistical analyses were performed using F-statistics.
For the graphical presentation of microarray data, we performed hierarchical clustering analysis using the WPGA average linkage and the standard correlation similarity metric method with the J-Express application (version 2.1). Functional annotation of gene functions was performed manually using internet-available databases such as those maintained by the NCBI (www.ncbi.nlm.nih.gov/entrez/query.fc gi?db = OMIM) and the Weizman Institute of Science (Rehovot, Israel; www.genecards.org). The identification of interactive networks of proteins was done using the Ingenuity Pathways Analysis program, a web-delivered application that enables discovery, visualization and exploration of biological interaction networks (www.ingenuity.com) (Calvano et al., 2005). In this case, we considered a network as significant when it fulfilled the following criteria: (i) to have a minimal score of 15; (ii) to have at least 20 proteins participating in direct functional interactions inside the network.
Treatment of cells with the Rock inhibitor
To measure the effect of Y27632 in intracellular pathways (F-actin cytoskeleton, MLC phosphorylation), exponentially growing cells were treated for the indicated periods of time with 10 μM Y27632 and then processed for immunofluorescence or immunoblotting as indicated in Supplementary Information. To measure the effect of Y27632 in cell transformation, cell cultures were processed for secondary focus formation assays and, after reaching subconfluency, were either left untreated or treated with 10 μM Y27632 until the final foci staining. The inhibitor was replaced daily to ensure an effective inhibition of the kinase activity of endogenous Rock.
Additional information regarding the Materials and methods used in this work can be found in the Supplementary Informationavailable online.
Supplementary Material
Supplementary Information accompanies the paper on the Oncogene website (http://www.nature.com/onc).
Acknowledgments
This work was supported by grants from the Ramón Areces Foundation, the NCI/NIH (5RO1-CA73735-10) and the Spanish Ministry of Education and Science Special Action on Genomics and Proteomics (GEN2003-20239-C06-01). IMB was supported by a Spanish Ministry of Education and Science FPU fellowship (FP2000-6489). FN was partially supported by a Ernst Schering Foundation fellowship. The genomic data of this work are deposited in the NCBI Gene Expression Omnibus database (Accession number: GSE5913).
References
- Barsyte-Lovejoy D, Mao DY, Penn LZ. c-Myc represses the proximal promoters of GADD45a and GADD153 by a post-RNA polymerase II recruitment mechanism. Oncogene. 2004;23:3481–3486. doi: 10.1038/sj.onc.1207487. [DOI] [PubMed] [Google Scholar]
- Bolstad BM, Collin F, Simpson KM, Irizarry RA, Speed TP. Experimental design and low-level analysis of microarray data. Int Rev Neurobiol. 2004;60:25–58. doi: 10.1016/S0074-7742(04)60002-X. [DOI] [PubMed] [Google Scholar]
- Budzyn K, Marley PD, Sobey CG. Targeting Rho and Rho-kinase in the treatment of cardiovascular disease. Trends Pharmacol Sci. 2006;27:97–104. doi: 10.1016/j.tips.2005.12.002. [DOI] [PubMed] [Google Scholar]
- Calvano SE, Xiao W, Richards DR, Felciano RM, Baker HV, Cho RJ, et al. A network-based analysis of systemic inflammation in humans. Nature. 2005;437:1032–1037. doi: 10.1038/nature03985. [DOI] [PubMed] [Google Scholar]
- Chen C, Nussenzweig A, Guo M, Kim D, Li GC, Ling CC. Down-regulation of gadd153 by c-myc in rat fibroblasts and its effect on cell growth and radiation-induced apoptosis. Oncogene. 1996;13:1659–1665. [PubMed] [Google Scholar]
- Etienne-Manneville S, Hall A. Rho GTPases in cell biology. Nature. 2002;420:629–635. doi: 10.1038/nature01148. [DOI] [PubMed] [Google Scholar]
- Gautier L, Cope L, Bolstad BM, Irizarry RA. affy–analysis of affymetrix genechip data at the probe level. Bioinformatics. 2004;20:307–315. doi: 10.1093/bioinformatics/btg405. [DOI] [PubMed] [Google Scholar]
- Gentleman RC, Carey VJ, Bates DM, Bolstad B, Dettling M, Dudoit S, et al. Bioconductor: open software development for computational biology and bioinformatics. Genome Biol. 2004;5:R80. doi: 10.1186/gb-2004-5-10-r80. [DOI] [PMC free article] [PubMed] [Google Scholar]
- Hakem A, Sanchez-Sweatman O, You-Ten A, Duncan G, Wakeham A, Khokha R, et al. RhoC is dispensable for embryogenesis and tumor initiation but essential for metastasis. Genes Dev. 2005;19:1974–1979. doi: 10.1101/gad.1310805. [DOI] [PMC free article] [PubMed] [Google Scholar]
- Hill CS, Wynne J, Treisman R. The Rho family GTPases RhoA, Rac1, and CDC42Hs regulate transcriptional activation by SRF. Cell. 1995;81:1159–1170. doi: 10.1016/s0092-8674(05)80020-0. [DOI] [PubMed] [Google Scholar]
- Jaffe AB, Hall A. Rho GTPases: biochemistry and biology. Annu Rev Cell Dev Biol. 2005;21:247–269. doi: 10.1146/annurev.cellbio.21.020604.150721. [DOI] [PubMed] [Google Scholar]
- Leng X, Connell-Crowley L, Goodrich D, Harper JW. S-Phase entry upon ectopic expression of G1 cyclin-dependent kinases in the absence of retinoblastoma protein phosphorylation. Curr Biol. 1997;7:709–712. doi: 10.1016/s0960-9822(06)00301-0. [DOI] [PubMed] [Google Scholar]
- Liu AX, Rane N, Liu JP, Prendergast GC. RhoB is dispensable for mouse development, but it modifies susceptibility to tumor formation as well as cell adhesion and growth factor signaling in transformed cells. Mol Cell Biol. 2001;21:6906–6912. doi: 10.1128/MCB.21.20.6906-6912.2001. [DOI] [PMC free article] [PubMed] [Google Scholar]
- Marinissen MJ, Chiariello M, Tanos T, Bernard O, Narumiya S, Gutkind JS. The small GTP-binding protein RhoA regulates c-jun by a ROCK-JNK signaling axis. Mol Cell. 2004;14:29–41. doi: 10.1016/s1097-2765(04)00153-4. [DOI] [PubMed] [Google Scholar]
- Montaner S, Perona R, Saniger L, Lacal JC. Multiple signalling pathways lead to the activation of the nuclear factor kappaB by the Rho family of GTPases. J Biol Chem. 1998;273:12779–12785. doi: 10.1074/jbc.273.21.12779. [DOI] [PubMed] [Google Scholar]
- Montaner S, Perona R, Saniger L, Lacal JC. Activation of serum response factor by RhoA is mediated by the nuclear factor-kappaB and C/EBP transcription factors. J Biol Chem. 1999;274:8506–8515. doi: 10.1074/jbc.274.13.8506. [DOI] [PubMed] [Google Scholar]
- Parrish RS, Spencer HJ., III Effect of normalization on significance testing for oligonucleotide microarrays. J Biopharm Stat. 2004;14:575–589. doi: 10.1081/BIP-200025650. [DOI] [PubMed] [Google Scholar]
- Perona R, Montaner S, Saniger L, Sanchez-Perez I, Bravo R, Lacal JC. Activation of the nuclear factor-kappaB by Rho, CDC42, and Rac-1 proteins. Genes Dev. 1997;11:463–475. doi: 10.1101/gad.11.4.463. [DOI] [PubMed] [Google Scholar]
- Riento K, Ridley AJ. Rocks: multifunctional kinases in cell behaviour. Nat Rev Cell Biol. 2003;4:446–456. doi: 10.1038/nrm1128. [DOI] [PubMed] [Google Scholar]
- Sahai E, Ishizaki T, Narumiya S, Treisman R. Transformation mediated by RhoA requires activity of ROCK kinases. Curr Biol. 1999;9:136–145. doi: 10.1016/s0960-9822(99)80067-0. [DOI] [PubMed] [Google Scholar]
- Schuebel KE, Movilla N, Rosa JL, Bustelo XR. Phosphorylation-dependent and constitutive activation of Rho proteins by wild-type and oncogenic Vav-2. EMBO J. 1998;17:6608–6621. doi: 10.1093/emboj/17.22.6608. [DOI] [PMC free article] [PubMed] [Google Scholar]
- Simpson KJ, Dugan AS, Mercurio AM. Functional analysis of the contribution of RhoA and RhoC GTPases to invasive breast carcinoma. Cancer Res. 2004;64:8694–8701. doi: 10.1158/0008-5472.CAN-04-2247. [DOI] [PubMed] [Google Scholar]
- Teramoto H, Malek RL, Behbahani B, Castellone MD, Lee NH, Gutkind JS. Identification of H-Ras, RhoA, Rac1 and Cdc42 responsive genes. Oncogene. 2003;22:2689–2697. doi: 10.1038/sj.onc.1206364. [DOI] [PubMed] [Google Scholar]
- Uehata M, Ishizaki T, Satoh H, Ono T, Kawahara T, Morishita T, et al. Calcium sensitization of smooth muscle mediated by a Rho-associated protein kinase in hypertension. Nature. 1997;389:990–994. doi: 10.1038/40187. [DOI] [PubMed] [Google Scholar]
- van der Eb AJ, Graham FL. Assay of transforming activity of tumor virus DNA. Methods Enzymol. 1980;65:826–839. doi: 10.1016/s0076-6879(80)65077-0. [DOI] [PubMed] [Google Scholar]
- Watnick RS, Cheng YN, Rangarajan A, Ince TA, Weinberg RA. Ras modulates Myc activity to repress thrombospondin-1 expression and increase tumor angiogenesis. Cancer Cell. 2003;3:219–231. doi: 10.1016/s1535-6108(03)00030-8. [DOI] [PubMed] [Google Scholar]
- Wheeler AP, Ridley AJ. Why three Rho proteins? RhoA, RhoB, RhoC, and cell motility. Exp Cell Res. 2004;301:43–49. doi: 10.1016/j.yexcr.2004.08.012. [DOI] [PubMed] [Google Scholar]
- Wu M, Wu ZF, Kumar-Sinha C, Chinnaiyan A, Merajver SD. RhoC induces differential expression of genes involved in invasion and metastasis in MCF10A breast cells. Breast Cancer Res Treat. 2004;84:3–12. doi: 10.1023/B:BREA.0000018426.76893.21. [DOI] [PubMed] [Google Scholar]
Associated Data
This section collects any data citations, data availability statements, or supplementary materials included in this article.
Supplementary Materials
Supplementary Information accompanies the paper on the Oncogene website (http://www.nature.com/onc).