

Abstract
Insulin regulates apoB metabolism via activation of PI3K or regulation of MTP via MAPK/ERK signalling. SHP-2 enhances both pathways through increased IRS-1 phosphorylation. We hypothesized that variants in the SHP-2 gene PTPN11 and PI3K p85alpha subunit gene PIK3R1 may influence fasting levels of plasma apoB and/or LDL cholesterol. We tested association of tagging SNPs (tSNPs) in each gene with serum lipids in a large sample of unselected population-based Caucasian female twins (n=2771, mean age 47.4±12.5 years) and then tested interaction between tSNPs in determining apoB and LDL levels. PTPN11 tSNP rs11066322 was associated with apoB (P=0.007) and rs11066320 was associated with LDL cholesterol (P=0.016). PIK3R1 tSNP rs251406 was associated with apoB (P=0.0003) and rs706713 was associated with LDL cholesterol (P=0.009). PTPN11 tSNP rs11066322 interacted with PIK3R1 tSNP rs251406 in determining serum apoB levels (P=0.012) and with PIK3R1 tSNP rs40318 in determining LDL cholesterol levels (P=0.009). Association of single tSNPs with both apoB and LDL cholesterol as well as interactions between the two genes suggest that variants influencing SHP-2 activity may modulate the acute pathway by which insulin regulates these lipids.
Keywords: SHP-2, PI3-kinase, apoB, LDL-cholesterol, metabolic syndrome, genetic susceptibility
1. Introduction
Individuals with type 2 diabetes are subject to increased risk of cardiovascular abnormalities associated with an increased level of plasma apoB-containing lipoproteins [1,2] caused, at least in part, by an increased hepatic output of VLDL-cholesterol [3-5]. Treatment of type 2 diabetes is principally concerned with improving glycemic control but of significant importance is the treatment of associated dyslipidemias. There is evidence to suggest that insulin regulates apoB lipoprotein metabolism via two pathways [2, 6-8]. Acute control is by activation and subsequent localization of phosphoinositol 3-kinase (PI3K) to the endoplasmatic reticulum, where intracellular degradation of nascent apoB inhibits the secretion of apoB-containing lipoprotein particles [8,9]. Adaptive or longer term control involves regulation of microsomal triglyceride transfer protein (MTP) gene transcription. Upregulation of MTP by insulin results in a higher rate of intracellular degradation and reduction in apoB secretion [6]. Elevated levels of apoB associated with insulin resistance/type 2 diabetes are the result of down-regulation of MTP, with Raf-1/MEK/ERK (mitogen-activated protein kinase /extracellular signal-regulated kinase kinase (MEK)/extracellular signal-regulated kinase (ERK)) acting as the signalling pathway between insulin receptor and gene transcription [10].
Src homology protein-2 (SHP-2) is a widely expressed non-receptor protein tyrosine phosphatase that contains two N-terminal SH2 domains, a C-terminal catalytic domain and a C-terminal segment containing two tyrosyl phosphorylation sites [11]. Over-expression of SHP-2 enhances the insulin-stimulated activities of both MAPK/ERK and PI3K through increased IRS-1 phosphorylation [12-14]. Introduction of a dominant negative mutant [12] or a catalytically inactive mutant of SHP-2 [15] has been shown to attenuate MAPK/ERK activation by insulin. Hence SHP-2 activity seems to positively regulate both acute (PI3K-mediated) and adaptive (ERK-MTP mediated) control of apoB secretion by insulin. We hypothesized that variants in the SHP-2 gene PTPN11 and PI3K p85alpha regulatory subunit gene PIK3R1 may influence levels of plasma apoB and/or apoB-containing lipoprotein LDL cholesterol, without effect on apoA1, HDL-cholesterol or triglycerides. In both genes we have employed tagging SNPs (tSNPs) to test associations with serum lipids in a large sample of unselected Caucasian female twins (n=2771, mean age 47.4±12.5 years). We then tested interaction between PTPN11 and PIK3R1 tSNPs in determining apoB and LDL levels. Tagging SNPs effectively capture information of most common variants by taking into account patterns of linkage disequilibrium (LD) across the gene [16,17]. No population studies have previously examined variation in PTPN11 with respect to the serum lipoprotein profile and there are no reported associations of PIK3R1 SNPs with apoB.
2. Materials and Methods
2.1. Subjects
The Twins UK Registry comprises unselected, mostly female volunteers ascertained from the general population through national media campaigns in the UK [18]. Means and ranges of quantitative phenotypes in Twins UK are similar to an age-matched sample of the UK female population [19]. Informed consent was obtained from all participants before they entered the studies, which were approved by the local research ethics committee. The study cohort comprised 2455 subjects (754 MZ, 1701 DZ) with available leptin data. The number of individuals in the study with data on other phenotypic variables is shown in Table 1. Information on all twins was used in association analyses (see Statistical analysis below). Thirteen subjects using lipid lowering agents were excluded for the analysis of lipid profiles.
Table 1.
Characteristics of subjects
| n | Mean ± SD | |
|---|---|---|
| Variable | ||
| Age, years* | 2768 | 47.4±12.6 |
| Postmenopausal, % | 2445 | 47.6 |
| BMI, kg/m2 | 2752 | 24.8±4.4 |
| Lipid profile: | ||
| Total cholesterol, mmol/l | 2592 | 5.56±1.25 |
| LDL cholesterol, mmol/l | 2451 | 3.46±1.15 |
| HDL cholesterol, mmol/l | 2601 | 1.55±0.39 |
| Triglyceride, mmol/l | 2481 | 1.27±0.80 |
| ApoA1, g/l | 2428 | 1.70±0.34 |
| ApoB, g/l | 2446 | 1.17±0.36 |
Number of subjects (844 MZ, 1924 DZ) with lipid data and genotype data on at least 1 SNP
2.2. Zygosity, body composition and biochemical analyses
Zygosity in the Twins UK sample was determined by standardised questionnaire and confirmed by DNA fingerprinting. Blood sample collection for determination of fasting lipids was drawn from most subjects after a minimum 8-h overnight fast. Serum was stored at −45 °C until analyzed using a Cobas Fara machine (Roche Diagnostics, Lewes, UK) [20]. A colourimetric enzymatic method was used to determine total cholesterol, triglycerides and HDL cholesterol levels. The latter was measured after precipitation from chylomicron, LDL and VLDL particles by magnesium and dextran sulphate. Apolipoproteins A1 and B were assayed by an immunoturbidometric method. The Friedewald equation [21] was used to calculate LDL cholesterol levels in subjects with triglycerides ≤ 4·52 mmol.L−1.
2.3. Genotyping for SNP validation and tSNP selection
The PTPN11 gene spans over 90 kb and contains 16 exons. Ten polymorphic SNPs with MAF >0.05 in the gene are listed on the HapMap database (HapMap Data Rel#20/phase II Jan 2006; http://www.hapmap.org). Genotypes were downloaded from HapMap CEU 30 parent-offspring trio data. Tagging SNPs were selected using the approaches of Stram et al. [17] and Chapman et al. [16] as described previously [22]. The main difference is that the former i.e., tagsnps [17], is based on prediction of extended haplotypes from the marker haplotypes (RH 2), while the latter i.e., htSNP2 [16], is based on prediction of single SNP loci (RL2) with the criterion of RL2 >= 0.80. Three tSNPs (rs2301756, rs11066320 and rs11066322) were selected using htSNP2 [16] and tagsnps [17]. The PIK3R1 gene spans over 76 kb and contains 15 exons. Information from the HapMap for PIK3R1 was not available at the time of SNP selection. We used the NCBI http://www.ncbi.nlm.nih.gov/SNP/ and CHIP Bioinformatics http://www.snpperchip.org databases to choose SNPs for validation and tSNP selection in our cohort. Thirteen SNPs validated in the database populations were genotyped in 94 unrelated subjects from the Twins UK cohort for tSNP selection. Among these, 4 SNPs were not polymorphic in 94 subjects. Eight tSNPs were selected to represent the nine remaining SNPs using htSNP2 software, with the criterion of RL2 >= 0.80 [16]: rs706713, rs7713645, rs7709243, rs251406, rs40318, rs1550805, rs831125 and rs3730089. All except rs706713 (Tyr73Tyr in exon 1) and rs3730089 (Met326Ile in exon 6) were located in non-coding regions. Primers and PCR conditions used in PIK3R1 SNP validation are given in supplemental Table I. The positions of the SNPs validated in each gene and tSNPs genotyped in the whole cohort are shown in Fig. 1.
Fig. 1.
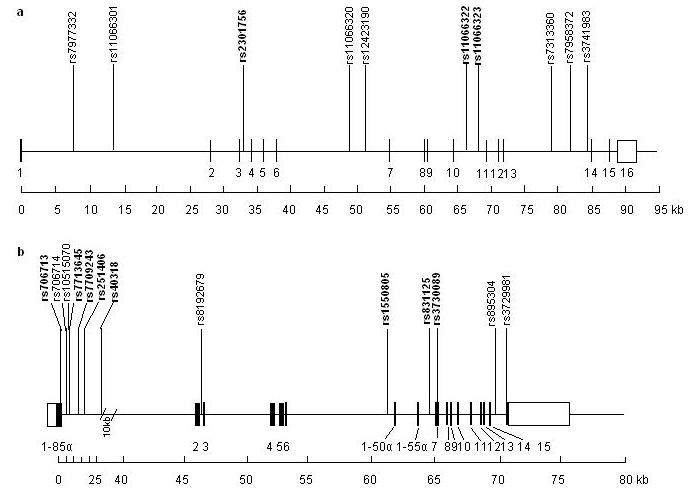
Genomic maps of PTPN11 and PIK3R1 genes
Locations of the validated SNPs are shown. tSNPs genotyped in the full cohorts are indicated in bold. Boxes represent exons. Solid boxes represent translated regions and open boxes represent untranslated regions.
2.4. Genotyping in cohorts
The tSNPs were genotyped by Pyrosequencing, (Biotage, Uppsala, Sweden). Genotyping accuracy as assessed by inclusion of duplicates (pairs of monozygotic twins) in the arrays was 98% and negative controls (water blanks) were included on each plate. Primers and PCR conditions for SNP genotyping in the full cohort by Pyrosequencing are given in supplemental Table II.
2.5. Statistical analyses
For related individuals, conventional statistical analyses lead to inflated significance. Dependency of the observations within pairs was accounted for by use of the Generalized Estimating Equations (GEE) procedure [23] in which both monozygous (MZ) and dizygous (DZ) twins can be used in tests of association. The approach accounts for dependency of the observations within pairs and yields unbiased standard errors and P-values. Association analyses in the full cohort included both twin subjects from each pair. Analyses were done separately for each of the SNPs and followed up by haplotype analyses. For individual SNP association analyses, we first performed a 2-df overall test of genotypic association. Additive, dominant and recessive models (all 1-df) were further tested to find the best mode of inheritance. To control for population stratification, DZ twin pairs discordant for genotype were also used in sib-TDT association analysis to confirm the results of regular association tests, as described elsewhere [22].
In adjusting the P-value to account for multiple testing we follow the recommendations of van den Oord and Sullivan [24]. The adjustment depends on p0, the number of markers for which there is no true effect (i.e., the null hypothesis is true), which is generally unknown in candidate gene studies. Van den Oord and Sullivan [24] show for a range of plausible p0 values for candidate gene studies that a significance level of P=0.01 will on average control the false discovery rate at 0.10 rate (i.e. the generation of false positives) at 10% [24]. Lower false discovery rates generally resulted in sharp increases in sample size, i.e., loss of power. Thus, the significance level of this study was pragmatically taken as P<0.01.
Age, BMI and menopausal status were included as covariates in the models. Details of our approach to test the association of statistically inferred haplotypes with continuous traits have been described previously [25, 26]. The probabilities of haplotype pairs were estimated by PHASE 2.0 software [27]. Serum lipids were total-, LDL- and HDL-cholesterol, triglycerides and apolipoproteins A1 and B. Individual SNP and haplotype association analyses were performed using STATA 8 (StataCorp, College Station, Texas). Where needed, phenotypic variables were log transformed to obtain better approximations of the normal distribution prior to analysis. Hardy-Weinberg equilibrium was tested by a χ2 test with 1 df in one twin of each pair chosen at random to prevent inflated significance. Pairwise LD coefficients in the tSNP test sample were calculated using GOLD and reported as D' and r2 [28].
3. Results
3.1. Association of PTPN11 genotype with serum apoB and LDL cholesterol
The 10 SNPs in the PTPN11 gene listed at minor allele frequency (MAF) >0.05 on HapMap were located in non-coding regions. The SNPs showed strong pairwise LD (supplemental Table III) allowing selection of tSNPs. Based on genotype data downloaded from 30 CEU trios from the HapMap database, we selected three (rs2301756, rs11066320 and rs11066322) using htSNP2 [16] and tagsnps [17]. This set of tSNPs accurately predicted both common haplotypes and unmeasured loci. The minimum value for both RH2 and RL2 was 0.92. These tSNPs cover all common SNPs (MAF >0.05) on the current HapMap database with RL2 > 92% [16].
The genotype and allele distributions of the 3 tSNPs in the whole cohort based on one MZ and both dizygous (DZ) twins genotyped for each pair are shown in supplemental Table IV. The genotype frequencies of rs2301756 and rs11066322 were consistent with Hardy-Weinberg proportions, but those of rs11066320 deviated from those expected (P=0.002). For this SNP, five random arrays (480 samples) were genotyped once more by pyrosequencing and one of these arrays was also genotyped by restriction digest. Both methods confirmed original genotype calls, ruling out genotyping error as the cause of deviation from HWE. Genotyping success rates were as follows: rs2301756 91.9%, rs11066320 89.5%, rs11066322 85.8%.
Table 2 presents the results of individual SNP association analyses of PTPN11 tSNPs using GEE and s-TDT. One SNP, rs11066322 was significantly associated with apoB (P=0.007) explaining 0.38% of variance. SNP rs11066320 was not associated with apoB, but showed a marginally significant association with LDL (P=0.016), explaining 0.18% of variance, which was confirmed in sib-TDT (P=0.006). Although the associations with PTPN11 genotypes are significant, this represents a minor contribution to total variance. Carriage of 2 copies of the rs11066322 rare allele increased apoB levels by 6.0% and 2 copies of the rs11066320 rare allele lowered LDL-cholesterol by 2.6%, compared to common allele homozygotes. There were no significant associations (P<0.01) with any of the other lipids examined (data not shown). However, mean serum triglyceride levels, which predominantly reflect triglyceride content of apoB48 and apoB100 triglyceride-rich lipoproteins, increased from 1.26 mmol/L (rs11066322 genotype 11) to 1.47 mmol/L (genotype 22). Although levels did not alter significantly (P>0.01), there was nevertheless a trend for carriage of the minor allele to be associated with higher serum triglyceride, parallel to the significant change in apoB. Associations with haplotypes of rs2301756-rs11066320- rs11066322 were not significant at the P<0.01 level (data not shown).
Table 2.
Association of PTPN11 tSNPs with serum lipids
| GEE |
s-TDT |
|||||||||
|---|---|---|---|---|---|---|---|---|---|---|
| Number |
Mean ± SD |
|||||||||
| tSNP | Variables | 11/12/22 | 11 | 12 | 22 | Genetic model | P* | Var. (%) | Pairs | P* |
| rs11066322 | Total cholesterol, mmol/l | 1585/589/50 | 5.56(1.24) | 5.59(1.25) | 5.71(1.31) | … | NS | NS | 366 | NS |
| LDL cholesterol, mmol/l | 1489/573/43 | 3.45(1.13) | 3.48(1.17) | 3.65(1.21) | … | NS | NS | 350 | NS | |
| ApoB, g/l | 1497/551/44 | 1.16(0.36) | 1.19(0.35) | 1.23(0.31) | Additive | 0.007 | 0.38 | 344 | NS | |
| rs11066320 | Total cholesterol, mmol/l | 786/1220/333 | 5.58(1.26) | 5.58(1.24) | 5.48(1.19) | Recessive | NS | NS | 566 | 0.001 |
| LDL cholesterol, mmol/l | 738/1149/316 | 3.49(1.15) | 3.47(1.14) | 3.38(1.09) | Dominant | 0.016 | 0.18 | 538 | 0.006 | |
| ApoB, g/l | 723/1162/320 | 1.17(0.36) | 1.17(0.36) | 1.16(0.35) | … | NS | NS | 544 | NS | |
Effects of age, BMI and menopause status were adjusted.
3.2. Association of PIK3R1 genotype with serum apoB and LDL cholesterol
To investigate interaction between PTPN11 and PIK3R1 in determination of apoB and LDL cholesterol levels, we selected tagging SNPs in the PIK3R1 gene and tested genotypephenotype associations in 2778 subjects from the Twins UK cohort. These were followed by tests of interaction between PTPN11 and PIK3R1 SNPs in relation to levels of these lipids, based on all subjects for whom we had complete genotype data. The MAFs and the pairwise D' and r2 of the 9 PIK3R1 SNPs found to be polymorphic in 94 subjects are shown in supplemental Table III. All the SNPs had MAFs >0.05 and strong LD was observed among rs706713, rs706714, rs7713645 and rs7709243 (D'>0.8 and Ps<0.05). However, except for rs706713 and rs706714 (r2=0.878), low r2 values were found throughout the gene indicating that in this case, tagging would not increase efficiency. Accordingly, 8 tSNPs were selected to represent these 9 SNPs with the criterion of RL2 >= 0.80.
The genotype and allele distributions of the 8 tSNPs in the whole cohort based on one monozygous (MZ) and both DZ twins genotyped for each pair are shown in supplemental Table IV. The genotype frequencies were consistent with Hardy-Weinberg proportions, with the exception of rs40318 (P=0.008). Five arrays were genotyped once more by pyrosequencing, with 97.4% correspondence between comparable samples. We therefore ruled out deviation from HWE due to genotyping error. Genotyping success rates were as follows: rs706713 80.3%, rs7713645 86.2%, rs7709243 93.5%, rs251406 90.5%, rs40318 89.6%, rs831125 88.5%, rs1550805 86.5%, rs3730089 89.6%.
Table 3 presents only the significant single PI3KR1 SNP associations (P<0.01). One SNP, rs251406 was significantly associated with apoB in the full cohort (P=0.0003), explaining 0.59% of variance, and also with total cholesterol (P=0.002, 0.41% of variance). However, neither association was significant in the s-TDT. One SNP, rs706713, was significantly associated with LDL cholesterol (P=0.009), explaining 0.32% of variance. Its association with apoB did not reach significance when analysed by GEE but appeared stronger in the s-TDT analysis (P=0.01). Although the associations with PIK3R1 genotypes are significant, this represents a minor contribution to total variance. Even so, carriage of 2 copies of the rs251406 rare allele increased apoB levels by 7.8% and total cholesterol by 4.9%. Two copies of the rs706713 rare allele lowered apoB by 7.7% and LDL-cholesterol by 11.1%, compared to common allele homozygotes.
Table 3.
Association of PIK3R1 tSNPs with serum lipids
| GEE |
s-TDT |
|||||||||
|---|---|---|---|---|---|---|---|---|---|---|
| Number |
Mean (± SD) |
|||||||||
| tSNP | Variables | 11/12/22 | 11 | 12 | 22 | Genetic model | P* | Var. (%) | Pairs | P* |
| rs706713 | Total cholesterol, mmol/l | 1332/784/127 | 5.61(1.25) | 5.52(1.28) | 5.21(1.10) | … | NS | … | 420 | NS |
| LDL cholesterol, mmol/l | 1261/735/120 | 3.52 (1.15) | 3.40(1.19) | 3.13(0.99) | Additive | 0.009 | 0.32 | 400 | NS | |
| ApoB, g/l | 1251/733/118 | 1.17(0.36) | 1.18(0.38) | 1.08(0.33) | Additive | NS | NS | 398 | 0.01 | |
| rs251406 | Total cholesterol, mmol/l | 1178/991/182 | 5.51(1.25) | 5.62(1.23) | 5.76(1.33) | Additive | 0.002 | 0.41 | 492 | NS |
| LDL cholesterol, mmol/l | 1115/938/175 | 3.42 (1.14) | 3.49(1.17) | 3.59(1.16) | … | NS | … | 468 | NS | |
| ApoB, g/l | 1112/949/177 | 1.15 (0.34) | 1.20(0.37) | 1.24(0.37) | Additive | 0.0003 | 0.59 | 478 | 0.025 | |
Effects of age, BMI and menopause status were adjusted.
The low LD across PIK3R1 gene resulted in 24 haplotypes with frequency >1% and only 5 of them had frequencies >=5 %. Based on simulations, Lake et al. [30] suggest that haplotype frequencies need to be at least 5% to avoid biased regression parameters. As these five haplotypes only cover 50% of the haplotype diversity, haplotype analyses based on the 8 tSNPs would have been uninformative and difficult to interpret, so were not attempted.
3.3. Interaction between PTPN11 and PIK3R1 in determining serum apoB and LDL cholesterol levels
Figs. 2a and 2b show interactions between PTPN11 tSNP rs11066322 and PIK3R1 tSNP rs251406 in determining serum apoB levels, based on a sample size of 1618. Fig. 2b shows that interaction based on a dominant model for PTPN11 rs11066322 influences apoB level (P=0.012). The PTPN11 genotype group 11 has lower apoB values than the 12 + 22 genotype group except when the PIK3R1 genotype is 22 and the pattern is reversed. Thus, apoB levels are determined by the specific combination of PTPN11 and PIK3R1 genotypes, with individuals carrying both PTPN11 genotype 11 and PIK3R1 genotype 22 showing the highest apoB levels. The main effects of both SNPs were highly significant, as shown in Tables 2 and 3.
Fig. 2.

- PTPN11 (rs11066322, additive) and PIK3R1 (rs251456, additive) influences apoB level.
- PTPN11 (rs11066322, dominant) and PIK3R1 (rs251456, additive) influences apoB level. Sample size in (a) and (b) was 1618.
- PTPN11 (rs11066322, additive) and PIK3R1 (rs40318, additive) influences LDL-cholesterol level.
- PTPN11 (rs11066322, dominant) and PIK3R1 (rs40318, additive) influences LDL-cholesterol level. Sample size in (c) and (d) was 1656.
Figs. 2c and 2d show interactions between PTPN11 tSNP rs11066322 and PIK3R1 tSNP rs40318 in determining serum LDL cholesterol levels, based on a sample size of 1656. Fig. 2d shows that interaction based on a dominant model for PTPN11 rs11066322 influences LDL cholesterol levels at the P<0.01 level (P=0.009), however, in neither case were main effects significant.
4. Discussion
We have shown in single tSNP analyses of a cohort of 2778 normal women, that several tSNPs in the PTPN11 and PIK3R1 genes were associated with apoB or LDL-cholesterol at the P<0.01 level. In the PTPN11 gene, rs11066322 allele 2 was associated with higher serum apoB and rs11066320 allele 2 was associated with lower serum LDL cholesterol.
PI3KR1 SNP rs706713 allele 2 was associated with lower LDL cholesterol. PIK3R1 rs251406 allele 2 was significantly associated with higher apoB. Therefore, in both PTPN11 and PIK3R1, the associated tSNPs show opposite relationships with apoB and LDL-cholesterol. However, as selected tSNPs are in minimal pairwise LD, they could also be in LD with different functional sites with opposite effects on apoB or LDL-cholesterol levels. Although not always statistically significant in both genes, in general the trend in LDL-cholesterol levels was paralleled by the changes in apoB levels and vice versa for each SNP.
PTPN11 tSNP rs11066322 interacted with PIK3R1 SNP rs251456 in determining serum apoB levels and with PIK3R1 tSNP rs40318 in determining LDL cholesterol levels. Therefore variants in PTPN11 and PIK3R1 influence levels of plasma apoB and apoB-containing lipoprotein LDL cholesterol, without effect on apoA1, HDL-cholesterol or triglycerides. The changes in lipoprotein and lipid parameters with respect to tSNP genotypes are small, with all SNP associations contributing small proportions of the total phenotypic variances. This is not unexpected, as multiple factors influence circulating lipoproteins and lipids.
The main strengths of our study lie in the large size of the sample, the availability of detailed phenotypes and comprehensive coverage of the PTPN11 gene by tSNPs. Coverage of PIK3R1 is less complete, as it lies in a region of low LD and eight tSNPs were needed to represent the nine validated SNPs available in public databases at the time of the study. Seven of our eight tSNPs in PIK3R1 are within the 27 common SNPs on the current release of HapMap. Sixteen HapMap SNPs cannot be tagged by our selection. All of the associated tSNPs in both genes are intronic and are most likely to be LD markers of any functional sites.
The study had 80% (α = 0.05) power to detect a biallelic quantitative trait locus explaining as little as 0.5% of the variance [29]. Although these findings may not be generalizable to men, our findings in the twin subjects can be considered as representative of the UK female population as a whole [19]. The results of the tests of gene interaction should be treated with caution. The presence of three tSNPs in PTPN11 and 8 in PIK3R1 generates a large number of pairs for testing. Taking a significance level of P<0.01 [24], our reported interaction findings are modest (P=0.009 – 0.028) and may be false positives. Like the cohort associations of individual SNPs, these demand replication in an independent sample.
This is the first gene-wide association study of PTPN11 in relation to metabolic variables and the first to report SNP associations with phenotypes reflecting known involvement of SHP-2 in insulin signalling. There are no previous reports of association of PIK3R1 variants with apoB or LDL. Interaction between genes for SHP-2 and PI3K in determining phenotypic outcomes has not previously been investigated.
Ugi et al. [12] have provided evidence for SHP-2 potentiation of PI3K activity stimulated by insulin in vitro. Acute control of apoB lipoprotein metabolism by insulin involves activation and subsequent localization of PI3K to the ER, where intracellular degradation to inhibit the secretion of apoB-containing lipoprotein particles, including LDL-cholesterol occurs [8, 9]. Our association of two PTPN11 SNP minor alleles and two PIK3R1 SNP minor alleles with elevated apoB and significant interactions between SNPs in the two genes, suggest that variants influencing SHP-2 activity may modulate the acute pathway by which insulin lowers apoB levels and levels of the apoB-containing lipoprotein LDL.
This report relates primarily to variation in two genes modulating levels of apoB and by implication lipoproteins with constituent apoB moieties, such as LDL-cholesterol. Our hypothesis is based on published findings on the acute and long-term regulation of apoB by insulin, via pathways that respectively include PI3K and SHP-2. We have shown that the two genes, which are known to be involved in the relevant pathways, affect serum apoB and LDL and interact with each other to determine levels. The secretion of VLDL has been shown to be dependent on fatty acids and insulin [31]. An inflow of fatty acids to the liver increases triglyceride formation, thereby influencing the formation of VLDL and VLDL1. Insulin has been shown to reduce VLDL formation, but the mechanism remains to be elucidated [32]. Insulin resistance and hyperglycemia are associated with excess hepatic production of VLDL1, but not VLDL2 particles [33], suggesting independent control of VLDL1 and VLDL2 apoB production.
Elevated levels of apoB are associated with insulin resistance/type 2 diabetes. Current systemic pharmacological agents improve glycemic control but have varying effects on the associated dyslipidemias. As coronary artery disease is the leading cause of death in patients with type 2 diabetes, the development of treatments that also improve known cardiovascular risk factors, such as hyperlipidemia, is important. A better understanding of how hepatic lipoprotein production is regulated in patients with diabetes could potentially lead to the development of more effective therapies to treat diabetic symptoms.
Supplementary Material
Acknowledgements
This study was funded by the Wellcome Trust, Project grant No. 073142. The Twin Research and Genetic Epidemiology Unit received support from the Wellcome Trust, Arthritis Research Campaign, the Chronic Disease Research Foundation and the European Union 5th Framework Programme Genom EU twin no. QLG2-CT-2002-01254 and EuroClot project LSHM-CT-2004-005268.
References
- 1.Wagner AM, Perez A, Calvo F, Bonet R, Castellvi A, Ordonez J. Apolipoprotein (B) identifies dyslipidemic phenotypes associated with cardiovascular risk in normocholesterolemic type 2 diabetic patients. Diabetes Care. 1999;22:812–817. doi: 10.2337/diacare.22.5.812. [DOI] [PubMed] [Google Scholar]
- 2.Davis RA, Hui TY. George Lyman Duff Memorial Lecture: atherosclerosis is a liver disease of the heart. Arterioscler Thromb Vasc Biol. 2001;21:887–898. doi: 10.1161/01.atv.21.6.887. [DOI] [PubMed] [Google Scholar]
- 3.Taskinen MR. Diabetic dyslipidemia. Atheroscler. 2002;(Suppl 3):4–51. doi: 10.1016/s1567-5688(01)00006-x. [DOI] [PubMed] [Google Scholar]
- 4.Verges BL. Dyslipidaemia in diabetes mellitus. Review of the main lipoprotein abnormalities and their consequences on the development of atherogenesis. Diabetes Metab. 1999;25(Suppl.3):32–40. [PubMed] [Google Scholar]
- 5.Duvillard L, Pont F, Florentin E, Galland-Jos C, Gambert P, Verges B. Metabolic abnormalities of apolipoprotein B-containing lipoproteins in non-insulin-dependent diabetes: a stable isotope kinetic study. Eur J Clin Invest. 2000;30:685–694. [PubMed] [Google Scholar]
- 6.Wetterau JR, Lin MC, Jamil H. Microsomal triglyceride transfer protein. Biochim Biophys Acta. 1997;1345:136–150. doi: 10.1016/s0005-2760(96)00168-3. [DOI] [PubMed] [Google Scholar]
- 7.Lin MC, Gordon D, Wetterau JR. Microsomal triglyceride transfer protein (MTP) regulation in HepG2 cells: insulin negatively regulates MTP gene expression. J Lipid Res. 1995;36:1073–1081. [PubMed] [Google Scholar]
- 8.Phung TL, Roncone A, Jensen KL, Sparks CE, Sparks JD. Phosphoinositide 3-kinase activity is necessary for insulin-dependent inhibition of apolipoprotein B secretion by rat hepatocytes and localizes to the endoplasmic reticulum. J Biol Chem. 1997;272:30693–30702. doi: 10.1074/jbc.272.49.30693. [DOI] [PubMed] [Google Scholar]
- 9.Sparks JD, Sparks CE. Insulin modulation of hepatic synthesis and secretion of apolipoprotein B by rat hepatocytes. J Biol Chem. 1990;265:8854–8862. [PubMed] [Google Scholar]
- 10.Au WS, Kung HF, Lin MC. Regulation of microsomal triglyceride transfer protein gene by insulin in HepG2 cells: Roles of MAPKerk and MAPKp38. Diabetes. 2003;52:1073–1080. doi: 10.2337/diabetes.52.5.1073. [DOI] [PubMed] [Google Scholar]
- 11.Feng GS. Shp-2 tyrosine phosphatase: signaling one cell or many. Exp Cell Res. 1999;253:47–54. doi: 10.1006/excr.1999.4668. [DOI] [PubMed] [Google Scholar]
- 12.Ugi S, Maegawa H, Kashiwagi A, Adachi M, Olefsky JM, Kikkawa R. Expression of dominant negative mutant SHPTP2 attenuates phosphatidylinositol 3′-kinase activity via modulation of phosphorylation of insulin receptor substrate-1. J Biol Chem. 1996;271:12595–12602. doi: 10.1074/jbc.271.21.12595. [DOI] [PubMed] [Google Scholar]
- 13.Xiao S, Rose DW, Sasaoka T, Maegawa H, Burke TR, Jr, Roller PP, Shoelson SE, Olefsky JM. Syp (SH-PTP2) is a positive mediator of growth factor-stimulated mitogenic signal transduction. J Biol Chem. 1994;269:21244–21248. [PubMed] [Google Scholar]
- 14.Noguchi T, Matozaki T, Horita K, Fujioka Y, Kasuga M. Role of SH-PTP2, a protein-tyrosine phosphatase with Src homology 2 domains, in insulin-stimulated Ras activation. Mol Cell Biol. 1994;14:6674–6682. doi: 10.1128/mcb.14.10.6674. [DOI] [PMC free article] [PubMed] [Google Scholar]
- 15.Milarski KL, Saltiel AR. Expression of catalytically inactive Syp phosphatase in 3T3 cells blocks stimulation of mitogen-activated protein kinase by insulin. J Biol Chem. 1994;269:21239–21243. [PubMed] [Google Scholar]
- 16.Chapman JM, Cooper JD, Todd JA, Clayton DG. Detecting disease associations due to linkage disequilibrium using haplotype tags: a class of tests and the determinants of statistical power. Hum Hered. 2003;56:18–31. doi: 10.1159/000073729. [DOI] [PubMed] [Google Scholar]
- 17.Stram DO, Haiman CA, Hirschhorn JN, Altshuler D, Kolonel LN, Henderson BE, Pike MC. Choosing haplotype-tagging SNPs based on unphased genotype data using a preliminary sample of unrelated subjects with an example from the Multiethnic Cohort Study. Hum Hered. 2003;55:27–36. doi: 10.1159/000071807. [DOI] [PubMed] [Google Scholar]
- 18.Spector TD, MacGregor AJ. The St. Thomas' UK Adult Twin Registry. Twin Res. 2002;5:440–443. doi: 10.1375/136905202320906246. [DOI] [PubMed] [Google Scholar]
- 19.Andrew T, Hart D, Snieder H, de Lange M, Spector TD, MacGregor AJ. Are twins and singletons comparable? A study of disease-related and lifestyle characteristics in adult women. Twin Res. 2001;4:464–477. doi: 10.1375/1369052012803. [DOI] [PubMed] [Google Scholar]
- 20.Middelberg RP, Spector TD, Swaminathan R, Snieder H. Genetic and environmental influences on lipids, lipoproteins, and apolipoproteins: effects of menopause. Arterioscler Thromb Vasc Biol. 2002;22:1142–1147. doi: 10.1161/01.atv.0000022889.85440.79. [DOI] [PubMed] [Google Scholar]
- 21.Friedewald WT, Levy RI, Fredrickson DS. Estimation of the concentration of low-density lipoprotein cholesterol in plasma, without use of the preparative ultracentrifuge. Clin Chem. 1972;18:499–502. [PubMed] [Google Scholar]
- 22.Spencer-Jones NJ, Snieder H, Wang X, Miller CSA, Spector TD, Carter ND, O'Dell SD. Protein tyrosine phosphatase-1B gene PTPN1: Selection of tagging SNPs and association with body fat, insulin sensitivity and the metabolic syndrome in a normal female population. Diabetes. 2005;54:3296–3304. doi: 10.2337/diabetes.54.11.3296. [DOI] [PubMed] [Google Scholar]
- 23.Trégouët D-A, Ducimetère P, Tiret L. Testing association between candidate-gene markers and phenotype in related individuals, by use of estimating equations. Am J Hum Genet. 1997;61:189–199. doi: 10.1086/513895. [DOI] [PMC free article] [PubMed] [Google Scholar]
- 24.van den Oord EJ, Sullivan PF. False discoveries and models for gene discovery. Trends Genet. 2003;19:537–542. doi: 10.1016/j.tig.2003.08.003. [DOI] [PubMed] [Google Scholar]
- 25.Dong Y, Zhu H, Wang X, Dalageorgou C, Carter N, Spector TD, Snieder H. Obesity reveals an association between blood pressure and the G-protein beta3-subunit gene: a study of female dizygotic twins. Pharmacogenetics. 2004;14:419–427. doi: 10.1097/01.fpc.0000114748.08559.ad. [DOI] [PubMed] [Google Scholar]
- 26.Zaykin DV, Westfall PH, Young SS, Karnoub MA, Wagner MJ, Ehm MG. Testing association of statistically inferred haplotypes with discrete and continuous traits in samples of unrelated individuals. Hum Hered. 2002;53:79–91. doi: 10.1159/000057986. [DOI] [PubMed] [Google Scholar]
- 27.Stephens M, Donnelly P. A comparison of bayesian methods for haplotype reconstruction from population genotype data. Am J Hum Genet. 2003;73:1162–1169. doi: 10.1086/379378. [DOI] [PMC free article] [PubMed] [Google Scholar]
- 28.Abecasis GR, Cookson WO. GOLD: graphical overview of linkage disequilibrium. Bioinformatics. 2000;16:182–183. doi: 10.1093/bioinformatics/16.2.182. [DOI] [PubMed] [Google Scholar]
- 29.Sham PC, Cherny SS, Purcell S, Hewitt JK. Power of linkage versus association analysis of quantitative traits, by use of variance-components models, for sibship data. Am J Hum Genet. 2000;66:1616–1630. doi: 10.1086/302891. [DOI] [PMC free article] [PubMed] [Google Scholar]
- 30.Lake SL, Lyon H, Tantisira K, Silverman EK, Weiss ST, Laird NM, Schaid DJ. Estimation and tests of haplotype-environment interaction when linkage phase is ambiguous. Hum Hered. 2003;55:56–65. doi: 10.1159/000071811. [DOI] [PubMed] [Google Scholar]
- 31.Adiels M, Olofsson SO, Taskinen MR, Boren J. Diabetic dyslipidaemia. Curr Opin Lipidol. 2006;17:238–246. doi: 10.1097/01.mol.0000226115.97436.c0. [DOI] [PubMed] [Google Scholar]
- 32.Taskinen MR. Diabetic dyslipidemia: from basic research to clinical practice. Diabetologia. 2003;46:733–749. doi: 10.1007/s00125-003-1111-y. [DOI] [PubMed] [Google Scholar]
- 33.Adiels M, Boren J, Caslake MJ, Stewart P, Soro A, Westerbacka J, Wennberg B, Olofsson SO, Packard C, Taskinen MR. Overproduction of VLDL1 driven by hyperglycemia is a dominant feature of diabetic dyslipidemia. Arterioscler Thromb Vasc Biol. 2005;25:1697–1703. doi: 10.1161/01.ATV.0000172689.53992.25. [DOI] [PubMed] [Google Scholar]
Associated Data
This section collects any data citations, data availability statements, or supplementary materials included in this article.