Abstract
Knud Andersen (1912, Catalogue of the Chiroptera in the Collections of the British Museum: I. Megachiroptera, British Museum of Natural History, London) divided Old World fruitbats (family Pteropodidae) into the rousettine, cynopterine, epomophorine, eonycterine, and notopterine sections. The latter two sections comprise the subfamily Macroglossinae; members of this subfamily exhibit specializations for nectarivory (e.g., elongated, protrusible, brushy tongues) and cluster together in cladistic analyses based on anatomical characters. Other evidence, including single-copy DNA hybridization, suggests that macroglossines are either paraphyletic or polyphyletic; this implies that adaptations for pollen and nectar feeding evolved independently in different macroglossine lineages or were lost in nonmacroglossines after evolving in a more basal common ancestor. Hybridization data also contradict Andersen’s phylogeny in providing support for an endemic African clade that includes representatives of three of Andersen’s sections. Here, we present complete mitochondrial 12S rRNA and valine tRNA gene sequences for 20 pteropodids, including representatives of all of Andersen’s sections, and examine the aforementioned controversies. Maximum likelihood, minimum evolution, and maximum parsimony analyses all contradict macroglossine monophyly and provide support for an African clade that associates Megaloglossus and Lissonycteris and those two with Epomophorus. In conjunction with the DNA hybridization results, there are now independent lines of molecular evidence suggesting: (i) convergent evolution of specializations for nectarivory, at least in Megaloglossus versus other macroglossines, and (ii) a previously unrecognized clade of endemic Africa taxa. Estimates of divergence time based on 12S rRNA and DNA hybridization data are also in good agreement and suggest that extant fruitbats trace back to a common ancestor 25 million to 36 million years ago.
Keywords: megachiroptera, 12S rRNA, valine tRNA, convergence, biogeography
Knud Andersen’s monograph (1) remains the most comprehensive treatment of the Megachiroptera (Old World fruitbats) even though several new genera (e.g., Aproteles, Paranyctimene) have been described (2, 3). Andersen included all fruitbats in the family Pteropodidae with three subfamilies: a paraphyletic Pteropodinae, which contains the majority of species and genera; the monotypic Harpyionycterinae; and the presumed monophyletic subfamily Macroglossinae containing taxa with specializations for nectarivory. Andersen recognized the Macroglossinae as a sister-taxon to other living fruitbats.
Beyond his subfamilial distinctions, Andersen divided fruitbats into five sections. Nonmacroglossines are placed in the rousettine, epomophorine, and cynopterine sections. Among the rousettines, Andersen judged Rousettus (Fig. 1a) as similar in morphology to the ancestor of all pteropodids (e.g., no surface cusps on P4 and M1, no narrowing and degeneration of the cheekteeth, rostrum of moderate length). Rousettus has a mixed diet that includes soft fruits and/or fruit juices as well as nectar (3, 4). Among other rousettines (Fig. 1b), Acerodon, Pteralopex, and some species of Pteropus routinely deal with fruit pulp and have anatomical features consistent with these dietary preferences (1), e.g., robust dentary with expanded coronoid process and masseteric fossa. The Epomophorus section contains genera that are African in distribution; members of this section are characterized by a distinct flattening of the braincase (Fig. 2c). Like Rousettus, many epomophorines are mixed feeders (i.e., combination of frugivory and nectarivory) and have anatomical features (e.g., of the mandible) that are intermediate between Acerodon-Pteralopex and macroglossines. The Cynopterus section (Fig. 1d) contains forms characterized by traits such as a short rostrum and a tendency to develop cusps on P4 and M1. Included in Andersen’s Cynopterus section is the aberrant Nyctimene, which is unique among fruitbats with its partially insectivorous diet. Finally, the eonycterine and notopterine sections together comprise the Macroglossinae. Macroglossines are unique among fruitbats in having a more elongated, slender, protrusible tongue; further, the tip and lateral area of the base of the tongue are covered by long, filiform papillae that give the tongue a brushlike appearance and function in extracting pollen from flowers (see Fig. 2). Osteological modifications in macroglossines include cheektooth reduction and degeneration, a narrower and more recumbent coronoid process, and a lower mandibular condyle (Fig. 1 e and f).
Figure 1.
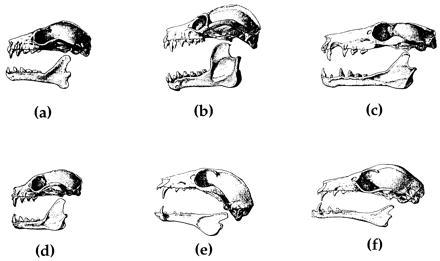
Lateral views of the skulls and mandibles of (a) Rousettus aegyptiacus, (b) Pteralopex atrata, (c) Epomophorus gambianus, (d) Cynopterus sphinx, (e) Melonycteris melonops, and (f) Megaloglossus woermanni. Modified after Andersen (1).
Figure 2.
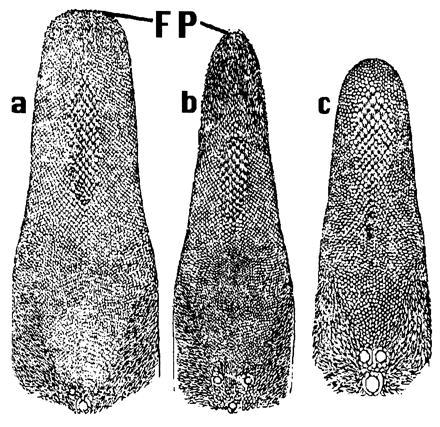
Diagrams of the superior surfaces of the tongues of (a) Macroglossus lagochilus, (b) Eonycteris spelaea, and (c) Cynopterus sphinx. Anterior filiform papillae are indicated as FP. Macroglossus and Eonycteris are macroglossines; Cynopterus is a cynopterine. Modified after Andersen (1).
A cladistic reanalysis of Andersen’s morphological data confirms many of Andersen’s conclusions, including macroglossine monophyly and, with a few exceptions, the monophyly of the Cynopterus and Epomophorus sections (5). The Rousettus section is paraphyletic based on this reanalysis. Single-copy (sc) DNA hybridization (6), restriction fragment length polymorphism analysis (7), and an evaluation of female reproductive characters (8) all suggest that macroglossines are paraphyletic or polyphyletic with the implication that nectarivorous tongue characters evolved independently in different lineages or were reversed once evolved in a common ancestor. scDNA hybridization also provides evidence for an African clade that includes Megaloglossus, Lissonycteris, and Epomophorus. Andersen included each of these genera in a separate section.
Here, we examine fruitbat relationships, with an emphasis on macroglossines and the possibility of an African clade, using complete sequences for the mitochondrial (mt) 12S ribosomal RNA (rRNA) and tRNA valine genes. Together, sequences for these two genes provide an independent data set for testing the conflicting results of previous studies.
MATERIALS AND METHODS
DNA samples were extracted (9–10) for two microchiropterans [Molossus sinaloae (family Molossidae); Hipposideros galeritus (family Hipposideridae)] and 20 megachiropterans [Rousettus amplexicaudatus, Rousettus (Lissonycteris) angolensis, Eidolon dupraenum, Acerodon celebensis, Pteropus admiralitatum, Pteropus hypomelanus, Pteralopex atrata, Dobsonia mollucensis, and Aproteles bulmerae are in the rousettine section; Epomophorus wahlbergi is in the epomophorine section; Cynopterus brachyotis, Thoopterus nigrescens, Nyctimene albiventer, and Nyctimene robinsoni are in the cynopterine section; Eonycteris spelaea, Macroglossus minimus, Megaloglossus woermanni, and Syconycteris australis are eonycterines; and Melonycteris fardoulisi and Notopteris macdonaldi are notopterines]. The 12S rRNA and valine tRNA genes were amplified and sequenced as described elsewhere (11). Accession numbers for the [new sequences are U61077U61077 and U93053–U93073 (U93053 U93054 U93055 U93056 U93057 U93058 U93059 U93060 U93061 U93062 U93063 U93064 U93065 U93066 U93067 U93068 U93069 U93070 U93071 U93072 U93073).] The sequence for Eptesicus fuscus (family Vespertilionidae, accession number U61082) was obtained from GenBank. Voucher and/or collector information is included with the GenBank sequences. Sequences were aligned using clustal w (12). Sequence alignments were modified following secondary structure models (13–14). Regions where alignments were ambiguous were omitted from phylogenetic analyses. For 12S rRNA, we omitted the regions between 8 and 8′, 10 and 10′, 4′ and 13′, 17 and 18′, 18′ and 17′, 24 and C′, 35 and 35′, 35′ and 36 (except the last six bases), and 39P and 39P′[stem numbers follow Springer and Douzery (13)]; for tRNA valine, we omitted the dihydrouridine and ribothymidine loops. We also omitted sites with gaps. This resulted in 927 characters.
Maximum likelihood, minimum evolution, and parsimony (uniform and differential weighting schemes) were used to estimate phylogenetic trees using the three microchiropterans as outgroups. These analyses, including topology-dependent permutation tail probability (T-PTP) tests (15), bootstrapping (16), and the Kishino–Hasegawa (17) test, were conducted with paup 4.0d49 and 4.0d52 for Power MacIntosh (18). Bootstrap and T-PTP tests included 500 replications except for the maximum-likelihood analysis with a gamma rate-distribution (100 replications). For the maximum likelihood analyses, we used empirical base frequencies with full heuristic searches. The first analysis was based on the HKY85 (19) model, which assumes a 2:1 transition:transversion ratio with equal rates among sites. The second analysis used a transition:transversion ratio of 4.32 and a gamma distribution with a shape parameter of 0.22. These parameters were estimated from the five equally most parsimonious trees following the recommendation of Swofford et al. (20). Minimum-evolution (21) trees were estimated using Jukes and Cantor (22), Kimura-2 parameter (23), and Tamura and Nei (24)-corrected distances with full heuristic searches. For each distance correction, we used both equal rate and gamma-rate distribution options. For the parsimony analyses, we used full heuristic searches with 10 random input orders. Initially, all characters were weighted equally. We also downweighted stem sites by 0.62 to account for nonindependence (11). Finally, we reweighted characters proportional to their consistency indices until a stable topology was obtained. Character-state transformations were either unweighted or weighted to account for the transition-bias in animal mtDNA; in the latter case transversions were weighted more heavily than transitions in both stems (9.6:1) and loops (7.0:1) based on estimates of transition and transversion frequencies among closely related mammalian taxa. Specifically, we tabulated transition and transversion frequencies for 11 pairwise comparisons for which sequence divergence is less than 5% (e.g., Nyctimene robinsoni to N. albiventer, Pteropus hypomelanus to P. admiralitatum, Halichoerus grypus to Phoca vitulina, Macropus rufus to M. giganteus).
Two regression equations were used to estimates divergence times; both are based on the linearity of 12S rRNA transversions as far back as 120 million years (13). The first equation (25) is based on 21 eutherian and metatherian divergence dates but does not take into account lineage-specific rate variation. The second equation (26) is based on nine independent data points in conjunction with relative-rate corrected distances (27).
RESULTS
Sequence Divergence.
The smallest uncorrected sequence divergence for the 927-bp data set is 0% (P. hypomelanus to P. admiralitatum). If the more variable positions are also included there are two transitional differences between these sequences. Among other fruitbat sequences, uncorrected distances range from 3.5% (Pteropus to Acerodon) to 11.3% (Epomophorus to N. albiventer) for all substitutions, 3.2% (Pteropus to Acerodon) to 8.1% (Melonycteris to Cynopterus) for transitions only, and 0.2% (Pteropus to Acerodon) to 3.3% (Aproteles to both Melonycteris and Cynopterus) for transversions only. Uncorrected distances to the outgroup taxa range from 11.2% to 18.4% for all substitutions, 7.9% to 12.8% for transitions only, and 2.7% to 5.8% for transversions only.
Maximum Likelihood.
Maximum likelihood (HKY85) resulted in a single tree (Fig. 3). Bootstrap percentages for the most robust clades are given in Table 1. Aside from the 100% bootstrap for the two pairs of conspecifics, there is also support for Megaloglossus plus Lissonycteris (73%), these two with Epomophorus (100%), Dobsonia and Aproteles (97%), and Acerodon and Pteropus (92%). The results of a maximum-likelihood bootstrap analysis with a gamma distribution of rates are consistent with the HKY85 results (Table 1).
Figure 3.
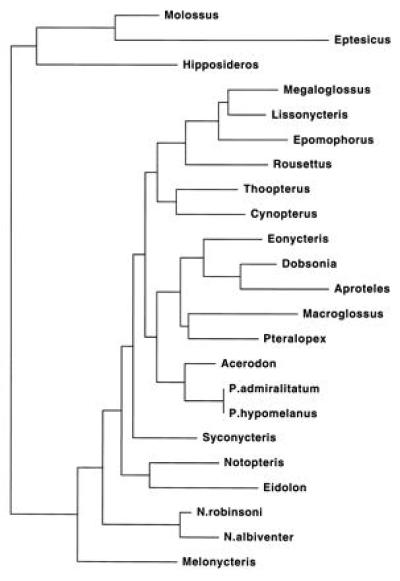
Maximum-likelihood tree under the HKY85 model of sequence evolution. −ln likelihood = 6136.62167. For scale, the terminal branch leading to Molossus represents 2.2% nucleotide substitution.
Table 1.
Levels of bootstrap support (percentage) for select clades based on maximum likelihood, minimum evolution, and parsimony methods
| Taxa | Minimum evolution
|
Mean | ||||||||||||
|---|---|---|---|---|---|---|---|---|---|---|---|---|---|---|
| ML
|
JC
|
K
|
TN
|
Parsimony
|
||||||||||
| HKY | G | = | G | = | G | = | G | UW | DWS | RW | Ts:Tv | RW+ | ||
| P. hypomelanus + P. admiralitatum | 100 | 100 | 100 | 100 | 100 | 100 | 100 | 100 | 100 | 100 | 100 | 100 | 100 | 100.0 |
| N. robinsonii + N. albiventer | 100 | 100 | 100 | 100 | 100 | 100 | 100 | 100 | 100 | 100 | 100 | 100 | 100 | 100.0 |
| Pteropus + Acerodon | 92 | 95 | 98 | 97 | 97 | 90 | 98 | 89 | 90 | 90 | 98 | 90 | 98 | 94.0 |
| Dobsonia + Aproteles | 97 | 97 | 97 | 98 | 99 | 95 | 97 | 95 | 95 | 97 | 96 | 95 | 53 | 93.2 |
| Lissonycteris + Megaloglossus | 73 | 95 | 83 | 60 | 95 | 70 | 85 | 39 | 70 | 66 | 81 | 70 | 85 | 74.8 |
| Lissonycteris + Megaloglossus + Epomophorus | 100 | 100 | 100 | 100 | 100 | 99 | 99 | 100 | 99 | 99 | 100 | 99 | 98 | 99.5 |
| Lissonycteris + Megaloglossus + Epomophorus + Rousettus | 57 | 66 | 41 | 48 | 36 | 44 | 38 | 39 | 44 | 49 | 81 | 44 | 85 | 51.7 |
For minimum evolution bootstrap percentages, the two numbers in each column assume equal rates at each site (=) and a gamma distribution (G) of rates. The shape parameter for the gamma distribution was estimated at 0.22, which is the mean value estimated using maximum likelihood to evaluate the five equally most parsimonious trees (uniform weights). ML = maximum likelihood; HKY = HKY85 model; JC = Jukes–Cantor; K = Kimura 2-parameter; TN = Tamura–Nei; UW = uniforms weights; DWS = down-weighting stem bases by 0.62 relative to loop bases; RW = reweighting by the consistency index; Ts:Tv = differential weighting of transitions and transversions in both stems and loops (see text); RW+ = reweighting plus differential weighting of transitions and transversions.
The maximum-likelihood tree shown in Fig. 3 is significantly better (Kishino–Hasegawa test) than likelihood trees that constrain macroglossine monophyly (P = 0.0017), rousettine monophyly (P < 0.0001), and the association of Rousettus and Lissonycteris (P = 0.0166). The best tree is not significantly better, at P = 0.05, than trees that impose (i) macroglossine monophyly, excluding Megaloglossus [i.e., Hood’s hypothesis (8)], and (ii) all of the scDNA hybridization tree constraints.
Minimum Evolution.
Minimum evolution with Jukes–Cantor distances resulted in the tree shown in Fig. 4. Bootstrap support for select clades is indicated in Table 1. Consistent with maximum likelihood, the minimum-evolution tree supports Megaloglossus plus Lissonycteris (83%), these two with Epomophorus (100%), Dobsonia and Aproteles (97%), and Acerodon with Pteropus (98%). Other distance corrections, with or without gamma distributions for rate variation, also support these groups (Table 1).
Figure 4.
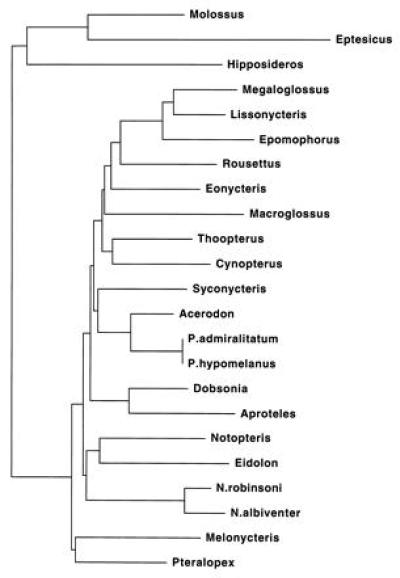
Minimum-evolution tree (minimum evolution score = 0.95414) based on Jukes–Cantor distances with an equal rates assumption. For scale, the terminal branch leading to Molossus represents 3.6% nucleotide substitution.
Parsimony.
Of the 927 characters, 220 were informative under parsimony. Uniform weighting of characters resulted in five 962-step trees (CI = 0.469; RI = 0.434). A strict consensus of these, along with decay indices, is shown in Fig. 5. Bootstrap values for select clades are given in Table 1 for parsimony analyses with uniform weighting and other weighting schemes. Parsimony provides support for the same clades that are supported by maximum likelihood and minimum evolution. The bootstrap tree based on reweighted characters, with or without transition:transversion weighting, provides increased support for an association of Rousettus with the Epomophorus–Lissonycteris–Megaloglossus clade.
Figure 5.
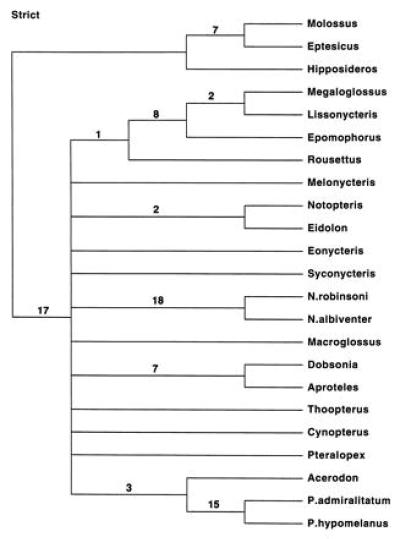
Strict consensus tree based on five equally most parsimonious trees (962 steps) with uniform weighting. Decay indices are indicated above branches.
Macroglossines are not monophyletic in any of the parsimony analyses. The shortest tree showing macroglossine monophyly (not shown) is 32 steps longer than the minimum-length trees with uniform weights (see Table 2). Constraining macroglossine monophyly, excepting the inclusion of Megaloglossus with the others, requires only 15 additional steps. T-PTP tests indicate that unconstrained trees are significantly shorter than trees that constrain macroglossine monophyly (P = 0.000); however, the T-PTP test is not significant with the relaxed constraint that excepts Megaloglossus from this clade (P = 0.350). Other topological constraints deriving from morphological data and/or scDNA were also evaluated and are indicated in Table 2. Cynopterine monophyly requires only two additional steps and the T-PTP test was not significant. Rousettine monophyly requires 38 additional steps and resulted in a significant T-PTP test (P = 0.000). The association of Rousettus and Lissonycteris requires 12 additional steps, but the T-PTP test was not significant (P = 0.124).
Table 2.
Number of additional steps resulting from topological constraints
| Constraint | Number of steps |
|---|---|
| 1. Macroglossine monophyly | 32* |
| 2. Macroglossine monophyly (excepting Megaloglossus) | 15 |
| 3. Rousettine monophyly | 38* |
| 4. Rousettus + Lissonycteris | 12 |
| 5. Cynopterine monophyly | 2 |
| 6. Macroglossus + Syconycteris | 3 |
| 7. Cynopterus + Thoopterus | 1 |
| 8. Pteropus + Acerodon + Pteralopex | 3 |
| 9. Pteropus + Acerodon + Pteralopex + Melonycteris | 3 |
| 10. Pteropus + Acerodon + Pteralopex + Melonycteris + Notopteris | 3 |
| 11. Nyctimene as a sister-group to other fruitbats | 1 |
Divergence Time Estimates.
Table 3 gives divergence time estimates for select pairs of taxa. Acerodon and Pteropus diverged at 2.1 to 3.5 million years (Myr), Megaloglossus and Lissonycteris at 7.3 to 12.1 Myr, these two and Epomophorus at 10.0 to 14.2 Myr, these three and Rousettus at 14.0 to 16.1 Myr, and Dobsonia and Aproteles at 21.8 to 23.4 Myr. Assuming that either Melonycteris (7) or Nyctimene (6) diverged from other genera at or near the base of the pteropodid tree, extant fruitbats trace back to a common ancestor 27.7 to 35.1 Myr ago.
Table 3.
Estimates of divergence time, in millions of years, based on 12S rRNA transversions
| Taxa | N | Divergence time
|
|
|---|---|---|---|
| Method I | Method II | ||
| 1. N. robinsonii to N. albiventer | 1 | 8.6 | 9.7 |
| 2. Acerodon to Pteropus | 1 | 3.5 | 2.1 |
| 3. Megaloglossus to Lissonycteris | 1 | 7.3 | 12.1 |
| 4. (Megaloglossus + Lissonycteris) to Epomophorus | 2 | 10.0 (2.0, 1.4) | 14.2 (2.0, 1.1) |
| 5. Rousettus to (Megaloglossus + Lissonycteris + Epomophorus) | 3 | 14.0 (1.4, 0.8) | 16.1 (2.7, 1.6) |
| 6. Dobsonia to Aproteles | 1 | 23.4 | 21.8 |
| 7. Melonycteris to other genera | 17 | 27.7 (5.3, 1.3) | 35.1 (5.3, 1.3) |
| 8. Nyctimene to other genera | 17 | 29.7 (4.6, 1.1) | 34.2 (5.2, 1.3) |
Method I estimates are based on the equation DT = [%TV − 0.059)/0.085] (25). Method II estimates are based on the equation DT = [%TV/0.063] (26). Divergence times (DT) are in millions of years. %TV is Kimura (23) corrected transversions for the first equation and Tamura–Nei (24) corrected transversions for the second equation. Standard deviations and standard errors are given in parentheses, respectively.
DISCUSSION
Maximum likelihood, minimum evolution, and parsimony all provide support for several of the same clades. Support for Acerodon plus Pteropus ranges from 89% to 98% (mean = 93.8%). Likewise, support for Dobsonia plus Aproteles is high (95% to 99%) in 12 of 13 analyses. Morphology (3, 5) and scDNA (6) also support these clades. Given the independence of anatomical, mtDNA, and scDNA data sets, these clades are robust.
Where morphology and DNA hybridization disagree, our results are in agreement with the latter. First, rousettines are either paraphyletic or polyphyletic rather than monophyletic as suggested by Andersen (1). Bootstrapping, T-PTP, and Kishino–Hasegawa tests all support this view. Lissonycteris, a subgenus of Rousettus, shows closer affinites with a macroglossine (Megaloglossus) and an epomophorine (Epomophorus) than with Rousettus. Haiduk et al. (28) and Kingdon (29) argued for the distinctness of Lissonycteris and a cladistic reanalysis of Andersen’s data (5) failed to support Lissonycteris plus Rousettus. We note that Lissonycteris, like epomophorines, has a flattened braincase (1, 5); Lissonycteris also has a sleeping posture that is more similar to epomophorines than to Rousettus (29). Second, macroglossines appear paraphyletic or polyphyletic. None of our trees associate even two macroglossines. Statistical tests provide evidence that Megaloglossus, at least, is separate from other macroglossines and is closely related to nonmacroglossines. Hood (8) suggested that the remaining macroglossines are monophyletic. Kirsch et al. (6) suggested that nectarivory in macroglossines evolved as many as five times. While not providing convincing support for the specific relationships of macroglossine genera (excepting the separateness of Megaloglossus), our data are more consistent with Kirsch et al.’s hypothesis (6). Either way, convergent evolution has resulted in the macroglossine tongue at least twice, if not several times, in fruitbat evolution. Anatomical specializations for nectarivory are labile among megachiropterans. Even among nonmacroglossines there are taxa that approach the macroglossine condition. In Nanonycteris, which is an obligate nectar feeder (3), cheekteeth are reduced and the coronoid process is narrow and recumbent. Stenonycteris, a subgenus of Rousettus that feeds on nectar, also exhibits these modifications as well as numerous filiform papillae on the tongue (1). Characteristics associated with nectarivory therefore may be unreliable indicators of phylogenetic relationships. Reliance on tongue structure as a taxonomic character also has led to erroneous classifications among avian taxa, e.g., including honeyeaters, sunbirds, flowerpeckers, and white-eyes in the same higher group (30).
There are examples of clades that are strongly supported by scDNA hybridization but not by mtDNA sequences (e.g., Cynopterus + Thoopterus, Macroglossus + Syconycteris, Notopteris + Melonycteris + Pteralopex + Acerodon + Pteropus). Nevertheless, all of these clades either occur on one of the minimum-length parsimony trees (uniform weights) or require only one or a few extra steps. Thus, scDNA and mtDNA data provide several examples of strong support for the same clades but no examples of strong support for mutually incompatible clades. The Kishino–Hasegawa test did not indicate a significant difference between the best maximum-likelihood tree and the maximum-likelihood tree that includes all of the scDNA hybridization constraints. Our study falls in line with others where DNA hybridization and DNA sequence results are in general agreement (31, 32).
The association of the African genera Megaloglossus, Lissonycteris, and Epomophorus is supported by two independent data sets, i.e., mtDNA sequences and scDNA hybridization. Other epomophorines, which were not included in either this study or the scDNA study of Kirsch et al. (6), also may be part of this clade. This finding has implications for understanding the origins of African fruitbats. Instead of deriving from independent lineages, as previously believed, Megaloglossus, Lissonycteris, and Epomophorus share a common ancestor that likely resided in Africa. Another example of an endemic African clade revealed by molecular data, albeit at a higher taxonomic level and deeper in the mammalian tree, is the association of proboscideans, sirenians, hyracoids, tubulidentates, macroscelideans, and chrysochlorids (26, 33, 34). In both cases, geographic distributions yield insights into phylogenetic relationships that did not emerge from morphological studies.
scDNA hybridization and mtDNA sequences agree in placing Rousettus, which has a wide geographic distribution that includes Africa, as the next closest taxon to the Epomophorus–Lissonycteris–Megaloglossus group. Bootstrap support values are highest for scDNA (100%) and mtDNA with reweighted characters (81–85%).
Our study does not resolve the deeper nodes in fruitbat phylogeny. This may result from diminished phylogenetic signal at this temporal depth as mammalian 12S rRNA transitions are at or near saturation by 20 Myr (13). Short internal branches also may contribute to diminished resolution as even deeper in the tree there is 99–100% bootstrap support for pteropodid monophyly.
scDNA hybridization (6) and 12S rRNA provide similar estimates for the divergence of Rousettus from the Epomophorus-Lissonycteris-Megaloglossus clade (16–16.8 Myr and 14.0–16.1 Myr, respectively), Epomophorus from Lissonycteris and Megaloglossus (9.4 Myr and 10.0–14.2 Myr, respectively), and Lissonycteris from Megaloglossus (6.7 Myr and 7.3–12.1 Myr years, respectively). Given that Rousettus is wide ranging and rather unspecialized, a Rousettus-like ancestor may have reached Africa 15 Myr ago, or slightly earlier, and initiated the diversification of African genera that are part of this clade.
African genera are not at the base of the fruitbat radiation in our study or in the scDNA hybridization study of Kirsch et al. (6). Rather, basal divergences involve Indo-Australo-Pacific genera. This suggests that the Indo-Australo-Pacific region may be near the center of origin for fruitbats. In addition to southeast Asia, from which the oldest megachiropteran fossil has been reported (35, 36), islands such as New Guinea may have played a role in early fruitbat diversification. An island comparable in size to the present-day New Guinea had emerged by the Oligocene through the combination of orogeny and retraction of shallow seas (37–41). Our estimates for basal fruitbat divergences (27.7–35.1 Myr) are 2.7 to 10.1 Myr older than those based on DNA hybridization (25 Myr) but both are consistent with this hypothesis of early diversification in the Indo-Australo-Pacific region.
The earliest fossil megachiropterans are Archaeopteropus from the early Oligocene (42) and a late Eocene specimen from Thailand (35). The latter specimen is a single tooth that Ducrocq et al. (36) argue is a premolar from an epomophorine. Our results suggest otherwise as Epomophorus, and presumably closely related African genera, are removed from the base of the fruitbat tree and probably trace to a Miocene rather than Eocene common ancestor. Nevertheless, convergence among macroglossines suggests the possibility that the epomophorine condition may have been arrived at independently as well.
Acknowledgments
We thank Drs. Tim Flannery, John Kirsch, and Michael Stanhope for tissue/DNA samples. John Kirsch and three anonymous reviewers provided helpful comments on an earlier version of this manuscript. We thank Dr. David Swofford for permission to use paup 4.0d49 and 4.0d52. This work was supported by the National Science Foundation (DEB-9419617), an Alfred P. Sloan Young Investigator’s Award in Molecular Evolution, and an intramural grant from the Academic Senate at the University of California Riverside to M.S.S. Part of this work derives from the Master’s Thesis of L.J.H.
ABBREVIATIONS
- sc
single copy
- mt
mitochondrial
- Myr
million years
- T-PTP
topology-dependent permutation tail probability
Footnotes
References
- 1.Andersen K. Catalogue of the Chiroptera in the Collections of the British Museum. I. Megachiroptera. London: British Museum of Natural History; 1912. [Google Scholar]
- 2.Koopman K F. Chiroptera: Systematics. Handbook of Zoology. New York: de Gruyter; 1994. [Google Scholar]
- 3.Nowak R M. Walker’s Bats of the World. Baltimore: Johns Hopkins Univ. Press; 1994. [Google Scholar]
- 4.Wilson D E. Syst Zool. 1973;22:14–29. [Google Scholar]
- 5.Springer M S, Hollar L J, Kirsch J AW. Aust J Zool. 1995;43:557–582. [Google Scholar]
- 6.Kirsch J A W, Flannery T F, Springer M S, Lapointe F-J. Aust J Zool. 1995;43:395–428. [Google Scholar]
- 7.Colgan D J, Flannery T F. Syst Biol. 1995;44:209–220. [Google Scholar]
- 8.Hood C S. J Morphol. 1989;199:207–221. doi: 10.1002/jmor.1051990207. [DOI] [PubMed] [Google Scholar]
- 9.Kirsch J A W, Springer M S, Krajewski C, Archer M, Aplin K, Dickerman A W. J Mol Evol. 1990;30:434–448. doi: 10.1007/BF02101115. [DOI] [PubMed] [Google Scholar]
- 10.Stanhope M J, Czelusniak J, Si J-S, Nickerson J, Goodman M. Mol Phylogenet Evol. 1992;1:148–160. doi: 10.1016/1055-7903(92)90026-d. [DOI] [PubMed] [Google Scholar]
- 11.Springer M S, Hollar L J, Burk A. Mol Evol Biol. 1995;12:1138–1150. doi: 10.1093/oxfordjournals.molbev.a040288. [DOI] [PubMed] [Google Scholar]
- 12.Thompson J D, Higgins G D, Gibson T J. Nucleic Acids Res. 1994;22:4673–4680. doi: 10.1093/nar/22.22.4673. [DOI] [PMC free article] [PubMed] [Google Scholar]
- 13.Springer M, Douzery E. J Mol Evol. 1996;43:357–373. doi: 10.1007/BF02339010. [DOI] [PubMed] [Google Scholar]
- 14.Anderson S, de Bruijn M H L, Coulson A R, Eperon I C, Sanger F, Young I G. J Mol Biol. 1982;156:683–717. doi: 10.1016/0022-2836(82)90137-1. [DOI] [PubMed] [Google Scholar]
- 15.Faith D P. Syst Zool. 1991;40:366–375. [Google Scholar]
- 16.Felsenstein J. Evolution. 1985;39:783–791. doi: 10.1111/j.1558-5646.1985.tb00420.x. [DOI] [PubMed] [Google Scholar]
- 17.Kishino H, Hasegawa M. J Mol Evol. 1989;29:170–179. doi: 10.1007/BF02100115. [DOI] [PubMed] [Google Scholar]
- 18.Swofford, D. L. (1996) paup Versions 4.0d49 and 4.0d52.
- 19.Hasegawa M, Kishino H, Yano T. J Mol Evol. 1985;22:160–174. doi: 10.1007/BF02101694. [DOI] [PubMed] [Google Scholar]
- 20.Swofford D L, Olsen G J, Waddell P J, Hillis D M. In: Molecular Systematics. Hillis D M, Moritz C, Mable B K, editors. Sunderland, MA: Sinauer; 1996. pp. 407–514. [Google Scholar]
- 21.Rzhetsky A, Nei M. Mol Biol Evol. 1992;9:945–967. [Google Scholar]
- 22.Jukes T H, Cantor C H. In: Mammalian Protein Metabolism. Munro H M, editor. New York: Academic; 1969. pp. 21–123. [Google Scholar]
- 23.Kimura M. J Mol Evol. 1980;16:111–120. doi: 10.1007/BF01731581. [DOI] [PubMed] [Google Scholar]
- 24.Tamura K, Nei M. Mol Biol Evol. 1993;10:512–526. doi: 10.1093/oxfordjournals.molbev.a040023. [DOI] [PubMed] [Google Scholar]
- 25.Springer M S, Kirsch J A W, Case J A. In: Molecular Evolution and Adaptive Radiations. Givnish T, Sytsma K, editors. Cambridge, U.K.: Cambridge Univ. Press; 1997. , in press. [Google Scholar]
- 26.Springer, M. S., Cleven, G. C., Madsen, O., de Jong, W. W., Waddell, V. G., Amrine, H. M. & Stanhope, M. J. (1997) Nature London, in press. [DOI] [PubMed]
- 27.Arnason U, Gullberg A, Janke A, Xu X. J Mol Evol. 1996;43:650–661. doi: 10.1007/BF02202113. [DOI] [PubMed] [Google Scholar]
- 28.Haiduk M W, Robbins L W, Schlitter D A. Annalen Koninklijk Museum Voor Midden-Afrika. 1983;237:1–8. [Google Scholar]
- 29.Kingdon J. East African Mammals. New York: Academic; 1974. [Google Scholar]
- 30.Sibley C G, Ahlquist J E. Phylogeny and Classification of Birds. New Haven, CT: Yale Univ. Press; 1990. [Google Scholar]
- 31.Hedges S B, Sibley C G. Proc Natl Acad Sci USA. 1994;91:9861–9865. doi: 10.1073/pnas.91.21.9861. [DOI] [PMC free article] [PubMed] [Google Scholar]
- 32.Springer M S, Higuchi H, Ueda K, Minton J, Sibley C G. J Yamashina Inst Ornithol. 1995;27:66–77. [Google Scholar]
- 33.Porter C A, Goodman M, Stanhope M J. Mol Phylogenet Evol. 1996;5:89–101. doi: 10.1006/mpev.1996.0008. [DOI] [PubMed] [Google Scholar]
- 34.Stanhope M J, Smith M R, Waddell V G, Porter C A, Shivji M S, Goodman M. J Mol Evol. 1996;43:83–92. doi: 10.1007/BF02337352. [DOI] [PubMed] [Google Scholar]
- 35.Ducrocq S, Jaeger J-J, Sige B. Bat Res News. 1992;33:41–42. [Google Scholar]
- 36.Ducrocq S, Jaeger J-J, Sige B. Neues Jahr Geol Palaontol Monatsh. 1993;1993:561–575. [Google Scholar]
- 37.Dow D B. Bureau of Mineral Resources, Geology and Geophysics No. 201. Canberra: Australian Govt. Pub. Service; 1977. [Google Scholar]
- 38.Dow D B, Sukamto R. Episodes. 1984;7:3–9. [Google Scholar]
- 39.Flannery T F. Australian Zoological Reviews. 1989;1:15–24. [Google Scholar]
- 40.Flannery T F. Mammals of New Guinea. Carina, Queensland: Robert Brown; 1990. [Google Scholar]
- 41.Aplin K P, Baverstock P R, Donnellan S C. Science in New Guinea. 1993;19:131–145. [Google Scholar]
- 42.Meschinelli L. Atti Ist Veneto Sci Lett Arti Cl Sci Fis Mat Nat. 1903;62:1329–1344. [Google Scholar]


