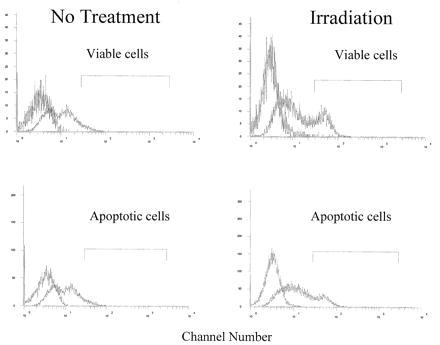
Figure 6.

Unirradiated B6 splenocytes (Left) and in vivo irradiated (150 rads) B6 splenocytes (Right) from 5-month-old mice were cultured overnight and stained for Fas using FITC hamster IgG anti-Fas (right fluorescence profile in each histogram). In each histogram, the peak on the far left represents the same cells stained with the isotype control hamster IgG anti-TNP–FITC and was negative on all populations. (Upper) Histograms represent the FITC profile of viable cells. (Lower) FITC profiles for apoptotic cells from the same B6 splenocytes. Apoptotic and viable cells were identified by their forward angle versus side scatter profile. These histograms are representative of 10 experiments. Anti-Fc receptor antibody was used to block nonspecific binding.
