

Abstract
We measured body weight and composition of ~10 male and ~10 female mice from 40 inbred strains. Body composition was assessed in ~16-wk old mice that had been individually housed and fed a high-carbohydrate, low-fat diet (AIN-76A) for the previous 8 wk. Carcass lean and fat weights were assessed using a PIXIMus II DEXA and confirmed by fat extraction assay. There was a nearly continuous range of body weights, from a strain mean±SE of 11.4±0.2 g (MSM/MsJ) to 39.3±1.8 g (NON/LtJ). The percentage of body weight that was fat (%Fat) ranged from 16±4% (C58/J) to 39±2% (NON/LtJ). In general, heavier strains had a higher %Fat (r=0.57) but several light strains were also quite fat (e.g., SPRET/EiJ, body weight= 15.7±0.6 g, %Fat=26±1%). Males were significantly heavier than females in 26 strains and significantly fatter than females in 9 strains; only the KK/H1J strain had fatter females than males. Some of the fattest strains are infrequently used in obesity experiments, for example the JF1/Ms and CBA/J strains. These data illustrate the diversity of body weight and composition in inbred mice. They will serve as a reference standard and assist in the selection of strains for future work.
Keywords: Body weight, Strain survey, Sex differences, Carcass composition
Identifying the genes and alleles underlying body size has posed a challenge. There are many genes involved [22,23] and the effect size of each is usually small [e.g., [15]]. Comparison of inbred mouse strains makes genetic effects obvious because mice within an inbred strain vary much less than do mice between strains [e.g., [13]]. Therefore, a detailed understanding of the variation within and between multiple strains is crucial to help identify alleles that contribute to body size and composition.
Several mouse strain surveys of body weight have been conducted [e.g., [1,13,15,35]] and some have also included measures of lean body mass or lipid content [e.g., [13]]. However, these studies have generally been limited to a subset of common laboratory mouse strains and thus do not capture the genetic diversity of currently available strains. Body weight records of ~20 inbred strain colonies at the Jackson Laboratory are available [27] but these are not ideal because measurements were made at different times from different colonies, with different husbandry, and there is no information about body composition, i.e., fat and lean weight.
The need for a comprehensive survey of body weight and composition has been recognized and is part of a larger effort to study a variety of mouse traits using a large, standard set of inbred strains [Mouse Phenome Project, [28]]. Forty strains have been selected for intensive study based on their frequency of use, genetic variety, and some practical considerations (i.e., cost and ease of breeding). Strain survey data for many traits are available electronically, and several strain surveys for body weight and composition are underway, although they are focused on disease, e.g., a high-cholesterol diet and atherosclerosis [17]. The current study was designed to measure the body weight and composition of healthy male and female mice fed a standard, high-carbohydrate, low-fat laboratory diet.
1. Methods
1.1. Mice
A total of 790 mice, comprising ~10 males and ~10 females of the following 40 strains were tested: 129S1/SvImJ, A/J, AKR/J, BALB/cByJ, BTBR T+tf/J, BUB/BnJ, C3H/HeJ, C57BL/10J, C57BL/6J, C57BLKS/J, C57BR/cdJ, C57L/J, C58/J, CAST/EiJ, CBA/J, CE/J, CZECHII/EiJ, DBA/2J, FVB/NJ, I/LnJ, JF1/Ms, KK/H1J, LP/J, MA/MyJ, MOLF/EiJ, MSM/MsJ, NOD/LtJ, NON/LtJ, NZB/B1NJ, NZW/LacJ, PERA/EiJ, PL/J, PWK/PhJ, RIIIS/J, SEA/GnJ, SJL/J, SM/J, SPRET/EiJ, SWR/J, and WSB/EiJ. The mice were bred by The Jackson Laboratory and shipped to our institution when they were ~8 wk old. Because of supply problems, a few mice were slightly older or younger [see [30] for details].
While at The Jackson Laboratory, the mice were housed in same-strain groups and fed Purina 5K52 or 5K54 diet. These are cereal-based diets containing by weight ~18% protein and ~6% fat (5K52) or ~4% fat (5K54). After they arrived at our institution, the mice were individually housed in plastic “tub” cages and fed AIN-76A diet. This is a semisynthetic diet containing by weight 20% protein (casein), 65% carbohydrate (sucrose and cornstarch), 5% fat (corn oil), and 10% fiber (cellulose), minerals and vitamins. It has an energy content of ~15.9 kJ/g [Dyets, cat. No 100000; [9]]. After 6–10 days to habituate to laboratory conditions, all the mice received a series of 13 48-h two-bottle preference tests as part of other experiments [see [31,33]]. They also had a 40-µl sample of blood collected after excision of the tip of the tail [all procedures are described in detail elsewhere [30]]. There is no reason to suspect that these procedures influenced body weight or composition: The taste tests involved drinking non-caloric sodium or calcium solutions and the mice always had water so they were never forced to drink them. The amounts of sodium and calcium ingested from taste solutions were trivial compared with the amounts ingested daily in the AIN-76A diet. Chronic access to similar solutions for several weeks does not influence body weight or body composition of C57BL/6J mice or Sprague Dawley rats [[40] and unpublished results].
It was not practical to test simultaneously the 790 mice involved in this experiment. Instead, they were tested in five squads of 188, 170, 135, 186, and 111 mice, conducted over a 12-month period in October 2001–2002. The primary consideration determining which mice were tested in which squad was their availability, so the more common strains were tested in the earlier replications and the rarer and more difficult to breed strains were tested later. Details of which mice were tested in which replication are provided on-line, along with a detailed description of mouse husbandry, housing conditions, and other procedures [29,30]. We did not attempt to control for seasonal effects.
1.2. Phenotypes
After 45 days in our laboratory, at which time the mice were ~16 wk old, each mouse was anesthetized with 70 mg/kg ketamine +10 mg/kg xylazine (5 ml/kg) and as much blood as possible (400–1400 µl) was removed by cardiac puncture (for another experiment). The dead mouse was then wrapped in aluminum foil and frozen at −80 °C for several months.
Frozen carcasses were allowed to thaw at room temperature for ~1 h and were then analyzed using a PIXIMus II mouse densitometer (#51601; GE Medical Systems Lunar, Madison, WI). The PIXImus II uses low energy X-rays to produce high-resolution (0.18 × 0.18 mm pixel) images. Software included with the machine identifies and estimates the density and weight of lean tissue, fat tissue, and bone.
Each carcass was laid out in the prone position on a plastic tray. The limbs were held splayed apart with tape. The tail was displaced to the mouse’s left so that it was within the X-ray field but did not overlap a limb. Because the cone-beam X-ray field is only 80 × 65 mm and thus too small to fit a large adult mouse, the head of each mouse was excluded from analysis; it was either placed outside the X-ray field or masked using software. The PIXIMus II was calibrated daily using a plastic “mouse phantom” provided by the manufacturer.
The following data were provided by the machine: weight of lean tissue (LeanWt, g), weight of fat tissue (FatWt, g), total body weight (BWt, g; the sum of LeanWt+FatWt), and the percentage of carcass weight accounted for as fat (%Fat; i.e., FatWt/BWt × 100). Bone mineral density and content were also provided and these results are presented elsewhere [31].
Several procedures were used to assess the reliability and validity of the DEXA measurements. First, body weights of the 790 mouse carcasses measured with a top-loading balance (accuracy; ±0.1 g) were compared with those calculated by the PIXIMus II. The Pearson correlation coefficient was r=0.995 and overall means (±SD) were almost identical (23.5±0.7 g for the top-loading balance versus 23.3±0.3 g for the PIXIMus II). Second, a randomly chosen subset of two male and two female mice from each strain (total n=160) was reanalyzed with the PIXIMus II several weeks later (after a second cycle of freezing and thawing). The following test–retest reliability coefficients were obtained: BWt = 0.98, LeanWt = 0.98, FatWt = 0.98, %Fat = 0.97. Estimates of precision [i.e., the difference between the initial test and retest [25]] ranged from −2.9% to 2.2%. Third, the body fat composition of the same 160 mice was analyzed directly, using a method adapted from that of Ramirez [21]. Each carcass (including the head) was shaved, autoclaved, homogenized in water, and then dried to a constant weight. Approximately 2 g of the dried tissue was dissolved in petroleum ether, centrifuged, and the aspirate removed. This procedure was repeated two more times, and the loss in weight of the remaining, dried tissue was used as an estimate of fat content. The correlation between percentage fat determined by this extraction procedure and by DEXA was r=0.95 (n=160).
1.3. Analysis of strain means
Data for each of the four traits provided by DEXA were analyzed separately. Differences among strains and between sexes were determined using ANOVAs, with factors of Strain and Sex. Differences between the sexes of a particular strain, or between strains, were determined using Tukey’s tests. The criterion for significance of these analyses was set at p<0.01.
Estimates of heritability for each sex separately, and for both sexes combined, were calculated based on the ratio of SSamong strains/SStotal where SS is the sum of squares obtained in a one-way ANOVA [2]. To characterize the degree of relatedness between measurements, Pearson correlation coefficients were calculated based on the means for each sex and strain.
2. Results
Fig. 1–Fig. 4 show means (±SEMs) of each strain and sex for the four traits measured by densitometry. For all four traits, there were highly significant differences among strains, between sexes, and Strain × Sex interactions (all p’s <0.0000001). Because of the significant interactions, comparisons among strains were made separately for each sex. All traits had a more-or-less continuous distribution of strain means across the range of values. There were between 9–22 overlapping homogenous groups (i.e., strains that did not differ significantly from each other according to Tukey’s tests). To provide a more concise and simple identification of outlying strains, we calculated 95% confidence intervals based on the mean of the 40 strain means (i.e., overall mean±1.96 × standard error of the means), and used these as criteria to recognize strains with unusually high or low phenotypes. Data for individual mice and comparisons of means with other phenotypes are available as part of the Mouse Phenome Database, Project 103 [30]. Heritability estimates are shown in Table 1.
Fig. 1.

Mean±SEM carcass body weight (BWt) of male (▶) and female (◀) mice from 40 strains, age ~16 wk. Strains are arranged in order from lowest to highest average body weight of males. Vertical shaded bars are 95% confidence intervals from the overall mean for females (left bar) and males (right bar). Horizontal lines are standard errors of the mean; these are smaller than the symbols in most cases.
Fig. 4.
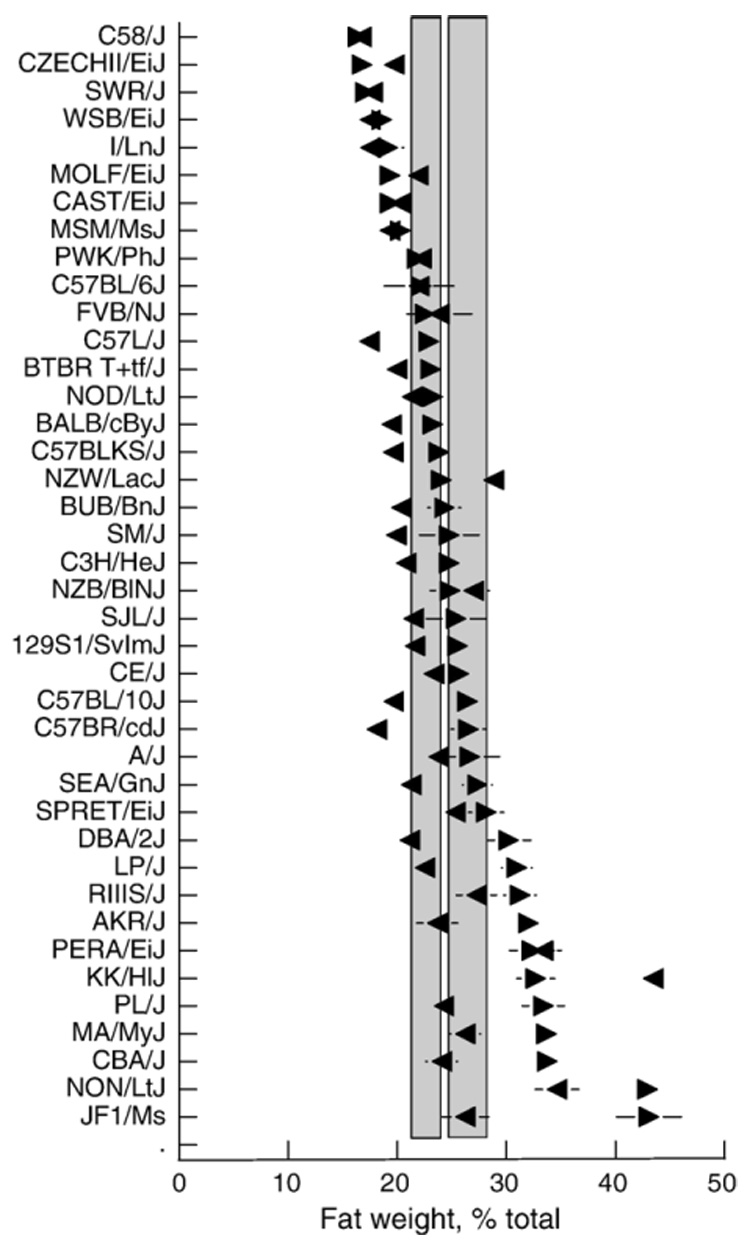
Mean±SEM proportion of carcass weight that is fat (%Fat) of male (▶) and female (◀) mice from 40 strains, age ~16 wk. Strains are arranged in order from lowest to highest average percent fat weight of males. Vertical shaded bars are 95% confidence intervals from the overall mean for females (left bar) and males (right bar). Horizontal lines are standard errors of the mean; these are smaller than the symbols in most cases.
Table 1.
Heritability estimates for measures of body weight and composition
| Measure | Both sexes | Males only | Females only |
|---|---|---|---|
| Body weight | 0.64 | 0.86 | 0.88 |
| Lean weight | 0.68 | 0.88 | 0.87 |
| Fat weight | 0.58 | 0.79 | 0.84 |
| %Fat | 0.52 | 0.69 | 0.68 |
Notes: Heritability estimates are based on the ratio of SSamong strains/SStotal. ·%Fat = Fat weight/Body weight × 100. Heritability for both sexes is noticeably lower than heritability for each sex alone, presumably because the variation between sexes increases total variation.
2.1. Body weight
In males, the range of BWt strain means extended from 12.2±0.9 g (MSM/MsJ) to 46.8±0.9 g (NON/LtJ) and the overall mean of the 40 strains was 26.3 g. Males of the NON/ LtJ strain were markedly heavier than those of all the other strains. Other heavyweights included the AKR/J, BUB/BnJ, BTBR T+tf/J, CBA/J, KK/H1J, and NZB/B1NJ males. The male PWK/PhJ mice and a group of six “wild-derived” strains (CAST/EiJ, CZECHII/EiJ, MOLF/EiJ, MSM/MsJ, SPRET/EiJ, WSB/EiJ) had the lowest body weights.
In females, the range of BWt strain means extended from 10.1±0.9 g (MSM/MsJ) to 40.4±0.9 g (KK/H1J) and the overall mean of the 40 strains was 20.1 g. The KK/H1J females were noticeably heavier than females of all the other strains. The NON/LtJ females were also noticeably heavier than all the other strains except the KK/H1J females. The BTBR T+tf/J, BUB/BnJ, NZB/B1NJ and NZW/LacJ strains were also heavy-weights. The lightest females were the same six wild-derived strains that formed the lightest group of males.
BWt was significantly higher in males than females of 26 strains. There were no significant sex difference in BWt for the other 14 strains (129S1/SvlmJ, A/J, C58/J, CAST/EiJ, CZECHII/EiJ, KK/H1J, MOLF/EIJ, MSM/MsJ, NZW/LacJ, PERA/EiJ, PWK/PhJ, SPRET/EiJ, SWR/J and WSB/EiJ). In no strain were females significantly heavier than males.
2.2. Lean weight
Male mice LeanWt strain means ranged from 9.8±0.5 g (MSM/MsJ) to 26.7±0.5 g (NON/LtJ), and the overall mean of the 40 strains was 19.1 g. The males with the highest LeanWt were the AKR/J, BTBR T+tf/J, BUB/BnJ, KK/H1J, NON/LtJ and NZB/B1NJ strains. The male mice with the lowest LeanWt were the PWK/PhJ and six wild-derived strains.
Female mice LeanWt strain means ranged from 8.2±0.5 g (MSM/MsJ) to 22.8±0.5 g (KK/H1J) and the overall mean of the 40 strains was 15.2 g. Females with high LeanWt included the BTBR T+tf/J, BUB/BnJ, KK/H1J, NON/LtJ and NZW/LacJ strains. The females with the lowest LeanWt were the JF1/Ms and 6 wild-derived strains.
In 26 strains, males had significantly higher LeanWt than did females. The following 14 strains did not differ between the sexes: 129S1/SvImJ, A/J, C58/J, CAST/EiJ, CZECHII/EiJ, KK/H1J, MOLF/EiJ, MSM/MsJ, NZW/LacJ, PWK/PhJ, SEA/GnJ, SM/J, SPRET/EiJ and WSB/EiJ.
2.3. Fat weight
Male mice FatWt strain means ranged from 2.4±0.5 g (CZECHII/EiJ) to 20.1±0.5 g (NON/LtJ) and the overall mean of the 40 strains was 7.2 g. The NON/LtJ males had quite dramatically more FatWt than did other males. Of the remainder, the AKR/J, CBA/J, JF1/Ms and KK/H1J males had the highest FatWt. There were 14 strains (including the 6 wild-derived strains) with FatWt below the 95th percentile confidence interval of the overall mean.
Female mice FatWt strain means ranged from 2.0±0.5 g (MSM/MsJ) to 17.6±0.5 g (KK/H1J) and the overall mean of the 40 strains was 4.8 g. The KK/H1J females had considerably more FatWt than did other strains, and the NON/LtJ females had more FatWt than did any of the other strains except the KK/H1J females. The AKR/J, NZB/B1NJ, NZW/LacJ, PERA/EiJ and RIIIS/J strains all had FatWt above the 95th percentile confidence interval. There were 15 strains with female means below the 95th percentile confidence interval.
There were 12 strains that showed significant sex differences in FatWt, with males having more fat than females in 11 cases: AKR/J, C57BL/10J, C57BR/cdJ, CBA/J, DBA/2J, JF1/Ms, LP/J, MA/MyJ, NON/LtJ, PL/J, and SEA/GnJ. The exception was the KK/H1J strain, in which females had significantly more FatWt than did males. FatWt in the remaining 28 strains did not differ between the sexes.
2.4. % Fat
The %Fat of male mice strain means ranged from 16.4±1.4% (C58/J) to 43.1±1.3% (JF1/Ms) and the overall mean of the 40 strains was 26.0%. The fattest males (by percentage of carcass weight) were those from the JF1/Ms and NON/LtJ strains although 10 other strains fell above the upper 95% confidence interval. There were 17 strains that fell below the lower 95% confidence interval.
Female mice %Fat strain means ranged from 16.7±1.4% (C58/J) to 43.5±1.3% (KK/H1J) and the overall mean of the 40 strains was 22.9%. The KK/H1J females had markedly higher %Fat than did any of the other females. Nine strains fell above the upper 95% confidence interval and 17 fell below the lower 95% confidence interval.
There were no significant differences between the sexes in %Fat for most strains. However, for 9 strains, males had a significantly higher %Fat than did females (AKR/J, C57BR/cdJ, CBA/J, CE/J, DBA/2J, JF1/Ms, LP/J, NON/LtJ, and PL/J). Females had a significantly higher %Fat than did males in the KK/H1J strain only.
2.5. Correlations among traits
Fig. 5 shows scatter plots and Pearson correlation coefficients for each combination of the four measures of body composition, with separate correlation coefficients calculated for each sex. The correlation coefficients for means based on both sexes combined were generally intermediate between or slightly lower than those of each sex calculated separately. Significant correlations (at the p <0.01 level) were found for all comparisons except those between LeanWt and Fat%. There were notably strong correlations between BWt and LeanWt (r=0.94 for both sexes).
Fig. 5.

Scatter plots and Pearson correlation coefficients of 40 strain mean values for males (in blue) and females (in pink) for each combination of four measures of body composition. Fat, %=body fat content as a proportion of carcass weight. All correlations were highly significant (p<0.001) except those between lean weight and fat, %.
3. Discussion
We measured body weight and composition of 16-wk old male and female mice from 40 inbred strains. There was a fourfold range in body weight across strains, a three-fold range in lean weight, a ten-fold range in fat weight, and almost a threefold range in percent fat. Mice raised with the same diet, in the same types of cages, with the same husbandry procedures can have a remarkable range of body size and composition.
Most of the variation across strains in body weight could be explained by genetic effects. The heritability estimate for body weight found here (i.e., 0.86) was almost identical to the value from another study conducted in our laboratory involving 28 strains of male mice [i.e., 0.87 [1]] and similar or even higher correlations are present between these and other, smaller studies contributed to the Mouse Phenome Database [28]. Although effort was made to reduce the effects of unique environment in this study, approximately 10–20% of the variance in body size was accounted for by this factor. The unexplained environmental variation is unlikely to be due to measurement error because we obtained nearly identical results using two measurements of body weight and fatness (DEXA and chemical analysis). A more likely contributor to the unexplained variance is litter size. Mice with fewer siblings are larger on average than those with more siblings [8]; we did not attempt to control for this variable. On the other hand, litter size is partially determined by genetic effects [12] so equating it across inbred strains might dilute legitimate heritability.
The discovery of epigenetic effects for traits like coat color, obesity and body size has challenged traditional approaches used to assess genetic and non-genetic effects [34]. For instance, embryos exposed in utero to a high-fat, high-density diet are fatter as adults than those of identical genotype that are not exposed [39]. Therefore, some of the effects on body weight attributed to genetics could be due to non-genetic maternal effects, such as nutrition during pregnancy. This confound is well known [4,11,37], but how to parse maternal from genetic effects is not clear [26]. In the current study, no attempt was made to control for these effects by embryo transfer or cross-fostering.
Heavier mice are usually heavier because they are fatter. This generalization was true in the present experiment both for grams of the carcass as fat and for fatness expressed as a percent of body weight. In other words, most light mice had very little fat whereas heavy mice were almost half fat by weight. There were exceptions: for instance, the JF1/Ms strain was light and fat, ranking 21st in weight but 1st out of 40 in percent fat. The other extreme was exemplified by the BTBR T+tf/J strain, which was heavy but lean, ranking 5th in body weight but 28th out of 40 in percent fat.
Some studies report sex-dependent QTLs that affect body weight or fatness [e.g., [24]]. To the best of our knowledge, no studies have intentionally crossed mice that have discordant male–female differences in obesity, and so the genetics of sex differences in fatness are not well understood. The data collected here could be used to examine these differences more systematically. Two strains stand out in this regard; females are fatter than males in the KK/H1J strain and vice versa in the JF1/Ms strain.
Early mouse investigators noticed that some inbred strains were fatter than others and thus these strains were used as models of polygenic obesity, [e.g., the KK strain [13]]. In other studies, two strains were chosen, usually because of their dissimilarity in weight, and their genotypes and phenotypes compared [e.g. small versus large growth mice, SM/J and LG/J; e.g., [10], A/J and C57BL/6J, e.g., [7], SWR/J and AKR/J, e.g., [36]]. However, none of these classic strain pairings involve the strains most different in body weight or fatness among the 40 strains tested here. Our results suggest new QTL studies that explore pairings of inbred strains with the most extreme phenotypes.
To some extent, the same criticism can be leveled at the Collaborative Cross [6,38]. This ambitious effort to produce >1000 advanced recombinant inbred strains is based on 8 founder strains of which 7 were tested here (129S1/SvImJ, A/J, C57BL/6J, NOD/LtJ, CAST/EiJ, PWK/PhJ, WSB/EiJ). These all fall in the low-to-mid range of the body weight spectrum and encompass barely half the variation in body weight found in our 40-strain panel [e.g., male mean body weights, lowest=CAST/EiJ (13.8±0.2 g); highest=NOD/LtJ (28.3±0.7 g)]. It is likely that some heavy body weight genes will be provided by the founder strain we did not test, NZO/HILtJ, which is characteristically obese [14]. Thus, the Collaborative Cross may prove useful for identifying some body weight genes although alleles of genes with the largest effects on body weight are likely to originate from a single strain.
We found little relationship between the genetic origins of individual mouse strains and their body size. The lightest strains were derived from mice usually characterized as wild-caught (i.e., CAST/EiJ, CZECHII/EiJ, MOLF/EiJ, MSM/MsJ, SPRET/EiJ, WSB/EiJ) but these are among the most genetically unrelated strains available according to SNP parsimony analysis [19]. The heaviest mice were originally from Japan and New Zealand (i.e., NON/LtJ, KK/H1J, NZB/BINJ) and these too are not particularly closely related, although they cluster into the same branch of the mouse family tree [see [19]].
Genome-wide haplotype analysis of inbred strains has been reported to identify quantitative trait loci [e.g., [16,19,20]] and we attempted to use the data collected here to do this [32]. However, consistent with other investigators [5,18], we found these approaches are underpowered and prone to false positives. We suspect that inbred strain haplotype analysis will be useful for assessing the contribution of candidate genes once these have been identified but de novo gene identification will require even more than 40 strains to be useful.
Another reason to examine more strains is that the 40 tested here do not encompass all the available genetic diversity. There are ~400 inbred mouse strains available for study, and some produced by selective breeding can be up to 30 g heavier than the heaviest strain tested here [3]. With the sequencing of the mouse genome and expanding resources available for scientists using mice as model organisms, there is a need for body size and composition data from the wide variety of currently available mouse strains.
Finally, we stress that the results found here are a single snapshot of mice at a particular age, fed a particular diet, and raised under particular conditions. There are unmet needs for longitudinal body composition studies and for comparisons of inbred mice fed diets with other macronutrient compositions and higher energy content. Nevertheless, the data presented here [and available on-line [30]] will serve as a comprehensive reference standard for body size and composition of mice fed a “normal” laboratory diet.
Fig. 2.
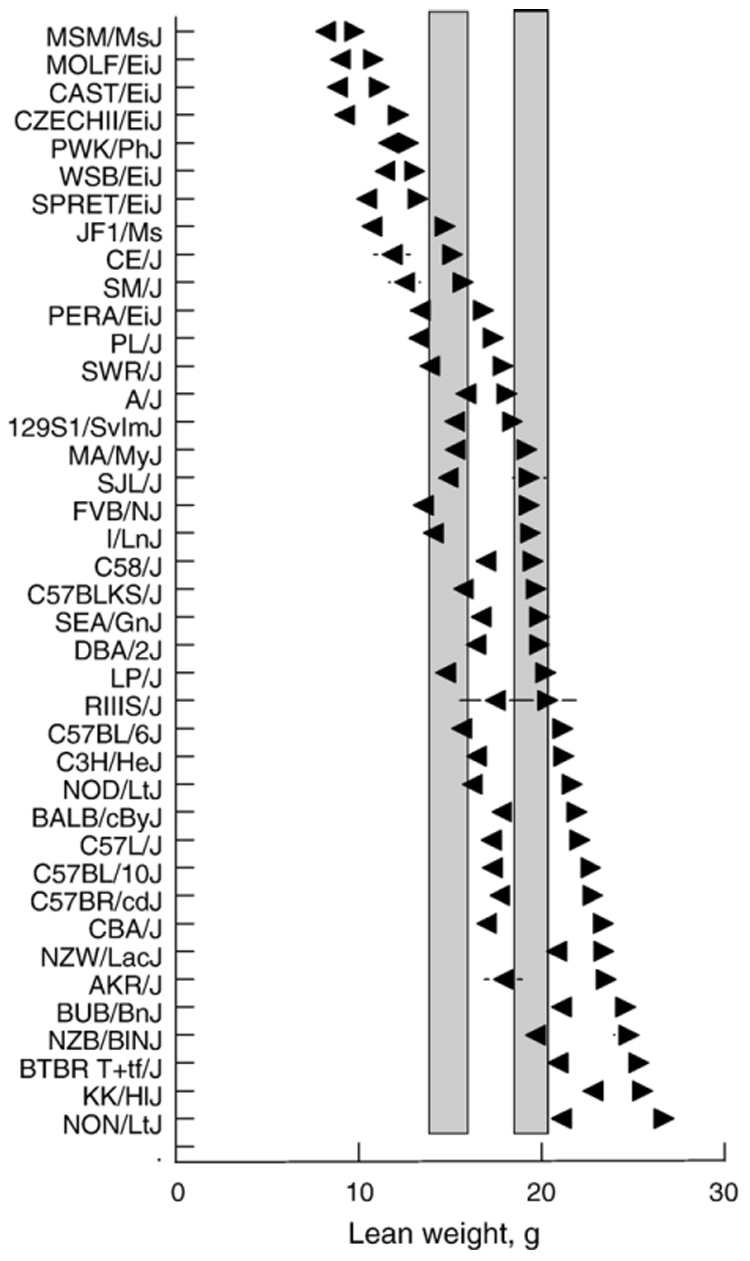
Mean±SEM weight of lean tissue (LeanWt) from carcasses of male (▶) and female (◀) mice from 40 strains, age ~16 wk. Strains are arranged in order from lowest to highest lean weight of males. Vertical shaded bars are 95% confidence intervals from the overall mean for females (left bar) and males (right bar). Horizontal lines are standard errors of the mean; these are smaller than the symbols in most cases.
Fig. 3.

Mean±SEM weight of adipose tissue (FatWt) from carcasses of male (▶) and female (◀) mice from 40 strains, age ~16 wk. Strains are arranged in order from lowest to highest fat weight of males. Vertical shaded bars are 95% confidence intervals from the overall mean for females (left bar) and males (right bar). Horizontal lines are standard errors of the mean; these are smaller than the symbols in most cases.
Acknowledgements
Funding for this study was provided by NIH grants DK-46791 (MGT) and DK-58797 (DRR). The mice were provided by the Mouse Phenome Project, as a competitive award funded by AstraZeneca. The PIXIMus II DEXA was provided by funds obtained under a grant with the Pennsylvania Department of Health. The Department specifically disclaims responsibility for any analyses, interpretations or conclusions of this study. Technical help was provided by Diane Pilchak, Erica A. Byerly, and Samantha A. Doman.
References
- 1.Bachmanov AA, Reed DR, Beauchamp GK, Tordoff MG. Food intake, water intake, and drinking spout side preference of 28 mouse strains. Behav Genet. 2002;32:435–443. doi: 10.1023/a:1020884312053. [DOI] [PMC free article] [PubMed] [Google Scholar]
- 2.Belknap JK. Effect of within-strain sample size on QTL detection and mapping using recombinant inbred mouse strains. Behav Genet. 1998;28:29–38. doi: 10.1023/a:1021404714631. [DOI] [PubMed] [Google Scholar]
- 3.Bunger L, Laidlaw A, Bulfield G, Eisen EJ, Medrano JF, Bradford GE, et al. Inbred lines of mice derived from long-term growth selected lines: unique resources for mapping growth genes. Mamm Genome. 2001;12:678–686. doi: 10.1007/s00335001-3018-6. [DOI] [PubMed] [Google Scholar]
- 4.Castle WE. Size inheritance. Am Nat. 1941;75:488–498. [Google Scholar]
- 5.Chesler EJ, Mogil JS, Williams RW. SNP haplotype mapping with inbred strains. 2002 http:// www.nervenet.org/xlfiles/SNP/CheslerSNPMapper.xls.
- 6.Churchill GA, Airey DC, Allayee H, et al. The Collaborative Cross, a community resource for the genetic analysis of complex traits. Nat Genet. 2004;36:1133–1137. doi: 10.1038/ng1104-1133. [DOI] [PubMed] [Google Scholar]
- 7.Collins S, Martin TL, Surwit RS, Robidoux J. Genetic vulnerability to diet-induced obesity in the C57BL/6J mouse: physiological and molecular characteristics. Physiol Behav. 2004;81:243–248. doi: 10.1016/j.physbeh.2004.02.006. [DOI] [PubMed] [Google Scholar]
- 8.Cowley DE, Pomp D, Atchley WR, Eisen EJ, Hawkins-Brown D. The impact of maternal uterine genotype on postnatal growth and adult body size in mice. Genetics. 1989;122:193–203. doi: 10.1093/genetics/122.1.193. [DOI] [PMC free article] [PubMed] [Google Scholar]
- 9.Dyets Inc. 100000 AIN-76A Purified rodent diet. 2003 http://www.dyets.com/100000.htm.
- 10.Ehrich TH, Kenney JP, Vaughn TT, Pletscher LS, Cheverud JM. Diet, obesity, and hyperglycemia in LG/J and SM/J mice. Obes Res. 2003;11:1400–1410. doi: 10.1038/oby.2003.189. [DOI] [PubMed] [Google Scholar]
- 11.Eisen EJ, Legates JE, Robison OW. Selection for 12-day litter weight in mice. Genetics. 1970;64:511–532. [PMC free article] [PubMed] [Google Scholar]
- 12.Falconer DS. The genetics of litter size in mice. J Cell Comp Physiol. 1960;56 Suppl 1:153–167. doi: 10.1002/jcp.1030560414. [DOI] [PubMed] [Google Scholar]
- 13.Festing MFW. The inheritance of obesity in animal models of obesity. In: Festing MFW, editor. Animal models of obesity. vol. 1. New York: Oxford University Press; 1979. pp. 15–37. [Google Scholar]
- 14.Festing MFW. Inbred strains of mice. The Jackson Laboratory; 1998. http://www.informatics.jax.org/external/festing/mouse/INTRO.shtml. [Google Scholar]
- 15.Gruneberg H. The genetics of the mouse. Cambridge: Cambridge University Press; 1943. [Google Scholar]
- 16.Grupe A, Germer S, Usuka J, Aud D, Belknap JK, Klein RF, et al. In silico mapping of complex disease-related traits in mice. Science. 2001;292:1915–1918. doi: 10.1126/science.1058889. [DOI] [PubMed] [Google Scholar]
- 17.Naggert JK, Paigen B, Svenson KL, Peters LL. Diet effects on bone mineral density and content, body composition, and plasma glucose, leptin, and insulin levels (MPD:143) Mouse Phenome Database. 2004 http://aretha.jax.org/pub-cgi/phenome/mpdcgi?rtn=projects/details&id=143.
- 18.Payseur BA. In: Prospects for haplotype-based mapping across classical inbred mouse strains. French J, Threadgill DW, editors. NC: Chapel Hill; 2006. p. 40. [Google Scholar]
- 19.Petkov PM, Ding Y, Cassell MA, Zhang W, Wagner G, Sargent EE, et al. An efficient SNP system for mouse genome scanning and elucidating strain relationships. Genome Res. 2004;14:1806–1811. doi: 10.1101/gr.2825804. [DOI] [PMC free article] [PubMed] [Google Scholar]
- 20.Pletcher MT, McClurg P, Batalov S, Su AI, Barnes SW, Lagler E, et al. Use of a dense single nucleotide polymorphism map for in silico mapping in the mouse. PLoS Biol. 2004;2:e393. doi: 10.1371/journal.pbio.0020393. [DOI] [PMC free article] [PubMed] [Google Scholar]
- 21.Ramirez I. Physiological and biochemical measurements in relation to feeding. In: Toates FM, Rowland NE, editors. Feeding and drinking. Amsterdam: Elsevier; 1987. pp. 443–460. [Google Scholar]
- 22.Rankinen T, Zuberi A, Chagnon YC, Weisnagel SJ, Argyropoulos G, Walts B, et al. The human obesity gene map: the 2005 update. Obesity (Silver Spring) 2006;14:529–644. doi: 10.1038/oby.2006.71. [DOI] [PubMed] [Google Scholar]
- 23.Reed DR, Lawler MP, Tordoff MG. Reduced body weight is a common effect of gene knockout. Boston, MA: North American Association for the Study of Obesity; 2006. [Google Scholar]
- 24.Reed DR, Li X, McDaniel AH, Lu K, Li S, Tordoff MG, et al. Loci on chromosomes 2, 4, 9 and 16 for body weight, body length and adiposity identified in a genome scan of an F2 intercross between the 129P3/J and C57BL/6ByJ mouse strains. Mamm Genome. 2003;14:302–313. doi: 10.1007/s00335-002-2170-y. [DOI] [PMC free article] [PubMed] [Google Scholar]
- 25.Reed DR, Price RA. Estimates of the heights and weights of family members: accuracy of informant reports. Int J Obes Relat Metab Disord. 1998;22:827–835. doi: 10.1038/sj.ijo.0800666. [DOI] [PubMed] [Google Scholar]
- 26.Reifsnyder PC, Churchill G, Leiter EH. Maternal environment and genotype interact to establish diabesity in mice. Genome Res. 2000;10:1568–1578. doi: 10.1101/gr.147000. [DOI] [PMC free article] [PubMed] [Google Scholar]
- 27.The Jackson Laboratory. Body weights for selected strains, by age (MPD 36) Mouse phenome database web site. 2000 http://phenome.jax.org/pub-cgi/phenome/mpdcgi?rtn=projects/details&sym=Jax1.
- 28.The Jackson Laboratory. Mouse phenome database web site. 2001 http://www.jax.org/phenome.
- 29.Tordoff MG, Bachmanov AA. Monell mouse taste phenotyping project. Monell Chemical Senses Center; 2001. www.monell.org/MMTPP. [Google Scholar]
- 30.Tordoff MG, Bachmanov AA. Survey of calcium and sodium intake and metabolism with bone and body composition data (MPD:103) Mouse Phenome Project. 2002 http:// phenome.jax.org/pub-cgi/phenome/mpdcgi?rtn=projects/details&id=103.
- 31.Tordoff MG, Bachmanov AA, Reed DR. Forty mouse strain survey of voluntary calcium intake, blood calcium, and bone mineral content. Physiol Behav 2007-this issue. doi: 10.1016/j.physbeh.2007.03.027. doi:10.1016/j.physbeh.2007.03.027. [DOI] [PMC free article] [PubMed] [Google Scholar]
- 32.Tordoff MG, Doman SA, Byerly EA, Pilchak DM, Bachmanov AA, Reed DR. Genetic loci related to bone and body composition identified by genotype-phenotype association of 40 inbred mouse strains. Appetite. 2004;42:403. [Google Scholar]
- 33.Tordoff MG, Reed DR, Bachmanov AA. Forty mouse strain survey of water and sodium intake. Physiol Behav 2007-this issue. doi: 10.1016/j.physbeh.2007.03.025. doi:10.1016/j.physbeh.2007.03.025. [DOI] [PMC free article] [PubMed] [Google Scholar]
- 34.Waterland RA, Jirtle RL. Transposable elements: targets for early nutritional effects on epigenetic gene regulation. Mol Cell Biol. 2003;23:5293–5300. doi: 10.1128/MCB.23.15.5293-5300.2003. [DOI] [PMC free article] [PubMed] [Google Scholar]
- 35.West DB, Waguespack J, McCollister S. Dietary obesity in the mouse: interaction of strain with diet composition. Am J Physiol. 1995;268:R658–R665. doi: 10.1152/ajpregu.1995.268.3.R658. [DOI] [PubMed] [Google Scholar]
- 36.West DB, Waguespack J, York B, Goudey-Lefevre J, Price RA. Genetics of dietary obesity in AKR/J X SWR/J mice: segregation of the trait and identification of a linked locus on Chromosome 4. Mamm Genome. 1994;5:546–552. doi: 10.1007/BF00354928. [DOI] [PubMed] [Google Scholar]
- 37.White JM, Legates JE, Eisen EJ. Maternal effects among lines of mice selected for body weight. Genetics. 1968;60:395–408. doi: 10.1093/genetics/60.2.395. [DOI] [PMC free article] [PubMed] [Google Scholar]
- 38.Williams RW, Broman KW, Cheveraud JM, Churchill GA, Hitzemann RW, Hunter KW, et al. Collaborative cross for high-precision complex trait analysis. 2002 www.complextrait.org/Workshop1.pdf.
- 39.Wu Q, Suzuki M. Parental obesity and overweight affect the body-fat accumulation in the offspring: the possible effect of a high-fat diet through epigenetic inheritance. Obes Rev. 2006;7:201–208. doi: 10.1111/j.1467-789X.2006.00232.x. [DOI] [PubMed] [Google Scholar]
- 40.Zhang Q, Tordoff MG. No effect of dietary calcium on body weight of lean and obese mice and rats. Am J Physiol. 2004;286:R669–R677. doi: 10.1152/ajpregu.00655.2003. [DOI] [PubMed] [Google Scholar]