

Abstract
A multiple case study was conducted to examine how staff in child out-of-home care programs used data from an Outcomes Management System (OMS) and other sources to inform decision-making. Data collection consisted of thirty-seven semi-structured interviews with clinicians, managers, and directors from two treatment foster care programs and two residential treatment centers, and individuals involved with developing the OMS; and observations of clinical and quality management meetings. Case study and grounded theory methodology guided analyses. The application of qualitative data analysis software is described. Results show that although staff rarely used data from the OMS, they did rely on other sources of systematically collected information to inform clinical, quality management, and program decisions. Analyses of how staff used these data suggest that improving the utility of OMS will involve encouraging staff to participate in data-based decision-making, and designing and implementing OMS in a manner that reflects how decision-making processes operate.
Introduction
There is a growing recognition that child behavioral healthcare organizations need to use a range of outcome and process measures in order to provide accountability, guide quality improvement processes, and assess the effectiveness of care.1,2 Initiatives such as the Mental Health Statistics Indicator Project (MHSIP) and the Child Outcome Roundtable have sought to establish a standard set of measures usable across organizations.3,4 Empirical evidence indicates that providing clinicians with direct feedback regarding client mental health treatment outcomes can inform clinical decision-making and lead to improvements in care.5-7 In response to these external pressures and perceived benefits, initiatives to develop and adopt Outcome Management Systems (OMS) are becoming more common in child and adolescent mental health service settings. Many initiatives have developed in both the United States and Canada, including in Ontario,8,9 Pressley Ridge in Pennsylvania,10 Texas Children’s Mental Health Plan,11 Virginia,12,13 Michigan,14,15 and California.16
These efforts typically entail the ongoing collection, management, analysis, and dissemination of client outcomes information, requiring a substantial investment of resources. Yet, little is known about the success of OMS efforts to inform decision-making.17 Most child and adolescent mental health practitioners express interest in receiving outcomes-related information regarding their clients.18 However, ensuring that the information is actually used has proven to be more difficult than anticipated. Child and adolescent clinicians mandated to collect client outcomes data have reported that they largely did not use the data because they found the measures burdensome, difficult to interpret, and expressed skepticism regarding the validity of the information.16
The discrepancy between clinicians’ expressed interest and the difficulties they experienced using outcomes data may reflect the complexities of providing information in a manner that is relevant to different types of staff,19 as well as the challenges of integrating the OMS into routine practice.20,21 Moreover, how such information is used for clinical decision making is not well understood.11
This qualitative study was conducted to address these issues. Specifically, it examines how clinicians, managers, and executive directors in out-of-home care treatment settings used data from an OMS and other sources to inform their decisions. Nationally, over 700,000 children and adolescents per year are placed in such programs, which are resource intensive, expensive, and more restrictive than any other setting except inpatient care.22,23 The evidence base regarding the effectiveness of such programs is limited,23 though OMS have helped identify the types of problems experienced by youth that residential care can successfully address.24,25 In order to identify conditions that support and hinder the use of OMS within these settings, a “thick description”26 of how staff used data to inform organizational and individual decision-making was developed. This description was based upon observations of decision-making processes and participants’ experiences using an OMS and other types of data, as recounted using their own words.27 This article also addresses the need for more complete, transparent accounts of how Qualitative Data Analysis (QDA) software is used in actual research.28 The application of QDA software is illustrated using the findings of this study.
Methods
Study context
The Maryland Association of Resources for Families and Youth (MARFY), a professional association representing 55 private-sector child and family service organizations in Maryland, supported the development of an Internet-based OMS through a stakeholder-driven process modeled after the Pressley Ridge System in Pennsylvania.10,29 MARFY conducted a survey of about 700 state and local public agency administrators and placement workers, parents, foster parents, educators, judiciary, law enforcement, clergy, advocates, service providers, and nonprofit agency board members to determine what types of outcomes for children in residential placements were most valuable. The results informed the design of the OMS which captures the following types of data: background information, including demographic characteristics, family history, behavioral and social issues, psychiatric diagnoses, treatment history; services provided; stability and restrictiveness of living environment; productivity in school and/or employment; antisocial activity; protection from harm; client satisfaction; and functioning, using the Child and Adolescent Functional Assessment Scale (CAFAS).30,31 Though the youth’s lead clinician typically collected data at admission, quarterly during treatment, and at discharge, reports from the OMS were only available on admissions and discharge data.
Study design
A multiple case study of two Residential Treatment Centers (RTCs) and two Treatment Foster Care (TFC) programs was conducted. Both settings serve children who have serious emotional or behavioral disorders; however, RTC and TFC programs differ in the intensity of services they offer, costs, and possibly in quality of care (U.S. DHHS, 1999).23 RTCs are psychiatric facilities that provide intensive treatment to children. TFCs provide case managers to monitor and deliver services to specially trained foster parents.
Multiple case study design enabled examining patterns of data usage at several levels32: by individual program, type of staff (e.g. front-line clinicians), and service type (RTC vs. TFC). Type of staff and service setting served as the main units of analyses, or “cases.” Different types of staff were considered to be embedded within their individual program which provided a particular set of services and treatment milieu. Thus, examinations of data use across different types of staff took into account their program context and service setting. Comparing patterns of data usage by type of service setting provided a means to examine the effects of different service delivery models on the use of outcomes management system data and other types of systematically collected information. Data utilization processes were also examined at the program level in order to describe variation in how data were used across the sites.
Thus, analyses were conducted at all three levels (program, staff type, and service type). However, this article is focused on the cross-case findings, a synthesis of how data utilization processes operated across the programs, by service setting and type of staff, rather than within any single program. Cross-case comparisons of data usage by service type and type of staff helped identify patterns and assess the consistency or “replication” of findings.32 Information from the individual cases illustrated the key findings and helped describe the variation in data usage across programs.33
Sampling for this study included the identification of organizations, programs, and individuals for participation. The selection of organizations was based upon the following criteria: (1) used the MARFY-developed OMS; (2) provided multiple services including a TFC and/or RTC program; and (3) interested in and able to participate in research on outcomes. Table 1 provides a profile of the participating programs. The programs were part of multi-service, fully accredited organizations. They varied in the number and age-range of the children served and consequently in the number of staff.
Table 1.
Profile of participating organizations
| Residential treatment center | Treatment foster care | |||||||
|---|---|---|---|---|---|---|---|---|
| Organization | Staff | No. of children served during year | Age | Percent of children male (%) | Staff | No. of children served during year | Age | Percent of children male (%) |
| A | – | – | – | – | 13 | 30 | 1–17 | 44 |
| B | 33 | 122 | 5–13 | 76 | 20 | 168 | 6–18 | 55 |
| C | 48 | 74 | 12–17 | 84 | – | – | – | – |
In consultation with key informants from the participating programs, a set of criteria for staff participation was developed. Staff members were selected based upon whether: (1) they collected OMS data or supervised staff that collected data; (2) they had knowledge of or experience with the implementation of the OMS; and (3) they could use outcomes data to inform their work. The types of staff were defined by their organizational roles: front-line clinical staff; supervisors of front-line staff who oversaw the program; quality management staff; and executive directors. Key informants helped identify staff who met these criteria. “Negative cases,” staff with experiences different from patterns identified through initial analyses, were sought in order to obtain a range of perspectives.34 Opportunistic sampling was also used to identify staff; for example, based upon their observed roles in treatment team meetings.34
A total of thirty-seven interviews were conducted with 34 participants including 3 executive directors, 13 program management staff (including program managers, clinical supervisors and medical directors), 9 front-line clinical staff, 7 quality management staff, and 2 staff from MARFY (the Director and a volunteer, a retired executive director of an RTC who had assisted in the development of the OMS).The Director of MARFY was interviewed three times and a quality management staff, a former MARFY employee who assisted in the development and implementation of the OMS, was interviewed twice. The criterion of redundancy—when previously heard themes are repeated across a number of interviews—guided the number of interviews conducted.34 As shown in Table 2, most of the participants were female, white, and worked in RTC programs. This reflects the demographic mix that exists within these programs and the larger size of RTC programs, which by regulation are required to have more staff.
Table 2.
Semi-structured interview participants
| Role | No. of interviews | No. of respondents | RTC (%) | Female (%) | White (%) |
|---|---|---|---|---|---|
| Front-line clinical staff | 9 | 9 | 33 | 78 | 100 |
| Program management/clinical supervisor | 13 | 13 | 69 | 54 | 85 |
| Quality management staff | 7 | 7 | 71 | 71 | 100 |
| Executive directors | 3 | 3 | 67 | 33 | 100 |
| MARFY | 5 | 2 | NA | 0 | 100 |
| Total | 37 | 34 | 56 | 59 | 94 |
Data collection
The data collected included both semi-structured interviews and direct observation. Tailored semi-structured field guides were developed for each type of staff interviewed. Each field guide covered the following topics: background and role of the interviewee; experiences using the OMS; the introduction and implementation of OMS; decision-making processes; the impact of regulations and accreditation; and the perceived challenges and successes of the OMS. Questions were tailored to obtain multiple perspectives on a similar topic. For example, clinicians were asked about how policies related to OMS impacted their work, whereas executive directors were asked how the OMS-related policies impacted their staff. Based upon analyses done during the early stages of data collection, questions were modified during the course of the study to examine issues in greater depth that were identified as important to understanding how data were used for decision-making.
The first author conducted all the interviews, and observed all treatment team and quality improvement meetings. Interviews lasted approximately 1 hour, were conducted in a private setting, and were audio-recorded and later transcribed. Field notes were taken to describe the interview context. The treatment team and quality improvement meetings were regularly scheduled meetings that would have occurred regardless of the investigator’s presence. Field notes were taken to describe the observed decision-making processes, including how decisions were made and what types of data were discussed. Institutional Review Board (IRB) approval was obtained from the appropriate university and organizational IRBs.
Data analysis and use of Qualitative Data Analysis (QDA) software
The analytic framework applied consisted of the following: data management, data display and review, data reduction, drawing conclusions, and verifying conclusions.35 This section will describe how QDA software was used at each step of the framework. The findings will be also used to illustrate the analytic process. Though this project used Atlas.ti,36 this section will not review specific software packages as criteria for selecting QDA software packages can be found elsewhere.37
Data management
A deceptive aspect of qualitative research is that though the number of participants is relatively small, the volume of data generated can still be vast, and sometimes overwhelming. The documents (e.g. interview transcripts) were stored and organized within the QDA software program as it provided the means to readily view, search, and index the data. As this study sought to conduct analyses across various levels, including service setting (RTC vs. TFC), individual program, and type of staff (e.g. clinical front-line staff), the documents were electronically grouped together accordingly. The QDA software generated reports and queries that stratified the data by these groups.
Data display, review and reduction
Grounded theory methodology, which involves analyzing textual data closely in order to identify key concepts and underlying processes, guided the data reduction and analysis process.38 “Data reduction” refers to the overall analytic process of breaking down, reconfiguring, and transforming raw data into manageable, meaningful information.38
The data reduction process began with “open coding,” which consisted of closely examining the data in order to identify, describe, and develop emerging concepts.38 For this set of analyses, passages that described how data were used to inform various types of decisions were identified in the text and labeled with the code, “linking data to decision-making.” Comments were made to describe and define the code. This helped ensure that its meaning and its application were used consistently throughout the analysis. The coding process began on paper, and later, using the QDA software, codes and comments were electronically recorded.
“Axial coding,” the next step in the data reduction process, involved making connections between concepts in order to refine emerging categories and develop explanations related to how staff used data for decision-making.38 All text coded as “linking data to decision-making” were reviewed to gain further insight into decision-making processes. A report was generated using the QDA software that consisted of the passages of text coded as “linking data to decision-making,” along with the associated comments.
The data display, review and reduction steps were intimately connected at this stage of the analysis. Using the QDA report, matrices were created to describe the different ways staff used the data. Data matrices are ordered tables that display and organize data to readily identify patterns. Passages of text that described similar ways of using data to inform decisions were electronically cut and pasted into a data matrix. The resulting data matrices showed that the code labeled “linking data to decision-making” described nine distinct ways data were used to inform decisions. These findings were written up in a “memo,” a document used to record and make sense of emerging patterns, meanings, or ideas related to the phenomena of interest:34 how data were used to inform decisions. QDA software can be used to electronically link memos to relevant passages of text and associated codes, which helps identify relationships between concepts.
The QDA software was used to create nine new codes that described each of the different ways data were used for decision making and electronically re-code passages labeled “linking data to decision-making.” This step complete, the analyses continued with these new, refined codes.
Drawing conclusions
Up to this point, how data usage varied by type of staff, service or program had yet to be examined. In this stage of the analysis, case study methodology was applied. How different types of staff used data for decision-making was compared within the context of their program and treatment milieu, and across the different types of service. QDA software generated reports that facilitated these cross-case comparisons. Another series of data matrices were created using reports that stratified the newly re-coded data by role type, program type, and individual program.
Figure 1 illustrates this analytic process using some of the study findings. First, a report was generated that contained all the passages of text originally coded “linking data to decision-making” and now coded “monitoring treatment,” which described how structured data were used to monitor progress in treatment and inform treatment-related decisions. The QDA software grouped together and displayed data coded as “monitoring treatment” by role type and program type. The report also identified the individual programs. As shown in step 2 of Figure 1, how different types of staff and service settings used data for monitoring treatment were compared. Variation in data usage across the individual programs was also examined by comparing how different types of staff used data across the two different types of service, as well as within their program. The patterns that emerged across these levels of analysis were then integrated and summarized. This analytic process was replicated for each of the nine newly created codes.
Figure 1.
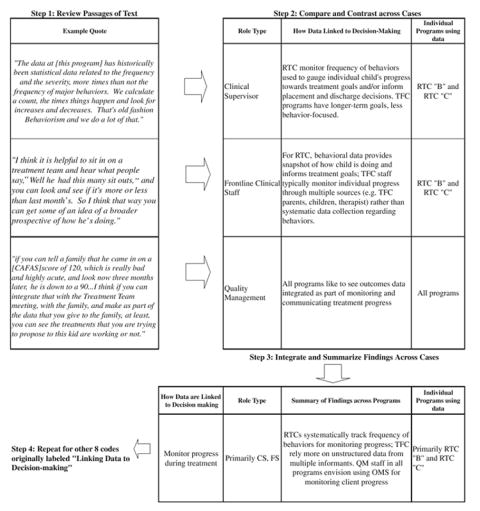
Illustration of analytic process for monitoring progress during treatment
These findings suggested the need to investigate the context under which decisions were made and the types of data used by staff. During the next stage of analysis, “selective coding”—which involves integrating and defining the inter-relationships among the categories—various aspects of the decision-making process were analyzed.38 QDA software were used to examine coded data that described: different types of data being used by staff; mechanisms for conducting quality improvement; and various elements of the treatment team decision-making process. These data were examined to identify patterns across individual program, service setting, and type of staff. Notes regarding observations of treatment team and quality improvement meetings were reviewed in order to identify the key characteristics of data used in these contexts and to describe how data were incorporated into decision-making. The concepts that emerged from this analytic step were depicted visually. Some QDA software programs can be used for this purpose. The results were integrated with the earlier findings (as shown in Fig. 1), and used to generate Table 3.
Table 3.
Linkages between data and decision-making
| Type of Decision | Type of Staff Using Data | Programs Using Data | How Data are Linked to Decisionmaking | Examples of How Data Informs Decisions |
|---|---|---|---|---|
| Program Management | SM,CS | RTC & TFC | Guide program operations | Source and number of referrals from state/local public agencies used to recruit TFC families and “market” to state agencies; Frequency of seclusion and restraints to evaluate performance of new behavioral management system in RTC |
| Quality Improvement (QI) | Primarily QM, with SM; TFC B: All types of staff | RTC & TFC | Review aggregate level data to: Identify “improvement opportunities”; Ensure standardization of care; Monitor safety | TFC “B” sought to reduce trend that indicated increase in discharges to shelter care. RTC “B” also compared their performance to other similar programs. |
| Treatment-Related | Clinical Staff (CS & FS)
QM advocating use of OMS |
Primarily RTCs.
TFCs using structured, behavioral data less systematically |
Identify needs and level of care | Only TFC “B” used CAFAS data to determine the intensity of services that would be provided and levels of foster parent reimbursement. |
| Inform clinical judgement in treatment team meetings | Generate treatment goals using measures of behavior (e.g. sit-outs) in conjuction with clinical judgement | |||
| Monitor progress in treatment teams | RTCs systematically track frequency of behaviors for monitoring progress; TFC rely more on unstructured data from multiple informants. QM staff in all programs envision using OMS for monitoring client progress | |||
| Target areas to focus on for treatment | Used admission data and client interview to identify areas to target during treatment | |||
| Program Evaluation | All types of staff | RTC & TFC | Demonstrate effectiveness & value of program to payers | Envision using outcomes data for this purpose |
| Data-based Decisions | All types of staff except front-line clinical staff | RTC & TFC | Challenge thinking
Provide support for decisions |
Used data to challenge assumptions related to client progress and promote discussion |
| Recognized the need to use data instead of anecdotes to substantiate decisions |
Key: FS Front-line Staff, CS Clinical Supervisors, QM Quality Management, SM Senior Management, TFC Treatment Foster Care, RTC Residential Treatment Center
Verification
The credibility of the findings were assessed by obtaining feedback at a MARFY sponsored conference that was attended by organizations that had once or were still using the OMS.39 Findings were also corroborated by triangulation, comparing data across methods (interviews and observations) and sources (different types of staff and contexts).34
Results
Though all types of staff across both RTC and TFC programs recognized the importance of outcomes data for demonstrating the impact of their work and quality management staff envisioned using the OMS data for informing clinical care processes, most programs did not regularly use the OMS data to inform clinical or managerial decisions. Instead, staff from these programs routinely collected and used other types of information. As shown in Table 3, these other types of systematically collected data supported decision-making generally, in addition to informing the management of programs, quality improvement meetings, and treatment-related processes.
Data served to challenge thinking and provide support for decisions. Executive directors’ and senior managers acknowledged that they relied too heavily on individual vignettes, anecdotal data, and opinions to substantiate their work, and needed to use outcomes data. Though clinicians described their decisions as guided largely by “intuition backed by lots of experience and education,” they also acknowledged the difficulty in “articulating my intuitions” and described how the OMS data on functioning served as a “secondary source that very much supports what we had already said in the treatment team.” Structured data also served to challenge thinking and assumptions. When the director of health services at RTC “C” (see Table 1) showed staff data that included a rise in the number of restraints and seclusions, she stated that, “subjectively, they felt they knew it, but when the number went up on the board and they saw it, it was pretty shocking.” The use of data stimulated a more serious discussion regarding strategies to reduce these restrictive practices.
As shown in Table 3, structured data also served to inform specific types of decisions. Clinical supervisors, quality management, and senior managers used structured, quantitative data to run their operations and to make adjustments to their programs. Though all programs reviewed client satisfaction level data, typically different types of data were used by RTCs and TFCs to inform program level decisions. For example, TFC managers reviewed data on the source and number of admissions from state and local public agencies to determine the number of foster families that needed to be recruited and determine which referral agencies to target for “marketing.” Clinical supervisors and other senior managers in RTCs reviewed changes in the number of restraints and seclusions as a means of assessing the effectiveness of behavioral management systems.
Quality management decision-making process
Quality Improvement (QI) meetings served as a major vehicle for reviewing and acting on data, providing the means to identify opportunities to—as one TFC quality management director described—“learn from our mistakes.” As shown in Table 3, QI participants examined trends in aggregate level data and compared their performance to other programs to identify areas that needed to be improved, to ensure standardization of care and to monitor safety. An “improvement opportunity” led to the development of a work group or committee to examine an issue, if warranted. For example, all programs monitored the occurrence of a critical incident (e.g. injury). These incidents would be routinely reviewed in order to identify the need for changes in procedures or policy.
Quality management processes across both types of programs reviewed data related to safety (‘critical incidents’), restraints and seclusions, complaints and grievances, satisfaction, and quality assurance measures (e.g. emergency preparedness).The OMS data were not regularly reported in these forums. When it was reported, the discussion typically focused on the interpretation and validity of the data rather than stimulating “improvement opportunities.”
Though all programs had established these quality management processes, variation existed across the programs with regards to sophisticated use of the data and level of staff involvement. For example, though quality management and leadership staff described the value of comparative data in each of the programs, only RTC “B” (see Table 1) actually compared their performance on multiple measures (functioning, the frequency of medication errors, therapeutic holds, and seclusions) to other similar programs across the country that were collecting these data. Unlike the other organizations, this RTC devoted the resources to participate in such an initiative and the senior management valued it for accreditation. Other programs compared only one type of data and experienced difficulty finding programs that had similar populations. RTC “C” only compared their safety data to other RTCs that served different populations, making it difficult to derive any conclusions. TFC “B” (See Table 1) was in the process of contacting one local TFC program serving a similar population to compare their functioning data. The quality management manager of TFC “A” had the expertise to download and analyze summary level data from the OMS to compare levels of functioning across programs; however, there were few participating programs that served the same population, young children. Other programs did not compare their OMS data because they lacked the expertise to obtain and manipulate the data, for example, adjusting for case-mix.
Broad levels of participation in quality management decisions varied across the programs. As indicated in Table 3, only the quality management staff in TFC “B” invited all staff to participate in meetings where aggregate level data were presented related to referrals and source of admission, discharge placements, disruptions (change in placement while in care), and client satisfaction with services. Resources, such as a part-time information systems staff member, were dedicated to generate reports. According to quality management staff, the involvement of staff at various levels in these activities led TFC “B” to move from a “management driven model to a quality improvement driven model, which attempts to…flatten decision making.”
The TFC “B” quality improvement meeting participants’ response to the high number of placements to shelter care, an emergency, non-therapeutic environment, illustrates the participatory, data-based decision-making process. Participants formalized a work group to examine why this trend was occurring and to identify solutions. A case manager described how the initial examination of this data led them to “ask[ing] ourselves questions—well, who does that happen most often to?” After determining that adolescent girls were primarily affected, case managers conducted discussion groups with foster parents to determine the cause. Addressing parents’ concerns and misperceptions about the level of safety actually provided by shelter care reduced the number of discharges to shelter care, which quality management and clinical staff attributed to “a result of data that we looked at.”
The development of a culture supportive of participatory, data-based decision-making was not present in the other programs. It was not common for front-line clinical staff to participate in examining aggregate level data. Though all these organizations had quality improvement processes—required for accreditation—only senior, managerial staff were involved.
Widespread staff involvement in the other programs were hampered by limited resources and expertise devoted to analyzing and broadly disseminating data, perceptions that the data were too complex and staff knowledge too limited, and organizational hierarchy. None of the other programs devoted resources to analyzing or disseminating aggregate level data to all types of staff. In TFC “A”, the data were perceived to be “over people’s heads.” Until “we can get information that really makes sense to people,” quality management staff wanted to “keep it [reporting data] at the senior management or senior leadership team level” rather than including front-line staff. In both the RTC programs, formal quality improvement mechanisms largely existed at higher levels within the organizational hierarchy which limited broad staff exposure to such forums and data.
Treatment-related decision-making process
The treatment team served as another major forum for reviewing data. Treatment team meetings served as “kind of the hub for the major decisions…the treatment decision and the placement decision.” Both types of programs held regular meetings attended by multi-disciplinary staff members to set long-term treatment goals for a child’s Individual Treatment Plan (ITP) and to monitor progress during a child’s episode of care. However, the programs differed in the intensity of services they offered, which was reflected in how often these types of meetings were conducted and who attended them. TFC programs held ITP meetings less frequently (on a quarterly rather than monthly basis) than RTC programs. RTC treatment teams also held additional meetings to monitor short-term progress. ITP treatment team meetings from both programs included program staff, state or local agency representatives, biological parents, foster parents (for TFC), and sometimes the child, depending upon his or her age and interest. Therapists and psychiatrists did not regularly attend TFC treatment team meetings; instead, case managers coordinated with them outside of these meetings.
Across all programs, discussions during the treatment team meeting helped staff identify the “core issues” affecting the child. The treatment team meetings served as an open, participatory forum whereby “each person at the meeting shares from his or her point of view.” Treatment goals were chosen or modified, and the progress a child made towards reaching those goals was monitored over time to see “if they need to be changed or tweaked in any way.” The information communicated by staff served to summarize the “highlights—the main therapeutic themes—anything the child shared that was significant for everyone to know.” The treatment team meetings also kept “you aware of…how each one of the children was progressing and what’s the current issue for them so that you really feel like you’re kept up-to-date with the information.” A standard, paper form was used to document these issues, goals, and progress.
Participatory decision-making in treatment teams encouraged data usage. Front-line clinical staff were able to engage with and become comfortable using structured data. These forums allotted time to examine the data, unlike individualized clinical work where other priorities competed for attention. Clinicians described how structured data were helpful in the context of the meeting, but “when I’m in one on one, I’m not thinking about what they said at the treatment team specifically.” Clinicians reviewing data on their own were also limited to “their own personal experiences; you’re not drawing upon enough numbers to have meaningful data,” whereas, a “group of people reviewing them together might be able to…interpret that more meaningfully.”
As shown in Table 3 and exemplified by the quote shown in Figure 1, quality management staff in all the programs envisioned using the OMS data for monitoring progress during treatment; however, these data were not integrated with specific clinical processes. The timing of the OMS data collection was not coordinated with treatment team meetings and the data were not used to determine or assess progress towards meeting treatment goals. Only TFC “B” consistently used the OMS data on functioning to help determine the intensity of services provided to the child and the level of reimbursement provided to the parent. They did not use this data to inform other treatment decisions.
Instead, the programs relied on other types of data to inform their work. RTC programs used data related to behavior management to inform clinical care. Direct care staff documented a child’s behavior throughout the day, summarizing the data daily on paper forms. Thus, timely feedback was provided to clinical staff and children on a regular basis. A point system based upon a child’s behavior determined the level of privileges a child was allowed. Clinical staff monitored these data systematically because they considered it “clinical information that’s very helpful within treatment” and strongly linked to behavioral interventions, as exemplified by the quotes shown in Figure 1.
As shown in Table 3, clinical supervisory and front-line staff in RTC programs used structured data to inform a variety of treatment-related decisions, including: identifying needs and level of care; targeting areas to focus on during treatment; monitoring progress during treatment and informing clinical judgment. Clinicians in RTC treatment teams used records of behavioral data in conjunction with assessments that were based upon their interactions with the child. These data enabled clinical staff to identify problems or core issues, corroborate their assessments, and make treatment decisions or decide to further investigate areas of concern. Clinical staff considered these data highly relevant to treatment goals, which often focused on improving behavior, reducing and controlling symptoms, and crisis stabilization. The typical goals of an I.T.P. (Individual Treatment Plan) included reduction in the number of: therapeutic holds, P.R.N.(extra medication the child needed outside of their regular medication to control their behavior), L.E.T.O. (Locked, Exclusionary Time-Out), self-harm behaviors or statements, and auditory or visual hallucinations.
These data were also used to assess the intensity of services needed, adjust interventions employed (including medication), and plan for discharge. For example, changes in the frequency of negative behaviors and efforts to control those behaviors (e.g. time-outs), stabilization in medication regimen and reduction or stabilization of other symptoms served as criteria used by an RTC unit director to discharge a child to a less intensive setting of care.
Though senior clinical staff in these settings envisioned using data to quickly identify areas to address in treatment, guide discharge planning and justify lengths of stay to payers, some staff also voiced concerns regarding their reliance on negative behaviors to inform decisions, and the limitations of such data. Though therapists in RTCs found it helpful to see changes in the number of “time-outs” from the prior month to monitor the effect of treatment, clinicians recognized “no magical number” exists “because these are not standardized instruments” but rather “descriptive” tools. There was some acknowledgement that monitoring positive behaviors was a necessary next step in measurement, “which was a little more sophisticated than just saying he was no longer aggressive; get him out of here.”
In contrast to RTCs, TFC treatment teams monitored client progress primarily based upon assessments reported by those involved with the child’s care, and the case manager’s interactions with and observations of the child and family. Issues discussed by treatment team members included: “their medical appointments, their therapy, how they are doing at school, their educational goals, [and] the goals that the case manager was working with them on.” In contrast to RTCs, TFC programs emphasized longer-term placement goals, such as permanency planning (e.g. re-unification with biological family) or developing independent living skills.
Yet, they also addressed and monitored the behaviors of children with severe problems as part of clinical care processes. Goals were typically written in a standardized format that sometimes called for monitoring specific behaviors. For example, a case manager described that a goal that addressed depression might have objectives that related to “specific depression-related behaviors like maintain hygiene, eat three meals a day, [and] decrease frequency of irritable statements or negative statements.”
However, TFC case managers did not routinely use structured instruments or rigorously document observations of children’s behavior. The use of structured assessments by therapists was done on an ad-hoc basis. Case managers worked with foster parents who were largely responsible for supervising children within their homes. Thus, case managers noted that “you might be relying on a parent’s observation and input which is not as good a measurement,” as compared to behavior management tracking systems. TFC “A” did ask foster parents to record a summary of their observations regarding the child’s behaviors, medication adherence, interactions with family and peers, as well as progress at school, and acquisition of life skills over the week. Yet, this was not structured (e.g. recording the frequency and severity of behaviors using a rating scale); it served as the parents’ subjective assessment. TFC “B” also collected medication adherence data, but other parent-reports of behavior varied by case manager, though some therapists began recording “a time-line of behaviors for children who were starting to exhibit high risk behaviors” as part of clinical supervision. Clinicians regarded these structured data as useful to gauge improvement, though not as helpful for determining the type of intervention that should be used.
In summary, the data used for decision-making possessed the following properties: they were measured frequently; data collection was routine, simple and quick; data elements were regarded as reliable, relevant and easy to understand by multi-disciplinary staff; summaries of the data were easy to obtain and regularly provided to staff; data directly informed treatment strategies and were used in conjunction with clinical judgment during treatment team meetings or were aggregated to inform program-level and quality management processes; and many of these data elements were also tracked for regulatory or accreditation purposes.
Discussion
This study describes how staff in child and adolescent out-of-home care service programs used data on processes of care and information on child behavior to inform certain clinical, program, and quality management decisions. These systematically collected data were primarily used within group contexts such as treatment teams and quality management meetings. Gathered from a number of sources, these data—some of which were structured and quantitative in nature—were locally developed and tailored to inform routine decision-making processes. Similar to findings from prior research focused on clinicians’ use of outcomes management systems data,16,40,41 this study found that staff at all levels of the organization rarely or never used data from an available OMS to inform their work. Only one program routinely used the OMS data on functioning for setting reimbursement levels for TFC parents and determining the intensity of services for children.
An examination of data-based decision-making within these settings provides insight into the conditions that could support the use of an OMS. This study found that, unlike the OMS data, the types of data used by staff were closely linked to decision-making processes, particularly within treatment teams and quality management meetings. The data facilitated the way these processes operated, providing evidence to support decisions and to stimulate change. The content and credibility of the data, the manner in which the data were collected and reported, and the group decision-making context influenced data based decision-making.
The characteristics of the data and systems used to collect these data reflect properties demonstrated in prior research to enhance the impact of feedback, ensuring its utility.42 As found in prior studies, clinical staff valued specific, narrowly focused data16,18 such as the frequency of problem behaviors and safety issues (critical incidents and disruptions in placement). These data were valued and used because their content was directly related to treatment strategies and clinical processes, and the data were regarded as credible and easy to understand by a diverse group of staff.
Additionally, the manner in which information was collected and reported was able to “mirror the decision-making process itself,”43 reflecting the dynamic nature of clinical decisions which occur frequently during a child’s treatment, not simply at admission and discharge. Frequent feedback was provided in a manner that informed decisions. Timely, specific, and relevant information collected and reported regularly during treatment at the client-level provides greater opportunities to stimulate changes in care.42 The ability of the outcomes data to be informative hinges on coinciding the data collection and reporting of OMS data with the timing of treatment team and quality management meetings, and incorporating the data as part of these processes.
Decision-making within organizations is a complex set of nested processes that must consider the context in which a decision occurs and the multiple actors involved.44 Furthermore, participatory decision-making is recognized as an important aspect of quality improvement activities and teamwork, generally.45 Within these complex service settings, group forums such as treatment teams and quality management meetings served as important vehicles for sharing and discussing data. The involvement of multi-disciplinary staff representing different levels of the organization was a key ingredient to making sense of the data available to them. Meetings in which all levels of staff participated and actively used data fostered staff engagement with data-based decision-making.
Variation in how data were used related to differing organizational contexts, service settings and staff roles. Organizational context, specifically the climate, culture and structure of an organization, influence the ability to adopt and implement innovative practices.45 In these organizations, organizational hierarchy, limited resources devoted to data analysis and dissemination, and low levels of staff knowledge and expertise, inhibited the development of a culture and set of processes supportive of participatory, data-based decision-making. Differences in service settings and staff roles also influenced how and what types of data were used. RTC programs placed greater emphasis on measures related to behavior management as compared to TFC programs because children’s problems in RTCs were acute and treatment goals were more short-term, and the responsibilities of TFC case managers differed from RTC clinical staff.
QDA Methods and Software
Despite the controversy that exists regarding the use of QDA software,46 this study demonstrates how the application of QDA software potentially speeds up certain, more routine elements of the qualitative research process and enables a more thorough examination of data. QDA software provides a means to simplify some of the procedures of qualitative analysis, including applying codes to the text, altering the codes, assessing the consistency of coding across interviews and searching for text labeled with specific codes. The use of QDA software also provides analytic tools for examining the data thoroughly (for example by identifying all instances of text labeled with a particular code), efficiently and potentially in complex, sophisticated ways.
However, legitimate concerns exist regarding researchers’ false hopes that QDA software will do the analysis for them, eliminating the time-consuming process of analyzing large amounts of text.37 The time-consuming nature of getting to know the data is a necessary part of qualitative research, regardless of whether QDA software is applied. The use of QDA software also does not substitute for methods47 nor does it necessarily make the analytic process more rigorous.37 The analytic approach must be guided by methods and theory, and requires the investigator to interact with and transform data, as illustrated in Figure 1. While QDA software can speed up coding and retrieving data, it does not offer “shortcuts” to analysis.47,48
Implications for Behavioral Health
Improving the utility of outcomes management systems is critical, as the resulting data can be used to develop support for and monitor the implementation of evidence-based treatments in real-world settings,15 identify “practice-based evidence,”24,49,50 and guide clinical decision-making.51 This study’s examination of the conditions that support the use of data within child and adolescent out-of-home care placement settings suggest that this will require changes in how outcomes management systems are designed and implemented.
The design of an outcomes management system should emanate from clinical, quality management and program needs, enhancing the provision of information to staff. The next generation of outcomes management systems must provide timely, clinically relevant feedback, for example by alerting clinicians of children who are not progressing well in treatment.52,53 Incorporating the types of data used by staff for making routine decisions within the design of an OMS will promote staff buy-in and usage of the system. The system must be implemented in a manner that is tailored to how different types of staff make decisions and use data, especially within group contexts. Involving all types of staff to review the data may increase OMS use and help staff develop a better understanding of how to interpret the data.
Outcomes systems that appeal to a broad set of external stakeholders may not be tailored to inform organizational and staff-level decision-making processes. To address this issue, qualitative methods can be strategically employed to obtain user input to shape the design and scale of these systems,12 to develop mechanisms for using outcomes data as part of routine decision-making processes, and to periodically assess the usefulness of these systems. Obtaining user input will enable these systems to develop and evolve in a manner that meets users’ needs, and thereby generate and sustain their relevance. Balancing the drive to standardize outcomes management systems with the need tailor systems to the needs of individual programs, different service settings, and staff across organizational levels will be challenging. However, systematically linking outcomes data to decision-making processes is a critical component of realizing Berwick’s vision that “flawless care requires not just sound decisions but also sound supports for those decisions.”54
Acknowledgments
We would like to thank the participants for sharing their thoughts on issues that affect the children they serve and the organizations they work in. We would like to acknowledge the assistance of Susan Berkowitz of Westat Corporation in helping develop the semi-structured field guides and guiding early stages of the project. We would like to thank Sharon Hodges and anonymous reviewers for their comments. This research was conducted while the first author was a doctoral student at Johns Hopkins Bloomberg School of Public Health in the Department of Health Policy and Management. This work was supported by National Institute of Mental Health # F31 MH68097, P50 MH43703, and T32 MH19545; Johns Hopkins University’s Charles D. Flagle Award and Ernest Lyman and Helen Ross Stebbins Award; and Canadian Institutes of Health Research funded Research on Addictions and Mental Health Policy & Services award.
References
- 1.Joint Commission. Facts about ORYX: The Next Evolution in Accreditation. [accessed December 1, 2005];2005 Available at: http://www.jcaho.org/accredited+organizations/behavioral+health+care/oryx/the++next+evolution.html.
- 2.U.S. Public Health Service. Report of the Surgeon General’s Conference on Children’s Mental Health: A National Action Agenda. Washington, DC: Department of Health and Human Services; 2000. [Google Scholar]
- 3.Gonzalez O, Hall J, Pandiani JA, et al. The 16 state indicator pilot grant project:selected performance indicators and implications for policy and decisionmaking. In: Manderscheid RW, Henderson MJ, editors. Mental Health, United States, 2000. Rockville, MD: Center for Mental Health Services; 2001. [Google Scholar]
- 4.Manderscheid RW, Henderson MJ, Brown DY. Status of national accountability efforts at the millennium. In: Manderscheid RW, Henderson MJ, editors. Mental Health, United States, 2000. Rockville, MD: Center for Mental Health Services; 2001. [Google Scholar]
- 5.Brodey BB, Cuffel B, McCulloh J, et al. The acceptability and effectiveness of patient-reported assessments and feedback in a managed care behavioral setting. The American Journal of Managed Care. 2005;11:774–780. [PubMed] [Google Scholar]
- 6.Lambert MJ, Harmon C, Slade K, et al. Providing feedback to psychotherapists on their patient’s progress: clinical results and practical suggestions. Journal of Consulting and Clinical Psychology. 2005;61:165–174. doi: 10.1002/jclp.20113. [DOI] [PubMed] [Google Scholar]
- 7.Lambert MJ, Hansen NB, Finch AE. Patient-focused research: using patient outcomes to enhance treatment effects. Journal of Consulting and Clinical Psychology. 2001;69:159–172. [PubMed] [Google Scholar]
- 8.Barwick M, Boydell KM, Cunningham CE, et al. Overview of Ontario’s screening and outcome measurement initiative in children’s mental health. The Canadian Child and Adolescent Psychiatry Review. 2004;13:105–110. [PMC free article] [PubMed] [Google Scholar]
- 9.Boydell KM, Barwick M, Ferguson HB, et al. A feasibility study to assess service providers’ perspectives regarding the use of the child and adolescent functional assessment scale in Ontario. Journal of Behavioral Health Services Research. 2005;32:105. doi: 10.1007/BF02287332. [DOI] [PubMed] [Google Scholar]
- 10.Beck SA, Meadowcroft P, Mason M, et al. Multi-agency outcome evaluation of children’s services: a case study. Journal of Behavioral Health Services Research. 1998;25:163–176. doi: 10.1007/BF02287478. [DOI] [PubMed] [Google Scholar]
- 11.Rouse LW, Toprac MG, MacCabe NA. The development of a statewide continuous evaluation system for the Texas Children’s Mental Health Plan: a total quality management approach. Journal of Behavioral Health Services Research. 1998;25:194–207. doi: 10.1007/BF02287480. [DOI] [PubMed] [Google Scholar]
- 12.Blank MB, Koch JR, Burkett BJ. Less was more: Virginia’s performance outcomes measurement system. Psychiatric Services. 2004;55:643–645. doi: 10.1176/appi.ps.55.6.643. [DOI] [PubMed] [Google Scholar]
- 13.Koch JR, Lewis A, McCall D. A multi-stakeholder driven model for developing an outcomes management system. Journal of Behavioral Health Services Research. 1998;25:151–162. doi: 10.1007/BF02287477. [DOI] [PubMed] [Google Scholar]
- 14.Savas S, Fleming WM, Bolig EE. Program specification: a precursor to program monitoring and quality improvement. A case study from Boysville of Michigan. Journal of Behavioral Health Services Research. 1998;25:208–216. doi: 10.1007/BF02287481. [DOI] [PubMed] [Google Scholar]
- 15.Hodges K, Wotring J. The role of monitoring outcomes in initiating implementation of evidence-based treatments at the state level. Psychiatric Services. 2004;55:396–400. doi: 10.1176/appi.ps.55.4.396. [DOI] [PubMed] [Google Scholar]
- 16.Garland AF, Kruse M, Aarons GA. Clinicians and outcomes measurement: what’s the use? Journal of Behavioral Health Services Research. 2003;30:393–405. doi: 10.1007/BF02287427. [DOI] [PubMed] [Google Scholar]
- 17.Hodges S, Woodbridge M, Huang LN. Creating useful information in data-rich environments. In: Hernandez M, Hodges S, editors. Developing Outcome Strategies in Children’s Mental Health. Systems of Care for Children’s Mental Health. Baltimore, MD: Paul H Brookes Publishing Co; 2001. [Google Scholar]
- 18.Bickman L, Rosof-Williams J, Salzer MS, et al. What information do clinicians value for monitoring adolescent client progress and outcomes? Professional Psychology: Research and Practice. 2000;31:70–74. [Google Scholar]
- 19.Moorman C. An innovation adoption approach to the dissemination of health care information to consumers. In: Sechrest L, Becker TE, Rogers EM, Campbell TF, Grady ML, editors. Effective Dissemination of Clinical and Health Information. Washington, DC: Agency for Health Care Policy Research; 1994. pp. 49–68. [Google Scholar]
- 20.Frambach RT, Schillewaert N. Organization innovation adoption: a multi-level framework and determinants and opportunities for future research. Journal of Business Research. 2002;55:163–176. [Google Scholar]
- 21.Rogers EM. Diffusion of Innovations. New York: The Free Press; 1995. [Google Scholar]
- 22.Glisson C. Judicial and service decisions for children entering state custody: the limited role of mental health. Social Services Review. 1996;10:257–281. [Google Scholar]
- 23.U.S. DHHS. Mental Health: A Report of the Surgeon General. Rockville, MD: U.S. Department of Health and Human Services, Substance Abuse and Mental Health Services Administration, Center for Mental Health Services, National Institute of Mental Health; 1999. [Google Scholar]
- 24.Lyons JS, McCulloch JR. Monitoring and managing outcomes in residential treatment: practice-based evidence in search of evidence-based practice. Journal of American Academy of Child & Adolescent Psychiatry. 2006;45:247–251. doi: 10.1097/01.chi.0000190468.78200.4e. [DOI] [PubMed] [Google Scholar]
- 25.Lyons JS, Terry P, Martinovich Z, et al. Outcome trajectories for adolescents in residential treatment: a statewide evaluation. Journal of Child and Family Studies. 2001;10:333–345. [Google Scholar]
- 26.Geertz C. The Interpretation of Cultures. New York: Basic Books; 1973. [Google Scholar]
- 27.Creswell JW. Qualitative Inquiry and Research Design. Thousand Oaks, CA: Sage; 1998. [Google Scholar]
- 28.Buston K. NUD*IST in action: its use and its usefulness in a study of chronic illness in young people. [accessed 1/7/2004];Sociological Research Online. 1997 2 serial online. Available from: http://www.socresonline.org.uk/home.html.
- 29.Streider F, Ayers D. SumOne for kids—Maryland: an outcome evaluation system; Paper presented at: The American Association of Children’s Residential Centers; October 18, 1997; Minneapolis, MN. [Google Scholar]
- 30.Hodges K, Wong MM. Psychometric characteristics of a multidimensional measure to assess impairment: the child and adolescent functional assessment scale. Journal of Child and Family Studies. 1996;5:445–467. [Google Scholar]
- 31.Hodges K. Child and Adolescent Functional Assessment Scale (CAFAS) In: Maruish ME, editor. The Use of Psychological Testing for Treatment Planning and Outcomes Assessment. 2. Mahwah, NJ: Erlbaum; 1996. pp. 631–664. [Google Scholar]
- 32.Yin R. Case Study Research: Design and Methods. 3. Thousand Oaks, CA: Sage; 2003. [Google Scholar]
- 33.McDonnell A, Jones ML, Read S. Practical considerations in case study research: the relationship between methodology and process. Journal of Advanced Nursing. 2000;32:383–390. doi: 10.1046/j.1365-2648.2000.01487.x. [DOI] [PubMed] [Google Scholar]
- 34.Patton MQ. Qualitative Evaluation and Research Methods. 3. Thousand Oaks, CA: Sage; 2002. [Google Scholar]
- 35.Miles MB, Huberman AM. Qualitative Data Analysis. Thousand Oaks, CA: Sage; 1994. [Google Scholar]
- 36.Muhr T. User’s Manual for ATLAS.ti 5.0. Berlin: ATLAS.ti Scientific Software Development GmbH; 2004. [Google Scholar]
- 37.Weitzman EA. Software and qualitative research. In: Denzin N, Lincoln Y, editors. Handbook of Qualitative Research. 2. Thousand Oaks, CA: Sage; 2000. pp. 803–820. [Google Scholar]
- 38.Strauss A, Corbin J. Basics of Qualitative Research. 2. Thousand Oaks: Sage; 1998. [Google Scholar]
- 39.Patton MQ. Enhancing the quality and credibility of qualitative analysis. Health Services Research. 1999;34:89–208. [PMC free article] [PubMed] [Google Scholar]
- 40.Valenstein M, Mitchinson A, Ronis DL, et al. Quality indicators and monitoring of mental health services: what do frontline providers think? American Journal of Psychiatry. 2004;161:146–153. doi: 10.1176/appi.ajp.161.1.146. [DOI] [PubMed] [Google Scholar]
- 41.Huffman LC, Martin J, Botcheva L, et al. Practitioners’ attitudes toward the use of treatment progress and outcomes data in child mental health services. Evaluation & Health Professions. 2004;27:165–188. doi: 10.1177/0163278704264058. [DOI] [PubMed] [Google Scholar]
- 42.Saptya J, Riemer M, Bickman L. Feedback to clinicians: theory, research and practice. Journal of Consulting and Clinical Psychology. 2005;61:145–153. doi: 10.1002/jclp.20107. [DOI] [PubMed] [Google Scholar]
- 43.Greenhalgh J, Long AF, Flynn R. The use of patient reported outcome measures in routine clinical practice: lack of impact or lack of theory? Social Science & Medicine. 2005;60:833–843. doi: 10.1016/j.socscimed.2004.06.022. [DOI] [PubMed] [Google Scholar]
- 44.March J. The Pursuit of Organizational Intelligence. Malden, MA: Blackwell; 1999. [Google Scholar]
- 45.Glisson C. The organizational context of children’s mental health services. Clinical Child and Family Psychology Review. 2002;5:233–253. doi: 10.1023/a:1020972906177. [DOI] [PubMed] [Google Scholar]
- 46.Pfaffenberger B. Microcomputer Applications in Qualitative Research. Newbury Park, CA: Sage; 1988. [Google Scholar]
- 47.Kelle U. Theory building in qualitative research and computer programs for the management of textual data. [Accessed January 7, 2004];Sociological Research Online. 1997 2 serial online. Available from: Socresonline. [Google Scholar]
- 48.Bringer JD, Johnston LH, Brackenridge CH. Maximizing transparency in a doctoral thesis: the complexities of writing about the use of QSR*NVIVO within a grounded theory study. Qualitative Research. 2004;4:247–265. [Google Scholar]
- 49.Hodges K, Grunwald H. The use of propensity scores to evaluate outcomes for community clinics: identification of an exceptional home-based program. Journal of Behavioral Health Services Research. 2005;32(3):294–305. doi: 10.1007/BF02291829. [DOI] [PubMed] [Google Scholar]
- 50.Margison FK, Barkham M, Evans C, et al. Measurement and psychotherapy: evidence-based practice and practice-based evidence. British Journal of Psychiatry. 2000;177:123–130. doi: 10.1192/bjp.177.2.123. [DOI] [PubMed] [Google Scholar]
- 51.Bickman L, Karver MS, Schut JA. Clinician reliability and accuracy in judging appropriate level of care. Journal of Consulting and Clinical Psychology. 1997;65:515–520. doi: 10.1037//0022-006x.65.3.515. [DOI] [PubMed] [Google Scholar]
- 52.Lambert MJ, Hawkins EJ. Measuring outcome in professional practice: considerations in selecting and using brief outcome instruments. Professional Psychology: Research and Practice. 2004;35:492–499. [Google Scholar]
- 53.Harmon C, Hawkins EJ, Lambert MJ, et al. Improving outcomes for poorly responding clients: the use of clinical support tools and feedback to clients. Journal of Consulting and Clinical Psychology. 2005;61:175–185. doi: 10.1002/jclp.20109. [DOI] [PubMed] [Google Scholar]
- 54.Berwick DM. Continuous improvement as an ideal in health care. New England Journal of Medicine. 1989;320:1450–1454. doi: 10.1056/NEJM198901053200110. [DOI] [PubMed] [Google Scholar]