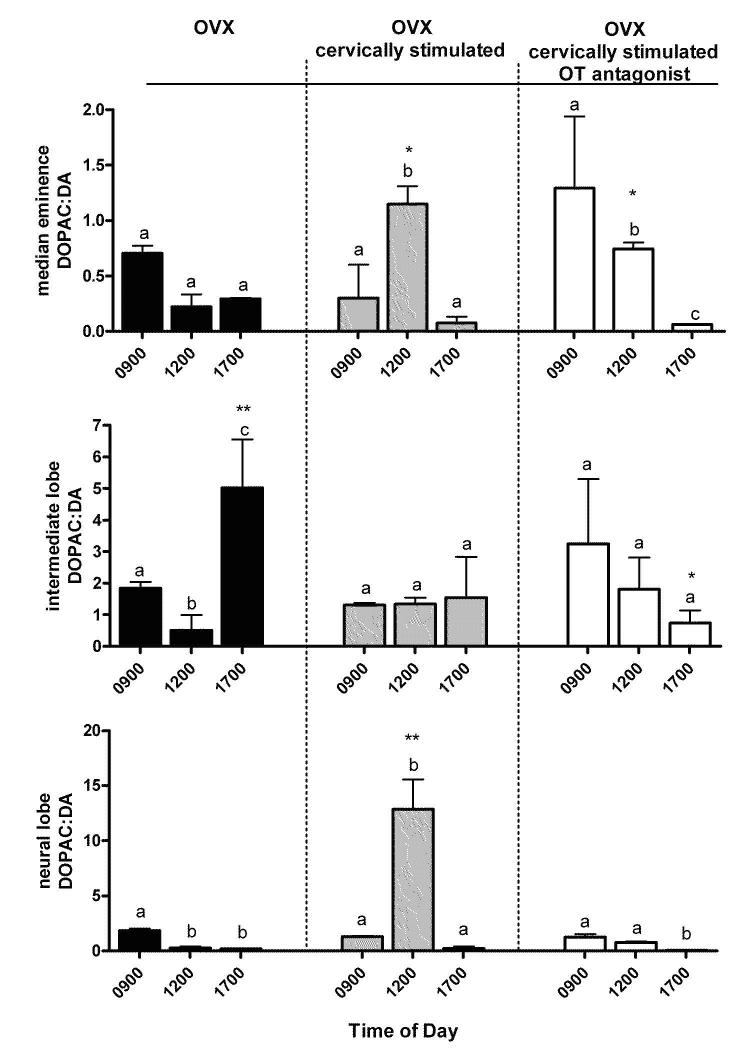
Figure 6.
DOPAC:DA ratio in the median eminence, intermediate lobe, and neural lobe indicating DA neuronal activity of the TIDA, PHDA, THDA, respectively of OVX, OVX-cervically stimulated, and OVX-cervically stimulated/OT antagonist treated rats at 0900 h, 1200 h, and 1700 h. Cervical stimulation induces an increase in DA neuronal activity in the TIDA and THDA neurons at 1200 h (P < 0.05), in anti-phase with PRL surges. The presence of the OT antagonist disrupts the anti-phasic DA neuronal activity. Values are expressed as mean DOPAC:DA ± SE (n=3-6). Astericks represent significant differences within anatomical area at the corresponding times between OVX, OVX-cervically stimulated, and OVX-cervically stimulated/OT antagonist (*P<0.05, **P<0.01). Dissimilar letters represent statistical differences between times within each treatment group.

